Deutsche Bank Global Auto Industry y Conference - Brad Hughes, CFO January 10, 2012

Page created by Raymond Wolf
 
CONTINUE READING
Deutsche Bank Global Auto Industry y Conference - Brad Hughes, CFO January 10, 2012
Deutsche Bank Global Auto Industryy
               Conference
              Brad Hughes, CFO

                                   January 10, 2012
1
Deutsche Bank Global Auto Industry y Conference - Brad Hughes, CFO January 10, 2012
Safe Harbor Statement
             This presentation contains strategic goals and other
     forward looking statements related to future financial results
     forward-looking
    and business operations for Cooper Tire & Rubber Company.
      Actual results may differ materially from the goals and from
     current management forecasts and projections as a result of
        factors over which the Company may have limited or no
        control. Information on certain of these risk factors and
       additional information on forward-looking statements are
     included in the Company’s reports on file with the Securities
    and Exchange Commission and are set forth at the end of this
                              presentation.
                              presentation
     FY 2011 results are scheduled to be released on Feb. 27, 2012
                     See Coopertire.com for details.
2
Deutsche Bank Global Auto Industry y Conference - Brad Hughes, CFO January 10, 2012
Available Information
    Our internet address is http://www.coopertire.com. We webcast our earnings calls and certain events
    we participate in or host on the investor relations portion of our website,
    http://coopertire.com/investors.aspx. We also make available on our website free of charge a variety
    of information for investors.
                        investors Our goal is to maintain the investor relations portion of the website as a
    portal through which investors can easily find or navigate to pertinent information about us,
    including:
    • our annual report on Form 10-K, quarterly reports on Form 10-Q, current reports on Form 8-K, and
        any amendments
                  d     t to
                           t those
                              th    reports,
                                           t as soon as reasonably bl practicable
                                                                           ti bl after
                                                                                   ft we electronically
                                                                                            l t i ll filfile
        that material with or furnish it to the Securities and Exchange Commission (“SEC”);
    • information on our business strategies, financial results and selected key performance indicators;
    • announcements of our p     participation
                                        p       at investor conferences and other events;;
    • press releases on quarterly earnings, product and service announcements and legal
        developments;
    • corporate governance information; and
    • other
         th news and   d announcements   t that
                                            th t we may postt ffrom ti
                                                                    time to
                                                                         t time
                                                                            ti that
                                                                                th t investors
                                                                                     i    t might
                                                                                               i ht find
                                                                                                    fi d
        useful or interesting.
    The content of our website is not intended to be incorporated by reference into this presentation or in
    any report or document we file with or furnish to the SEC, and any references to our website is
    intended to be inactive textual references only.

3
Deutsche Bank Global Auto Industry y Conference - Brad Hughes, CFO January 10, 2012
Agenda
     g
    Recent News
    Company Background
    Q3 2011 Summary
    Raw Materials
    Strategic Plan and Current Tactics
    Balance Sheet and Investments
    Changing Industry Factors
    Other Items
    Risks

4
Deutsche Bank Global Auto Industry y Conference - Brad Hughes, CFO January 10, 2012
Recent news
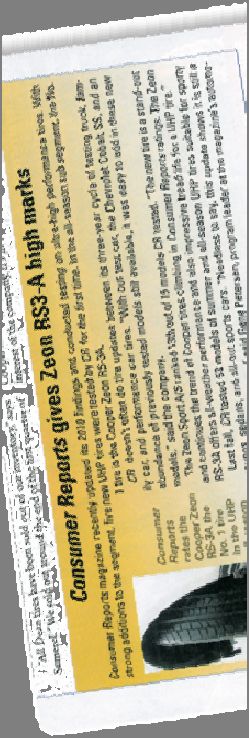
     July and September 2011 - Cooper Zeon RS3™ UHP tire and Cooper
     Discoverer A/T3™ tire recognized by a prominent consumer testing
     organization as best available on the market
     July 2011 - S&P upgraded CTB's corporate family outlook to positive
     from stable
     August 2011 - Cooper recognized by Sears with a Partner in Progress
     Award
     November 2011 - United Steelworkers Local 207L (USW) locked out of
     the Findlay plant
     December 2011 – Implemented a price increase in the U.S. of up to 5%
     with in-line adjustments effective Dec. 1, 2011
     December 2011 - Agreement signed to acquire the assets of an existing
     tire plant in Kruševac, Serbia

5
Deutsche Bank Global Auto Industry y Conference - Brad Hughes, CFO January 10, 2012
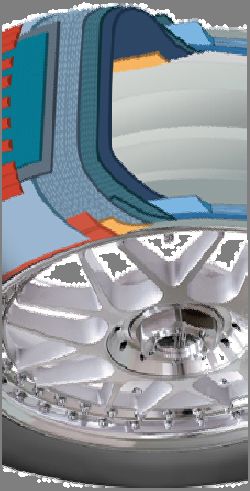
A leader in the tire industryy
        2010 Sales by Segment                               9th largest global tire manufacturer
                                                            and 4th largest in the U.S.
         30%                    North America
                                                            2010 revenue of $3.4 billion
                70%             International
                                                            13% market share in the U.S. light
                                                            vehicle replacement tire market
    5% 2010 Sales
            S l byb P
                    Product*
                        d t*                                Limited O.E.
                                                                    O E presence
     5%             Passenger                               Rapidly growing international
     20%            Light Truck                             segment
             50%    Commercial Truck
                    Winter
                                                            2010 unit sales ≈47 million tires
       20%          Specialty

6     *based on net sales, primarily in the replacement market
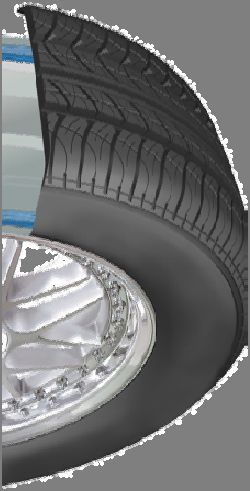
Deutsche Bank Global Auto Industry y Conference - Brad Hughes, CFO January 10, 2012
With a g
          global network and p
                             presence

Note: Operations in Rongcheng City, China, and Guadalajara, Mexico are not wholly owned.
Assets from the operation in Kruševac, Serbia should be acquired in early 2012.
7
Deutsche Bank Global Auto Industry y Conference - Brad Hughes, CFO January 10, 2012
A flexible and cost effective manufacturingg network
                                                                                           Cooper Chengshan Tire (CCT),
Findlay,
      y OH ((mfg,
               g R&D, Corp
                         p HQ))                                                            Rongcheng
                                                                                              g     g City,
                                                                                                         y, China ((mfg)
                                                                                                                      g)
Texarkana, AR (mfg)                                                                        Cooper Kunshan Tire (CKT),
Tupelo, MS (mfg)                                                                           Kunshan, China (mfg)
Pearsall, TX (test track)                                                                  Asia Technical Center (ATC) and HQ,
                                                                                           Sh h i China
                                                                                           Shanghai, Chi (R&D)
Occidente, Guadalajara, Mexico (mfg)
                                                                                           Melksham, England (mfg, R&D,
Stow, OH (Mickey Thomson HQ)
                                                                                           European HQ)
Clarksdale, MS (rubber mixing)
                                                                                           Cooper Tire Serbia (mfg)
                                                                                           Kruševac, Serbia*

       p
    Cooper's        g alternatives are used to maximize cost effectiveness using
             sourcing                                                          g high
                                                                                   g
                             quality, near source operations.

Note: Operations in Rongcheng City, China, and Guadalajara, Mexico are not wholly owned.
*Deal for assets should close in early 2012 subject to conditions of offer.
8
A strong, diverse brand portfolio…
                          House Brands

           Private Brand Distributors and National Retailers

9
A historically resilient industry in the U.S.
               Light
                 g vehicle replacement
                             p         tire industryy shipments
                                                         p
Millions 300
of tires
                      Passenger       Light Truck                                In four decades only once has there been a
                                                                                 period of two consecutive years of decline
         250
                                        233                         235    238            238
                               226                    225    228                    230                        230           226
                                               222                                               223                  225
                         217                                                                            218
                208                                                  36     36             34
                                         34                                         34                          29            29
                               34               31    34      34                                  29                   29
         200            31                                                                               28
                 29

         150

         100                            199                         199    202      196   204                  201    196    197
                        186    192             191    191    194                                 194    190
                179

          50

           0
              1997     1998    1999     2000   2001   2002   2003   2004   2005    2006   2007   2008   2009   2010   2011   2012
  Light Truck 29        31      34       34     31     34     34     36     36      34     34     29     28     29     29     29
  Passenger    179      186     192      199    191    191    194    199    202     196    204    194    190    201    196    197

10 2011 and 2012 are based on RMA estimates released December 2, 2011
A Company
          p y that can g
                       grow
 USD Billions                        Total    North America     International
         4.0
         3.5
         3.0
         2.5
         2.0
         1.5
         1.0
         0.5
         0.0
                2004     2005     2006       2007     2008       2009           2010
North America     1.7      1.8      2.0       2.2        2.1        2.0          2.4
International     0.3      0.3      0.7       0.9        1.0        1.0          1.3
Eliminations     (0 1)
                 (0.1)    (0 1)
                          (0.1)    (0 1)
                                   (0.1)     (0 2)
                                             (0.2)      (0 2)
                                                        (0.2)      (0 2)
                                                                   (0.2)        (0 3)
                                                                                (0.3)
Total             2.0      2.0      2.6       2.9        2.9        2.8          3.4
11
Tire shipments can be impacted by economic factors
                                 Percentage change in United States Shipments
                                      Q3 2011 vs Q3 2010            YTD Sept. 2011 vs YTD Sept. 2010
                        Total              RMA                       Total       RMA
                      Industry           Members       Cooper      Industry    Members        Cooper
Passenger               0.2%              -1.9%         -1.0%        -1.2%      -1.1%          -3.1%

Light Truck              0.1%             -3.2%            11.9%    4.7%         4.8%         10.2%

Total Light
        g Vehicle        0.2%             -2.1%            1.1%     -0.5%        -0.4%         -0.9%

Medium Truck             1.9%             -1.7%            52.3%    9.1%         5.1%         58.6%
     Third quarter shipments were strongest in the UHP and light truck product lines
                                                                               lines,
     while broadline and value tires continued to be the most impacted by the economic
     environment.
     November shipments were down .9% for replacement light vehicle for the total
     industry, and down 1.9% year to date.
12 Data Source: RMA and Cooper Tire
Q3 2011
                                                                 Related information including an operating profit walk from the prior year
                                                                 are available at Coopertire.com under Investor Relations

          (millions USD, except EPS)
                                                                                                                    Change from
          Net Sales by Segment                             Q3 2011                       Q3 2010                     Prior Year
          North American Tire                          $           765               $             648                     18.0%
          International Tire                                       422                             325                     29.7%
          Eliminations                                            (133)                            (90)                    47.7%
          Total Company                                $         1,054               $             883                     19.3%

          Operating
            p      g Profit byy Segment
                                  g                                      OP %                           OP %
          North American Tire                          $             17 2.3%         $              55 8.5%         $         (38)
          International Tire                                         30 7.2%                        21 6.3%                    10
          Eliminations                                                0                             (1)                         2
          Corporate                                                  (1)                            (7)                         6
          Total Company                                $             47 4.5%
                                                                         4 5%        $              67 7.6%
                                                                                                        7 6%        $         (20)

          Earnings Per Share (diluted) from
          continuing operations attributable to
          common stockholders                          $           0.27*             $           0.71               $       (0.44)

          Cash and Cash Equivalents                    $             91              $             347              $        (256)

          amounts are unaudited and may not add due to rounding

     *includes 14 cents of additional tax expense because of the timing of credits
     and deductions. These items are expected to be largely offset with the
     anticipated fourth quarter release of the majority of the U.S. valuation
13   allowance.
9 Months Ended September 30, 2011
      (millions USD, except EPS)

                                            9 Months Ended          9 Months Ended
                                             September 30,           September 30,          Change from
      Net Sales by Segment                       2011                    2010                Prior Year
      North American Tire                   $         2,079         $         1,754                18.5%
      International Tire                              1,181                     931                26.9%
      Eliminations                                     (379)                   (244)               55.2%
      Total Company                         $         2,882         $         2,441                18.0%

      Operating Profit by Segment                            OP %                    OP %
      North American Tire                   $            43 2.0%    $            88 5.0%    $       (46)
      International Tire                                 74 6.3%                 64 6.8%             10
      Eliminations                                       (2)                     (2)                 (1)
      Corporate                                         (10)                    (16)                  6
      Total Company                         $           104 3.6%    $           134 5.5%    $       (30)

      Earnings Per Share (diluted) from
      continuing operations available to
      common stockholders                   $          0.71         $          1.21         $      (0.50)

      Cash and Cash Equivalents             $            91         $           347         $      (256)

      amounts are unaudited and may
                                  y not add due to rounding
                                                          g

14
Tires are a complex
                    p product
                         p
                   Input                                                                 % of CoGS
                   Raw Materials                                                              50-55%
                   Labor                                                                      20-30%
                   Other                                                                      15-30%
                       Raw Material Breakdown                                        % of RM
                         Natural Rubber                                              20-25%
                         Synthetic Rubbers                                           25-30%
                         Carbon Black                                                10-15%
                         Reinforcing Fabrics                                         10-15%
                                                                                     10 15%
                         Steel                                                       10-15%
                         Other Raw Materials                                         10-15%

     Note: These costs are historical estimates of typical costs and are based on
     production in what would traditionally be considered a high cost country. Raw
15   material in Q3,2011 was approximately 65% of CoGS for the total Company.
Raw material cost volatility is a challenge
                                              Cooper's Raw Material Index   Q3 2011 = 276
 300

 250

 200

 150

 100

     50

      0

      Q4, 2011 is an estimate based on a sequential decrease of < 5%.
16
A long-term
          g      strategy
                       gy g
                          guides current tactics

                                                                   Focus Areas
                                                 • Profitable sales growth
                                                                    g
                                                    • grow international sales to 50% of sales
                                                    • focus on house and premium products
                                                 • Next level cost competiveness
              • High performing team & culture   • Product availability and supply
                                                 • ERP deployment readiness
                                                 • Brand refresh
More details on Cooper's
                Cooper s Strategic Plan are
available at Coopertire.com
17
Successful new product launches support growth
          Cooper Zeon RS3™ UHP tire and the
        Cooper Discoverer AT3 ™ recognized by a
        prominent consumer testing organization
            as best
               b t available
                       il bl on th
                                the market.
                                       k t
      Media Recognition           Brand Embedment        Exciting Products

      Significant product launches including
18    commercial tires are occurring around the globe.
A solid balance sheet and available liquidity
                                           q     y
             millions USD                               9/30/2011
             Cash & cash equivalents                    $91
             Parent Company Credit Lines            $275 to $375
                                                    $366 tto $466

             Liquidity Items for Consideration
             Capital expenditures between $140 and $160 million in 2011
             Depreciation approximately $130 million in 2011
             Lowest level of cash needed = $75 million
             Additional $231 million of credit available in China

             Long Term Debt                         9/30/2011       12/31/2010   Corporate Debt Ratings:
              Parent Company
              8% unsecured notes due Deceomber 2019 $     174       $     174    Moody's B1, Stable
              7.625% unsecured notes due March 2027       117             117    S&P BB-, Positive
              Capitalized leases and other                 10              11
                                                          301             301

              Subsidiaries                                 56              26
              Total debt                                  357             327
              Less current maturities                      27               6
                                                    $     330       $     321

19
Investment decisions focus on creating shareholder value

         Funding Considerations
          Sustaining basic operations                                 Cash & Cash
          Dividends                                                Equivalents (millions
          Strategic investments                                       USD) at 12/31
          Profitable growth                                          2005         $280
          C t reductions
          Cost   d ti                                                2006         $222
          Additional pension funding                                 2007         $508
          Optimize WACC, long-term capital structure,                2008         $248
          and credit rating                                          2009         $427
          Opportunistic capital structure changes                    2010         $413
          Other shareholder-friendly actions

      Analysis includes a review of returns and the anticipated future business environment.
                       Priorities can change based on those expectations.

       Cash at September 30, 2011, was $91 million.
20
                                                                                               20
Preparing 421  Tariff
        p g for a changing Impact
                      g g industryy
     • Additional Tire Labeling tariff of 30% on Chinese tires will reduce
                                                                                    421 Tariff
        to 25%
       Cooper           in Sep,
                  supports              2011it and 0% at Sep.
                               to the extent                               2012.
                                                                  Additional tariff of 30% on Chinese tires
       will enhance consumers
                         consumers'                               reduced
                                                                    d d tto 25% in    i September
                                                                                        S t b 2011 andd will    ill
        Companies
     • understanding              have
                            of tires  in a increased imports      be 0% infrom
                                                                            Septembercountries
                                                                                          2012.
       reasonable
        other than    manner.    China.                           Companies have increased imports from
                                                                  countries other than China.
       Regulations are still being                                Cooper
                                                                      p is well-positioned
                                                                                    p          to deal with either
       refined,
          fi
     • Cooper
        C     d   i
                  implementation
                      l         t ti    b
                                        begins
                                            i
                         iis wellll positioned  i
                                                in
                                              iti     d to
                                                         t d deall with  ith either
                                                                  scenario  (tariff   ith scenario
                                                                                    continuing or expiring). i
       2012 in Europe.                                                  Enhanced competiveness at U.S.
        (tariff     continuing
       Cooper continues to be engaged
                                            or    expiring).            plants
                                                                        Supply from Mexico
       and   will use   our          g
                             strengths
          – Enhanced competiveness at U.S.to                      U SFlexibility
                                                                           plants    at Cooper Kunshan Tire (can
       benefit as the regulations are                                   sell into China starting in 2012)
       finalized.
          – Supply from Mexico
          – Flexibility atRolling        Cooper      Kunshan
                                              Resistance           Tire
                                                         and Fuel Efficiency
                                 Cooper launched a "green tire" the GFE, in 2009.
                                 Investments in related technology will continue.
                                 Future products will include this technology to
                                 drive value for the consumer
                                                     consumer.

21
                                                                                                                      21
Other Items
     Cooper expects to release the majority of the valuation allowance on U.S. taxes in Q4
     2011. (At September 30, 2011, the valuation allowance was $171 million)
     Products
     P  d t liability
              li bilit charges
                        h       ffor th
                                     the ffullll year off 2011 should
                                                                h ld ffollow
                                                                          ll th
                                                                             the ttrendd off expense
     consistent with recent trends after adjusting for the Toe case and for higher legal fees, as
     we do not expect any insurance recoveries for fees going forward. For more information
     on Products Liability please refer to our 10-K 10 K and other filings.
                                                                     filings
     Pension costs are similar in 2011 to 2010. Funding levels similar to 2010 at $40 million.
     Effective tax rates for the full year 2011 were projected as of the Q3 2011 earnings
     release to be in the 20% to 30% range for 2011.

22
                                                                                                       22
Q
     Questions?
          i ?

23
                  23
Risks
     It is possible that actual results may differ materially from those projections or expectations due to a variety of factors, including but not limited to:
     •      changes in economic and business conditions in the world;
     •      the failure to achieve expected sales levels;
     •      the impact of labor problems, including a work stoppage at the Company or at one or more of its large customers or suppliers;
     •      volatility in raw material and energy prices, including those of rubber, steel, petroleum based products and natural gas and the unavailability of such raw
            materials or energy sources;
     •      consolidation among the Company's competitors or customers;
     •      technology advancements;
     •      the failure of the Company’s suppliers to timely deliver products in accordance with contract specifications;
     •      changes in interest or foreign exchange rates;
     •      changes in the Company’s customer relationships, including loss of particular business for competitive or other reasons;
     •      the impact of reductions in the insurance program covering the principal risks to the Company, and other unanticipated events and conditions;
     •      the inability to obtain and maintain price increases to offset higher production or material costs;
     •      increased competitive activity including actions by larger competitors or lower-cost producers;
     •      the inability to recover the costs to develop and test new products or processes;
     •      the risks associated with doingg business outside of the United States;;
     •      changes in pension expense and/or funding resulting from investment performance of the Company’s pension plan assets and changes in discount rate,
            salary increase rate, and expected return on plan assets assumptions, or changes to related accounting regulations;
     •      government regulatory initiatives;
     •      litigation brought against the Company including products liability;
     •      an adverse change  g in the Company’s
                                              p y credit ratings,g , which could increase its borrowingg costs and/or hamper
                                                                                                                         p its access to the credit markets;;
     •      changes to the credit markets and/or access to those markets;
     •      inaccurate assumptions used in developing the Company’s strategic plan or operating plans or the inability or failure to successfully implement such
            plans;
     •      inability to adequately protect the Company’s intellectual property rights;
     •      failure to successfullyy integrate
                                         g     acquisitions
                                                 q          into operations
                                                                  p         or their related financings
                                                                                                     g mayy impact
                                                                                                              p liquidity
                                                                                                                    q y and capital
                                                                                                                                p resources;;
     •      inability to use deferred tax assets;
     •      changes to tariffs on certain tires imported into the United States from the People's Republic of China or the imposition of new tariffs or trade restrictions;
     •      and changes in the Company’s relationship with joint-venture partners.
24
                                                                                                                                                                              24
You can also read