2017 CANADA REPORT - Canadian Interagency Forest Fire ...
←
→
Page content transcription
If your browser does not render page correctly, please read the page content below
CANADA REPORT
    2017

                -
C              R
                                                            2017
Preamble

The 2017 Fire Season was extremely challenging for the CIFFC organization with a particular focus on supporting British Colum-
bia.

From early July through Mid September resources from across Canada and Internationally were mobilized to assist firefighting
efforts in British Columbia. When the ash finally settled British Columbia reported 1338 fires for a record high area burned of
1,215,532 hectares.

The 2017 fire season confirmed that the Canadian wildland fire “family“ has expanded globally as unprecedented international
support was received from Australia, New Zealand and Mexico. In excess of 600 firefighters and overhead staff from these inter-
national partners were mobilized to the fire lines in BC. CIFFC will continue working to identify new potential partners in order to
provide options to our members when domestic supplies of resources are depleted.

Fire Season

The first weekly CIFFC Situation Reports were issued on April 19 and 26 respectively and noted very light fire loads nationally,
with normal spring conditions.

Early May saw a moderate hazard building in Northern Alberta (AB) with Parks Canada (PC) busy planning and implementing
prescribed burns across several western and central national parks. Meanwhile ,Ontario and British Columbia were supporting
flooding operations within their respective jurisdictions.

CIFFC continued to monitor the fire situation through the month of May as wildland fire management agencies across the country
were busy with annual fire season preparedness and seasonal staff training By the end of May the fire hazard in Northern AB had
again increased with a number of new fires occurring in Alberta and Wood Buffalo National Park. British Columbia Fire Manage-
ment Staff remained engaged with Emergency Management British Columbia assisting with flood mitigation efforts.

By mid June, BC’s commitment to flood support was finally reduced. As June wore on the national fire situation remained relative-
ly benign for new starts although BC did report that all southern fire centres were experiencing building indices through the latter
half of June. This carried on through the Canada Day long weekend and into the first week of July as the province experienced
record breaking high temperatures. Through the first few days of July new fires in BC began drawing steadily on provincial re-
sources.

Over the July 6-10 period BC received over 200 new starts demonstrating aggressive fire behaviour. Due to heavy smoke, detec-
tion of new starts was also identified as a challenge with some new fires found at 500 ha. From July 6 through the 10th BC in-
creased from an Agency Preparedness Level (APL) 2 to APL 4. Consequently, CIFFC went to National Planning Level (NPL 3) on
July 9 as a result of significant resource orders received from BC.

By July 11 BC was in a provincial state of emergency with several wildfires burning out of control. Temperatures remained high
with no precipitation forecasted. Resources from AB,SK,QC,NB,NT and ON had already been mobilized and were being deployed
to priority targets.

CIFFC’s NPL increased to 4 on July 12 and then to Level 5 on July 18 as the hot dry weather in BC persisted and extreme fire
behaviour necessitated a supply of additional resources. The CIFFC NPL would stay at 5 until September 11, a record 55 con-
secutive days. BC’s APL increased to 5 on July 17, and would stay at that level until September 11 as well.

Consideration of international resources was triggered early on and by mid July International Interagency Resource representa-
tives were set up at the CIFFC Fire Centre in preparation for additional resource orders from BC. The first international resources
arrived on July 19, (overhead from Australia). Crews from Mexico, crews and overhead from Australia and crews and overhead
from New Zealand were mobilized to BC starting in early August.

By late July Ontario’s (ON) APL had risen to a 3 and then 4 by mid August. Although the resulting draw on national resources
was minimal (one Tanker group) the e was an impact on resource availability (reduction) during this period. The latter part of Au-
gust also saw increasing indices in both Manitoba (MB) and Saskatchewan (SK) with their respective APLs’ rising to 4 with signifi-
cant associated fire activity.

                                                                                                                                  2    -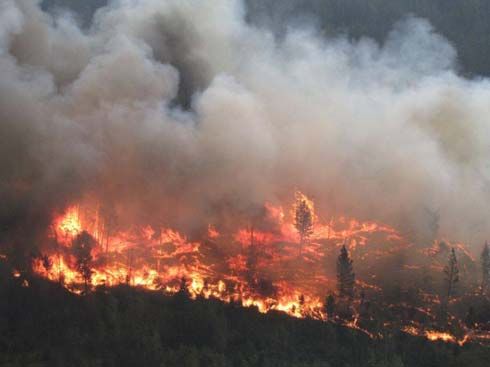
By the third week of July PC’s APL had risen to a 4 with challenging large
fires reported in a few western National Parks. Resources were mobilized
to assist PC as well as continuing to supply BC with replacement staff on a
rotational basis after each tour of duty through the latter parts of July,
August and into September.
PC continued to have a difficult extended fire season with the Kenow fire in
Waterton Lakes National Park taking a significant run during the second
week of September.
By September 11 , BC began to see a downtrend in resource requirements
followed by PC a few days later as the unseasonably warm and dry weather
finally gave way to a more fall-like pattern.
Most out-of-province personnel were released from BC by September 21.
Equipment was returned to lending agencies over the ensuing months and
the long process of equipment refurbishment would take well into until the
new year.
By early September the need for airtanker resources in Canada was reduced allowing CIFFC once again to exercise the Canada US
Reciprocal Firefighting Arrangement with 2 Tanker groups from ON mobilized to Montana for a short deployment.
Summary
2017 saw about 13% fewer fires nationally than the 10 yr average, but total area burned was up almost 30% over the 10yr average.
During the course of the fire season CIFFC responded to almost 300 Resource Orders (a new record) ultimately mobilizing 581 Initial
Attack and 1949 Sustained Action firefighters, along with 729 overhead personnel. In addition 26,000 lengths of hose, 960 medium
pumps and 27 airtankers were deployed throughout the fire season. Although the primary target for most of those resources was British
Columbia, Parks Canada, Yukon, Northwest Territories, Saskatchewan, Manitoba, Ontario, and Quebec all received assistance from
their CIFFC partners at one time or another during 2017.
Once again CIFFC member agencies were able to take advantage of a contract jet aircraft to facilitate the mobilization and
demobilization of personnel across Canada and to and from Mexico. The CIFFC Coordination Centre took over the contract and
management of the aircraft on behalf of the member agencies in 2017, which had been managed by the province of Ontario in the
previous 2 seasons. The contract aircraft flew 42 missions transporting a total of 3154 personnel over the course of the 2017 fire
season.
Agency Seasonal Summaries
British Columbia
In stark contrast to the summer that was to come, B.C. observed an unusually
quiet spring wildfire season. Between April and the end of June, 255 wildfires
had burned 1,625 hectares of land. In an average fire season, there would
have been about 420 fires and 26,800 hectares burned in this same time span.
Although wildfire activity was low during this time, the province was
experiencing notably severe flooding during the spring season. Hundreds of
firefighters and other personnel from the BC Wildfire Service were brought in to
assist with flood response efforts.
The fire danger for many regions of B.C. began to climb significantly
throughout June, although crews were still observing relatively few fire starts.
The Cariboo region in particular saw unseasonably hot and dry conditions, as
well as record-high Build Up Index (BUI) ratings in several areas. (The BUI is a
numeric rating of the total amount of fuel available for combustion, in the event
a wildfire does occur.) These developing conditions set the stage for what was to become one of the worst fire seasons on record.
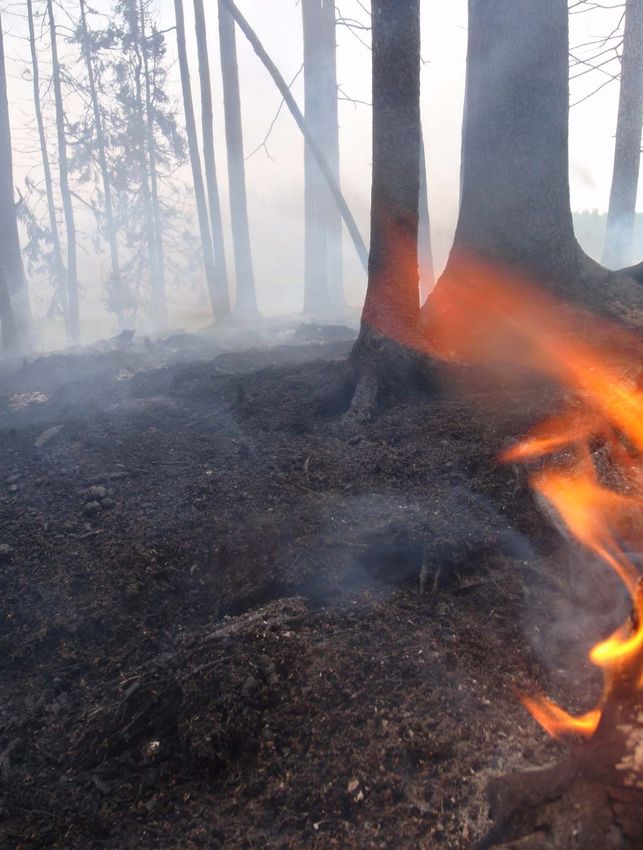
A series of events that took place between July 6 and July 8 dramatically escalated the fire season, and it quickly became clear that
firefighters and personnel were coming face-to-face with one of the most challenging summers of their careers. A series of widespread
thunderstorms between July 6 and July 8 contributed to over 190 new wildfire starts - the majority of which occurred in the Cariboo.
Many of these wildfires grew rapidly and displayed aggressive, dangerous fire behaviour. A number of these fires started in areas close
to communities, such as (but not limited to) Williams Lake, 100 Mile House, Princeton, Cache Creek / Ashcroft, Clearwater, Quesnel,
and many others.
The majority of "Wildfires of Note" from the 2017 season started during this early-July period. The amount of new fire starts declined
and stabilized after this early-July spike, but generally hot and dry conditions prevailed for much of the summer, giving little reprieve in
the fight against the existing fires throughout the Cariboo and Southern Interior. In August, a second wave of heightened fire activity was
experienced, with several major fires cropping up throughout southeastern B.C. and the Southern Interior. The wildfire season remained
active until near the start of fall, when cooler, wetter conditions finally gave crews the upper hand on the fire situation.
3 -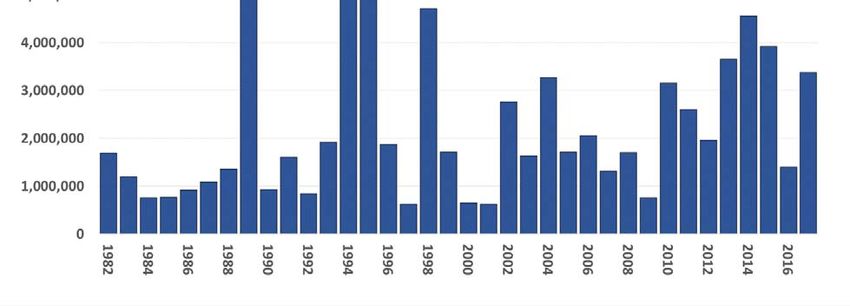
Alberta
The 2017 fire year in Alberta yielded below average fire arrivals with 47,000 hectares burnt which was 15 percent of the fire year
average. The fire season started slowly with snow persisting in many areas through April. The boreal forest in general, and the
northern east slope areas of the province experienced frequent rains during the summer suppressing fire danger conditions. However,
the southern east slopes area experienced by a different synoptic weather pattern. Little precipitation during the summer months
elevated fire danger conditions to extreme levels in August and September. A forest closure and numerous fire bans were established
in many areas of southern Alberta during this time. The Kenow wildfire was the only wildfire of note in the province in 2017 that
significantly impacted Waterton Lakes National Park and a number of neighbouring municipalities.
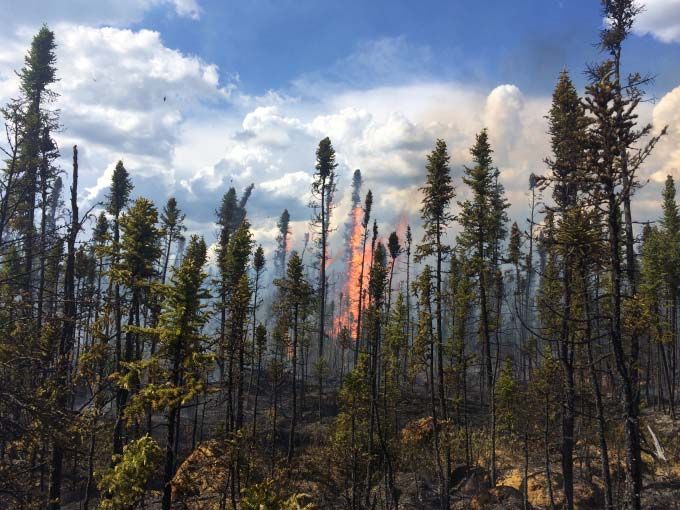
Northwest Territories
The NWT experienced an above average number of fires and area burned in 2017 with a season that began relatively normal. Fire
conditions in July ameliorated slightly but rebounded into August causing an extended season into early September. The NWT
experienced three fires of concern directly affecting communities and one large landscape fire that required value protection to 35
different sites. Overall conditions were manageable and allowed for support from the NWT to be extended to southern provinces.
Saskatchewan
In Saskatchewan the 2017 fire season had a slow start with the majority of the fires starting after July 1st 2017. This gave us the
opportunity to export staff to assist other jurisdictions with wildfires, exports were mainly to BC.
Lightning storms began to cross the province the last few days of July igniting significant fires across the north and northeast of the
Province.
Of the total 353 wildfires for the year 183 started After July 31st, 2017. The Northeast side of the province had some significant fires
from these starts.
The conditions were fairly dry and there was significant wind events that were contributing factors to the size and complexity of some of
the larger fires on the landscape.
With the dryer fall some of the major fires wet well towards the end of September.
The southern part of the province had a long open fall and as a result there were many late fires, mostly human caused, well into
November.
Quebec
The 2017 forest-fire protection season ended with a total count of 290 fires that affected 6,630 hectares of forest in the intensive
protection zone (IPZ). It was characterized by a rainy spring which helped to limit significantly fires caused by human activity. The fall
was warmer and drier than usual. SOPFEU responded to a fire spreading over 23 hectares in October.
The number of fires caused by human activity, as well as the number of fires caused by lightning, were below the seasonal average of
the last ten years. In fact, 2017 rates third among seasons with the lowest number of fires since 1984. Each year in Quebec, an
average of 486 fires affect 61,240 hectares of forest in the intensive protection zone.
The season was particularly marked by the importance of the resources loaned by Quebec. Most loans were provided to British
Columbia which was struggling in the context of a historic season.
New Brunswick
The season started off relatively slow with a rainy May which saw staff busy supporting various flood responses. During the month of
June we experienced an increase in sunshine but intermittent rain events kept indices in check. The middle of July saw a shift to hotter
dryer weather patterns which contributed to an increase in Indices however fire starts were relatively low and fire behavior observed
was slow to moderate which resulted in successful Initial attack . One Incident of note During late July was the Miscou fire which was
the result of a structure fire that escaped into the forest and due to the proximity to the coast and local wind affects grew quickly to
approx. 40ha. and saw the evacuation of local residents however this evacuation lasted only a few days.
We experienced a hotter drier Fall than usual this weather pattern of warm dry air saw indices increase right though till mid-October ,
and while we were responding to fires into October the majority were under control within the first operational period however there
were challenges of managing resources due to typical seasonal workloads. Overall we saw a season with hotter and drier
temperatures but not a drastic increase in occurrences and believe this to be due to the lack of lightning events as well as staff’s quick
response.
4 -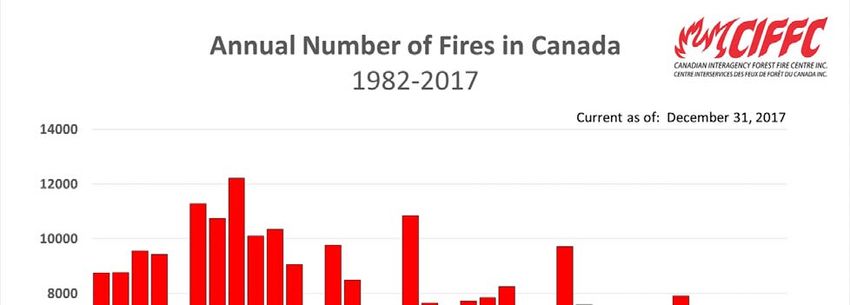
Nova Scotia

The winter of 2017 was fairly normal for Nova Scotia with regards to snowfalls and temperatures. We had the majority of our fires in
April and May before green up. The rest of the season was fairly quiet for us. This fire season we had 175 fires which burnt 728.5
hectares. This is well below our 20 year average in Nova Scotia which is 291 fires that burn 775 hectares. We maintained our normal
preparedness right up until the end of the season on October 15th.

We were pleased to be able to assist BC this year with staff and equipment when they needed help. We are not a large agency but we
sent what we could when asked.

Prince Edward Island

Although PEI experienced a long, cool spring, the season also featured a hot, dry summer as well as fall months with Drought Codes
above 400 on many occasions. With fires out of control in Western Canada, Islanders were made more aware of the potential of such a
threat locally. The Province of PEI responded to four fires which totaled a burn area of 7.12 ha.
In 2017, PEI exported 11 crew members and one agency representative, who teamed with six fire fighters from Newfoundland to fight
the BC fires as a sustained action crew. In addition, our province exported a four person initial attack crew, one division supervisor, one
safety officer trainee, and 1 technical specialist to BC fires. Experience gained was invaluable as PEI has little opportunity to participate
in fires and organizations of this magnitude.
This past season was, also, a busy one for training as there were 14 crew members certified to Type 1 level - the most ever for the
Island. As well, staff members attended training courses on a number of Command and General Staff positions.

                                                                                                                                        5   -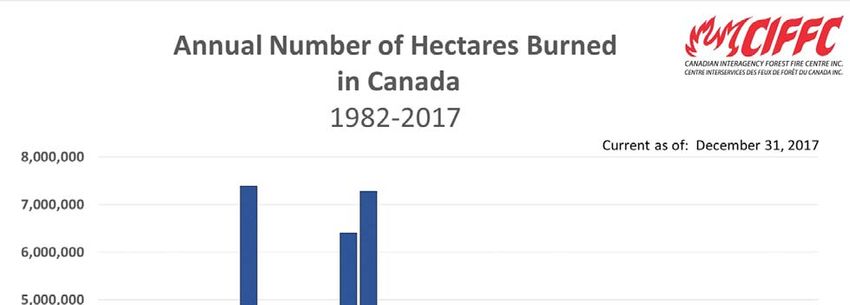
May   June   July   August
Fires by Month
                 695   611    1276   1713

                                              6   -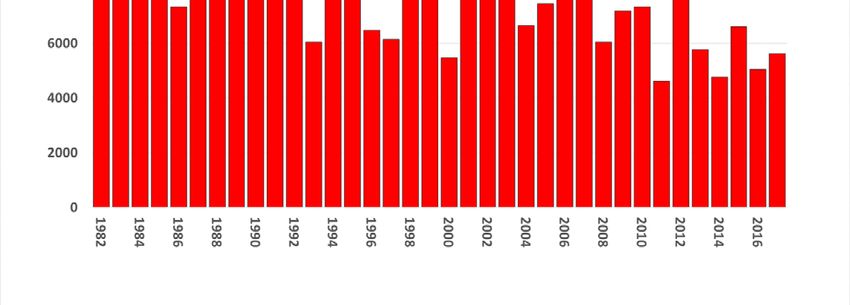
Statistics
As of December 31, 2017 Canadian Fire Management Agencies recorded 5597 fires with an area
consumed of 3,371,509 hectares.

                  N             P            L        M    1– S    27
                  Levels            1    2        3       4       5
                  No. of days       69   8        8       10      55

                                                                                       7   -
8 -
W           R           F
Year 86 87 88 89 90 91 92 93 94 95 96 97 98 99 00 01 02 03 04 05 06 07 08 09 10 11 12 13 14 15 16 17

Fatali-
 ties
        6   3   3   0   3   4   2   0   2   4   0       0   0   0   0   2   0   3   2   0   3   3   2   1   5   4   0   1   0   2   1   0

                                                                                                                                        9   -
W F S
T N F (L H C )
2007 2008 2009 2010 2011 2012 2013 2014 2015 2016 Avg. 2017
BC 1,437 1,817 3,084 1,678 646 1,642 1,854 1,455 1,836 1,049 1,650 1,352
YT 110 67 118 88 56 126 177 34 184 53 101 115
AB 1,164 1,695 1,655 1,837 1,097 1,555 1,214 1,451 1,850 1,366 1,488 1,217
NT 1,353 241 42 224 207 279 248 385 245 189 341 262
SK 370 599 511 571 303 409 429 403 723 364 468 353
MB 364 397 184 583 315 497 494 245 454 202 374 545
ON 1,015 338 385 931 1,334 1,615 582 303 668 648 782 776
QC 935 222 483 737 329 795 515 292 384 602 529 319
NL 87 139 176 61 53 198 101 124 128 91 116 80
NB 282 168 192 179 81 344 356 178 222 285 228 245
NS 392 247 193 313 116 352 171 171 247 274 248 175
PE 8 3 8 4 4 8 9 4 5 7 6 4
PC 64 103 136 113 67 87 96 81 122 43 91 168
T 7,581 6,036 7,167 7,319 4,608 7,907 6,246 5,126 7,068 5,173 6,423 5,611
10 -W F H
T A C (H )
2007 2008 2009 2010 2011 2012 2013 2014 2015 2016 Avg. 2017
BC 28,704 11,939 229,566 331,508 12,357 102,042 17,990 368,785 280,445 100,366 148,370 1215851.68
YT 41,288 18,845 227,057 146,957 39,091 58,280 179,510 3,160 169,841 21,543 90,557 399280.15
AB 105,321 20,644 66,826 83,643 940,596 337,000 21,890 23,120 492,536 741,550.10 283,313 49118.88
NT 439,886 353,852 2,057 333,435 406,693 297,618 537,912 3,416,291 646,955 254,980.90 668,968 861030.58
SK 212,907 1,130,179 37,559 1,734,799 343,720 227,512 312,194 343,430 1,758,376 241,607.80 634,228 399,562.60
MB 206,924 150,673 2,872 187,494 126,844 216,888 1,115,412 40,333 47,358 38,408 213,321 176,677
ON 40,591 1,314 20,656 14,824 635,373 151,564 43,422 5,386 39,311 83,113.20 103,555 112337.2
QC 342,682 1,481 93,972 314,884 12,726 70,086 1,872,842 63,721 5,380 33,371 281,115 38392.3
NL 10,892 5,140 35,267 1,020 594 225,524 43,076 16,816 3,958 10,953.50 35,324 699.8
NB 446 143 249 156 45 362 886 112 262 264.8 293 567.9
NS 692 2,719 892 463 136 817 301 564 517 754.9 786 728.5
PE 20 8 3.09 5 6 12 55 4 2 19.7 13 7.12
PC 222,134 4,439 38,429 5,912 85,653 273,037 58,377 282,125 458,336 5,539.40 143 3371829.11
T 1,652,387 1,701,376 755,405 3,155,100 2,603,833 1,960,742 4,203,867 4,563,847 3,903,277 1,499,883 2,603,241 3,371,509.43
11 -You can also read