Considerations for the 2021 duck season - Current as at 15 December 2020 - Game ...
←
→
Page content transcription
If your browser does not render page correctly, please read the page content below
Considerations for the 2021 duck season
Current as at 15 December 2020
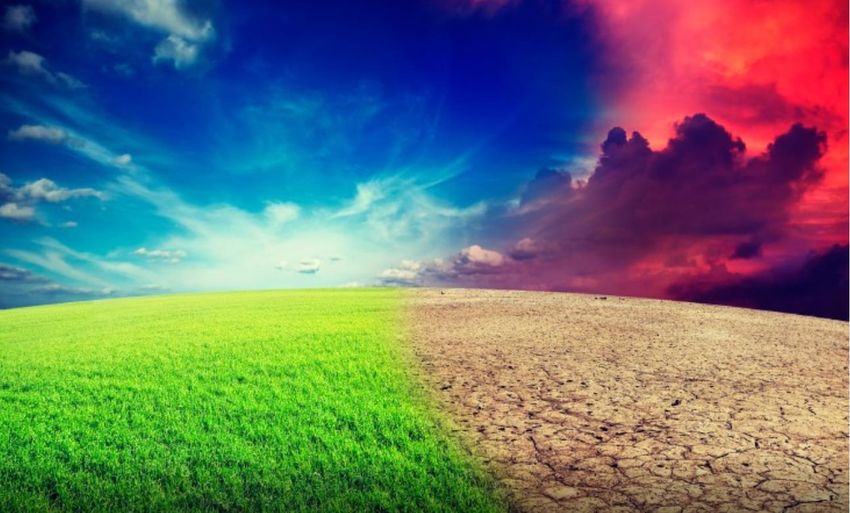
Climate

Past and present climatic conditions dictate
present environmental conditions

Climatic predictions can be used to consider
whether environmental conditions will change
into the future

                                               3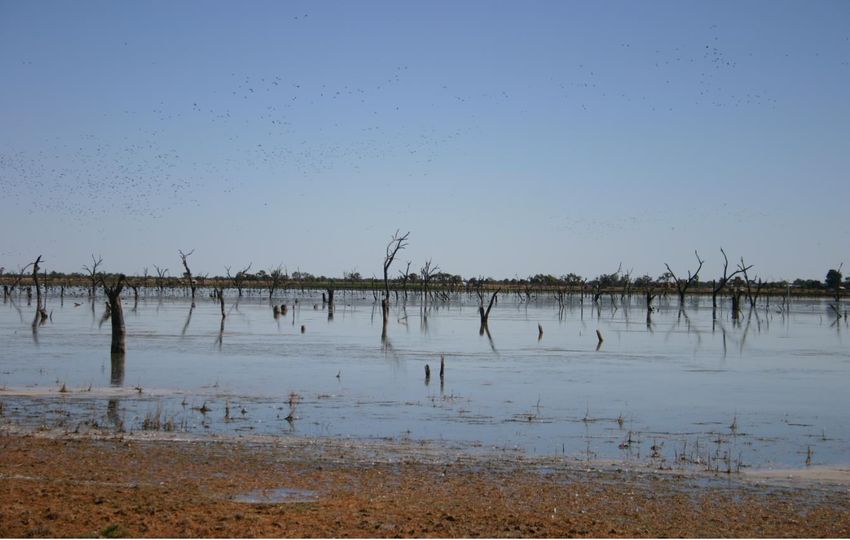
Climatic conditions and waterfowl
• Climatic conditions, such as large scale
  oscillations (e.g. Southern Oscillation Index)
  and local weather (e.g. rainfall and
  temperature), can effect the distribution,
  productivity and size of waterfowl populations.

• In Australia, waterbird abundance is strongly
  related to river flows and rainfall (Kingsford et
  al. 2017).

• Large and extensive rainfall events can
  contribute to population increase as the
  conditions are enhanced to support breeding
  and recruitment. Conversely, during dry
  periods, breeding may be modified or greatly
  reduced (see Kingsford and Norman 2002).

• Hunting during periods when there is little         Climate effect on waterbird populations. Source: Jenouvrier 2013
  recruitment (e.g. dry periods) removes
  breeding adults which can negatively affect
  subsequent recruitment and further drive
  declines in hunted species (Kingsford et al.
  2017).
                                                                                                                   3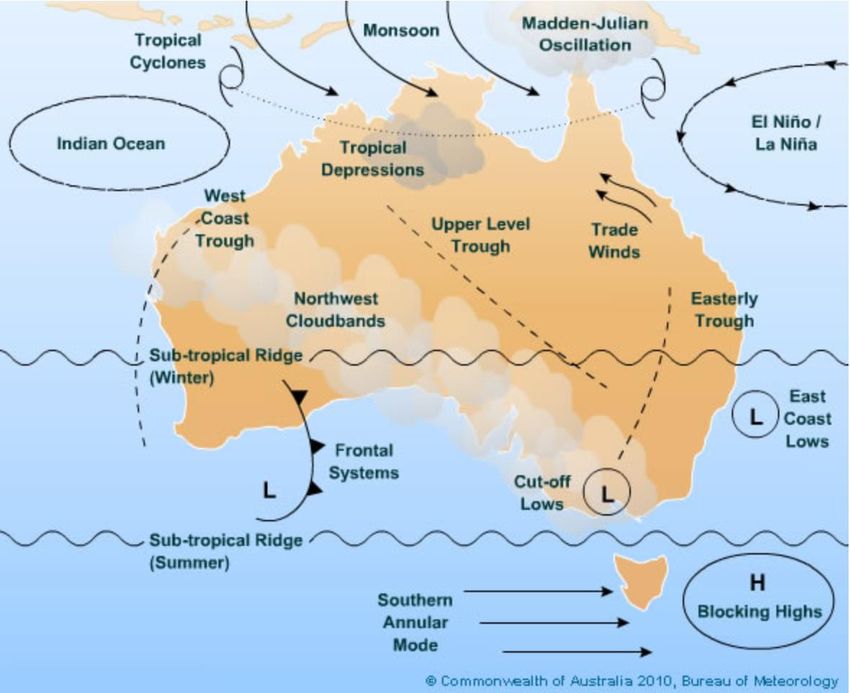
2014

                                Annual rainfall deciles
                                2014 to 2020      (Deciles = rainfall received compared to historical
                                                  averages)

                         2015              2016                                                   2017

                         2018              2019                                                   2020

Source: www.bom.gov.au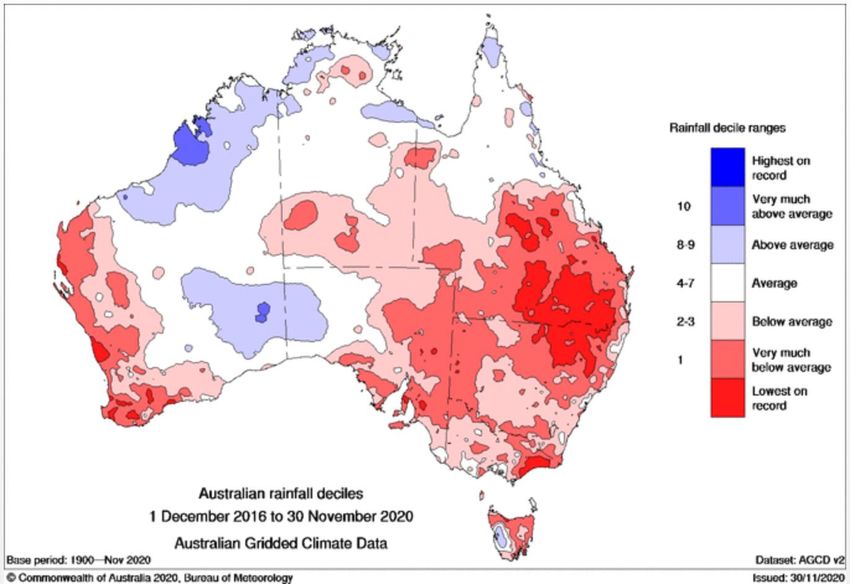
Rainfall through the seasons 2020
           Summer               Autumn                     Winter                     Spring

  • Despite reaching La Nina thresholds in October, widespread above average rainfall has
    not eventuated to date in 2020.

  • Eastern Australian received mostly average to below average rainfall during summer,
    with parts of coastal Victoria, NSW and Queensland receiving areas of above average
    falls.

  • Most of NSW, Victoria and south-western Queensland and far north-eastern South
    Australia received above to very much above average rainfall in autumn.

  • Most of eastern Australia received average to below average rainfall in winter.

  • Most of eastern Australia received average rainfall in spring,
    however, most of SA received above-average rainfall and
    south-eastern and costal Queensland received below average rainfall.                       5
Source: www.bom.gov.au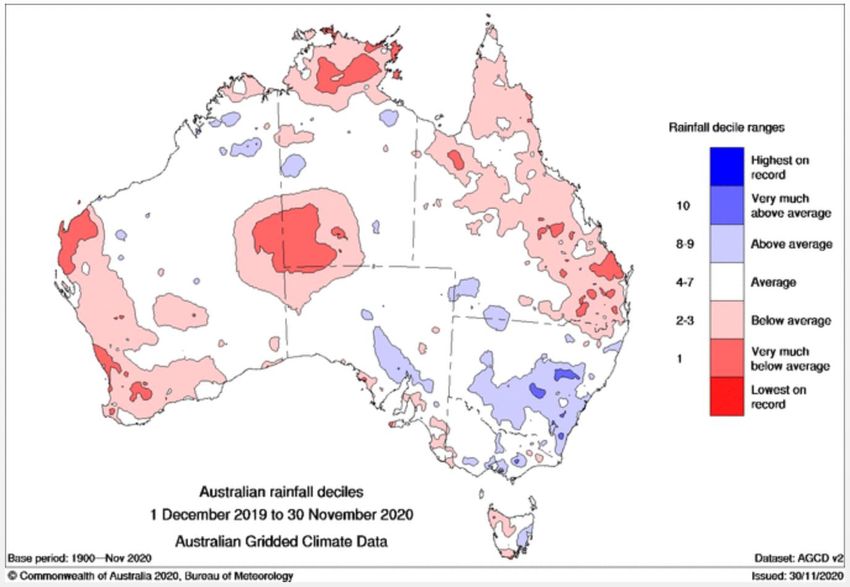
Year-to-date rainfall 2020
• Since December 2019, most of
  Australia has experienced average to
  below average rainfall. About half of
  NSW has experienced above average
  rainfall.

• This follows, the second driest January
  - November period on record in 2019
  and amongst the three driest for NSW,
  SA, WA and the NT.

• At December 2020, about 67% of
  Queensland was in drought or drought
  affected (Qld DAF 2020).

• About 70% of South Australia is drought
  affected (SA PIR 2020).

• 10% of NSW is in drought or drought
  affected (NSW DPI 2020).

• Most of Victoria has received average
  rainfall in 2020.
Source: www.bom.vic.gov.au                  6
Four-year rainfall
• Rainfall deficiencies have affected much
  of Australia since early-2017.

• The size of the rainfall deficit
  accumulated over annual and longer
  timescales remains very large over
  much of Australia.

• Despite above average rainfall for much
  of south-eastern Australia and parts of
  the inland northwest and Northern
  Territory during one or more months this
  year, serious or severe longer-term
  rainfall deficiencies persist over very
  large areas.

• Persistent, widespread, above average rainfall is needed to lift
  areas out of deficiency at annual and longer timescales and
  provide relief from the impacts of this long period of low rainfall
  (such as renewing water storages). The impact of the longer dry
  on water resources is still evident, especially in northern parts of
  the Murray–Darling Basin where total storages are still low.

Source: www.bom.vic.gov.au                                               7
Soil moisture – December 2020

                         2019                                            2020

  • Root zone (0-100cm) soil moisture at December improved from 2019 to 2020.

  • However, at 14 December 2020, approximately half of eastern Australia recorded
    below average to very much below average root zone soil moisture levels, reflecting
    low rainfall totals across Australia since autumn and the cumulative affects of four
    years of dry conditions.

                                                                                           8
Source: www.bom.gov.au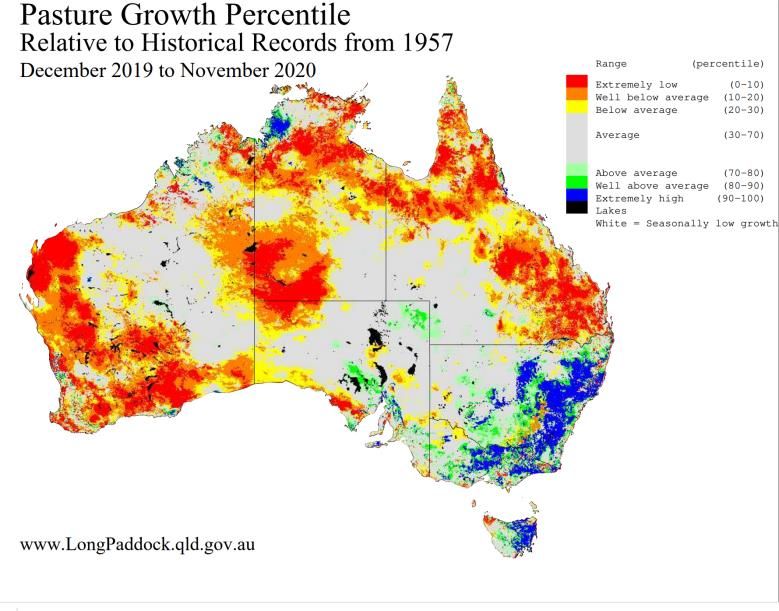
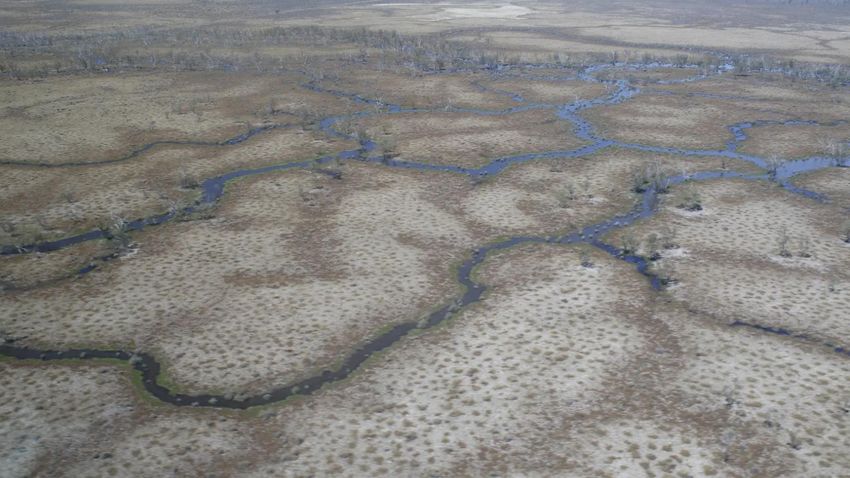
Runoff
Runoff impacts the availability of
water in he wetlands and the health
of riverine systems. It has a direct
influence in the creation and
maintenance of waterbird habitat.
•   Year-to-date runoff for eastern
    Australia has been variable.
    Large parts of Victoria, eastern
    Queensland and western
    Western Australia have
    recorded below average runoff.
•   Western Queensland and most
    of NSW has recorded above
    average runoff.
•   Eastern South Australia has
    experienced a mix of above and
    below average runoff for 2020.

Source: www.bom.gov.au                 9
Australian water storage levels

• Water storage levels provide
  an indicator of the availability
  of waterbird habitat and
  waterflows through feeder
  systems. However, often
  impoundments and storages
  can trap water and prevent it
  from entering creeks, streams
  and wetlands, thereby reducing
  available habitat. Therefore,
  this information must be
  considered in context,
  particularly during dry periods.
• In 2020, Australia’s water
  storages increased marginally
  by 3.6% from the same time
  last year, from 48.7% to 52.3%.

                                     10
Source: www.bom.gov.au
Victorian water storage levels
• The total (Melbourne and
Regional) Victorian water storage
levels are currently at 65.7%
compared to 49.0% last year.
• Storage levels have increased by
16.7% from this time last year.
11
Source: www.bom.gov.auMurray-Darling Basin water storage levels The Murray–Darling Basin is a critical area for waterfowl production and Australia’s most developed river basin (240 dams storing 29,893 GL). • Storage systems in the MDB are at 59.2% of capacity, which is 22.4% higher than at the same time last year (36.8%). • Storage volumes in the northern MDB have increased to 25% from 6.7% in mid-November last year. • Storage volumes in the southern MDB are at 66% up from 46.7% in November 2019. Source: www.bom.gov.au 12
Eyre Basin
             •   Rainfall was average across 44 per cent
                 of the Basin and lower than average
                 across 54 per cent of the area in
                 November.
             •   Total rainfall was 6 mm, 68 per cent lower
                 than the long-term mean of 19 mm for
                 November.
             •   Lake Eyre is currently dry.

             •    Streamflows in November were average
                  for 43 per cent of the sites and higher
                  than average for 43 per cent of the sites,
                  predominantly in the east.

                 Source: www.bom.gov.au                        13
Pasture conditions
Pasture conditions are a coarse indicator of potential
feeding habitat for grazing species, such as Wood
Duck and Mountain Duck, and nesting habitat for
ground-nesting game ducks.
Current conditions
• The last 12 months of pasture growth across
NSW, Victoria and South Australia has shown
considerable improvement from 2019, with
average to extremely high growth.
• However, there has been little overall
improvement in Queensland from the previous
year, with approximately half the state showing
average growth and the other half showing well
below average to extremely low growth.
14Habitat availability
Eastern Australian Waterbird
  Survey (EAWS)
The EAWS monitors changes in the abundance and
distribution indices of 50 waterbird species in eastern
Australia.
The EAWS was designed by Graeme Caughley and has
been conducted annually in October since 1983. Waterbirds
are counted from the air across ten aerial survey bands
(each 30 km in width), every two degrees of latitude,
crossing eastern Australia to monitor all wetlands over 1ha in
size.

The EAWS provides:
    ▪ an index (not total count) of abundance of
      waterbirds, including game ducks
    ▪ information on the distribution of waterbird and game
      duck populations along survey bands
    ▪ the extent and distribution of habitat along survey
      bands, and
    ▪ limited information on waterbird breeding.

The information is valuable for examining waterbird trends
on over one-third of continental Australia and over a long
period.
Wetland area index
The wetland area index is a measure of wetland availability across all 10 EAWS transects
(bands). This gives an indication of the extent of habitat available for waterbirds.
• The 2020 wetland area index was the 5th lowest recorded since surveys began 38 years
ago and reflects the continued dry conditions across eastern Australia over the last 4 years.
• There was a slight increase in the index from last year, but it still sits at 42% of the long-
term average. The majority of the available habitat occurs from northern Victoria to
northern NSW (bands 2 – 5). Band 10 also recorded greater habitat than the remaining
bands.
Long-term wetland area index
Distribution of wetland area across the
survey bands
Distribution of wetland area index in 10 survey bands of the Eastern
Changes over time in wetland area in the Eastern Australian Australian Waterbird Survey in 2020. Horizontal line shows long-term
Waterbird Survey (1983 - 2020); horizontal line shows long- average.
term average.
17Wetland distribution
2019 2020
All surveyed wetlands with surface
water present are plotted; dry
wetlands not plotted
• Despite a wet autumn, most of eastern Australia has experienced average to below
average rainfall in 2020. This follows three years of extreme drought.
• The majority of the habitat surveyed occurred in bands 2 to 5. This is reflected in the
increased wetland area in the Murray-Darling Basin but was offset by the decrease in the
Lake Eyre Basin. Band 10 also recorded a greater amount of habitat compared with
remaining bands. 48% of surveyed wetlands (including dry wetlands) held no waterbirds.
18Population indices of abundance, distribution and breeding
Index of waterbird abundance
   (all waterbirds)
     Up to fifty waterbirds species are surveyed in October each year and includes all Victorian
     game duck species and non-game species such as swans, Freckled Duck, ibis, coots etc.
     •   The total index of waterbird abundance (n=162,824) decreased by 22% from 2019
         (208,364). The total waterbird abundance index is the 6th lowest in 38 years.

                                                      Waterbirds were most
                                                      abundant in Bands 5
                                                      and 10.

                                                                                                    Dry wetlands and wetlands with
                                                                                                    zero waterbirds not plotted

The abundance index is not a total count. It provides information on the trends in waterbird abundance along the survey band s.      20
EAWS waterbird abundance index
bands 1 & 2
• Bands 1 and 2 cover parts of Victoria. Band 1 surveys areas of southern coastal
Victoria and band 2 surveys northern Victoria.
• Waterbird abundance (all species) in bands 1 and 2 has declined from 2019.
• Note the difference in scales between the graphs.
2019 2020
21EAWS game duck abundance index
This index provides information on game
ducks only.
• The game duck abundance index
decreased by 23% from last year.
• The 2020 game duck abundance index
was the 7th lowest recorded in 38 years
of survey and is 44% of the long-term
average.
• The decrease in the index was despite
an increase in available habitat.
Generally habitat availability and game
duck abundance has a positive
relationship, so when habitat increases,
so does duck abundance. This has not
happened in 2020.
22Game duck abundance index cont..
When considering
management implications,
the abundance index must
be considered in context
with:
▪ distribution of birds
▪ habitat availability and
distribution
▪ climatic forecasts
▪ concentrations of birds
• This graph includes abundance index data (red line) and the rolling (or moving) average
(green line). A rolling average is a technique used to get an overall trend in a data set. In this
case, the rolling average is calculated for three-year subsets.
• The long-term average (mean) and median abundance levels are also included. The median
is the mid-value and is more statistically suitable than the average when outliers are present.
23Relative abundance of game duck
species 1983-2020 (EAWS)
The percentage of game ducks detected in 2020 EAWS were:
Black Duck 12% (6%), Grey Teal 33% (57%), Wood Duck 10% (13%),
Pink-eared Duck 27% (15%), Hardhead 14% (7%) and Blue-winged
Shoveler 0.3% (1%). Figures in parentheses are from 2019.
24EAWS waterbird distribution
Waterbirds were most
abundant in bands 5 and
10.
• Surveyed waterbirds were most abundant in bands 5 and 10. Data shows that bands 5
and 10 also held the most game ducks.
• The majority of the habitat occurred in bands 2 - 5 and band 10.
• Waterbirds were more widely dispersed than last year and less concentrated, reflecting
an increase in habitat availability in the Murray-Darling Basin.
• Five wetlands supported more than 5,000 waterbirds representing 35% of the total
abundance. Two of these occurred in the Murray-Darling Basin.
25Waterbird breeding (all species combined)
• The EAWS breeding index (all species combined) decreased from the previous year and remains
well below the long-term average.
• EAWS breeding species richness (i.e. the number of different species observed breeding) also
declined from last year and is well below the long-term average. Only three species were
recorded breeding and Black Swans comprised 81% of all records.
• With the exception of 2016, breeding has been supressed since the
major wet period in 2010-12.
26Waterbird breeding (all species combined)
• Most of the breeding occurred in bands 3, 5
and 9.
• Only three species were recorded breeding and
the majority of records were of Black Swans.
Only wetlands with breeding
• Due to COVID-19 restrictions, no bag surveys recorded are plotted.
were conducted during the 2020 duck season
and productivity arising from birds produced in
2019 could be assessed.
27EAWS indices over time
Decadal changes in indices for total abundance, wetland area, number of breeding species
and breeding in the EAWS 1983 - 2020
• For eastern Australia, overall waterbird abundance, breeding index and breeding
species are positively related to habitat availability (wetland area index).
• All major EAWS indices for waterbirds (total abundance, breeding index, number of
species breeding and wetland area index) continue to show significant declines
over time.
• Long-term trends are more informative for predicting
population status than year-to-year fluctuations.
28Game duck abundance,
distribution and habitat - summary
Where the ducks are Where the habitat is
29Climate predictions – future conditions
30Current climate drivers
• Australia's climate can vary greatly
from one year to the next.
• A number of drivers can influence the
Australian climate. Influences will
have varying levels of impact in
different regions at different times of
year.
• Current influences on Australia’s
climate include:
• La Niña
• The Southern Annular Mode
(SAM)
• The Madden–Julian Oscillation
(MJO)
• All of these influences typically result
in above average rainfall for
northern, eastern or central parts of
the country.
Source: www.bom.gov.au
31January – March predicted rainfall
January – March rainfall prediction can be • January to March is likely to be wetter
used to indicate the potential impact on than average for much of
habitat for the forthcoming season. Queensland, the NT interior,
southwestern WA and eastern parts of
NSW, Victoria and Tasmania (greater
than 65% chance).
• For southwestern Tasmania, drier than
average conditions are more likely.
• While the outlooks indicate wetter
than average conditions, southern
parts of Australia are entering into
their drier season, so rainfall is not
likely to be sufficient to relieve long-
term rainfall deficits.
Source: www.bom.gov.au
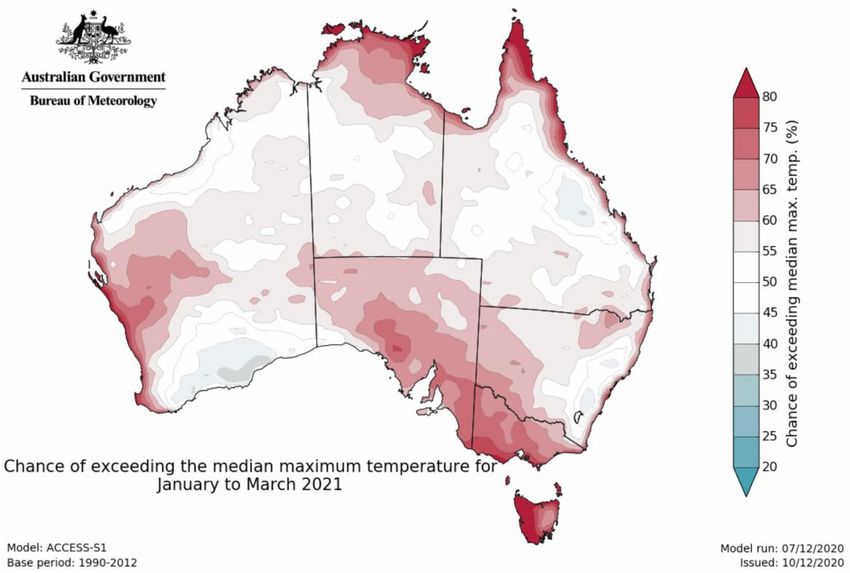
32January – March 2021
temperature prediction
• Maximum temperatures over
January to March are likely to be
higher than the long-term mean
for Tasmania, SA, Victoria,
western WA and along most of
the northern and eastern
coastlines (greater than 65%
chance).
• Below average maximum
temperatures are more likely over
a small part of southern WA
(greater than 60% chance).
• This will result in greater rates of
evaporation and the drying of
shallow, ephemeral wetlands.
Source: www.bom.gov.au
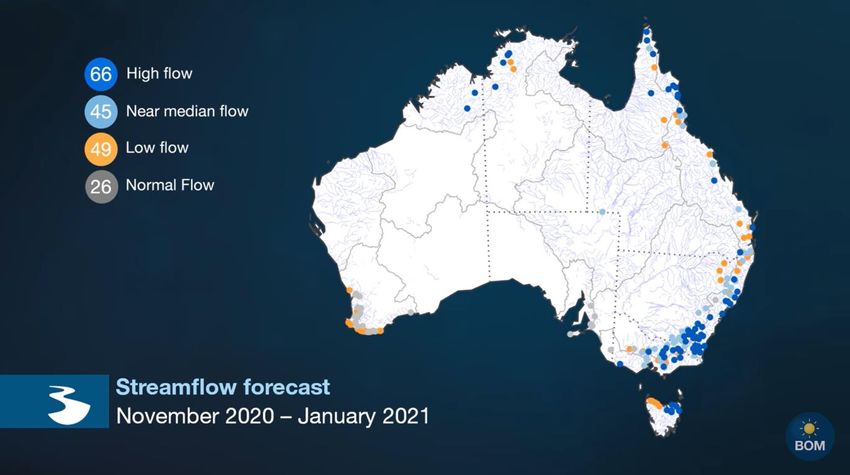
33Streamflow predictions
Streamflow has a direct influence on waterbird habitat extent and population abundance.
Rivers and creeks provide feeding, resting and breeding habitat and provide inputs into
wetlands where they have not been diverted.
Current prediction
• For summer (December – February), near median or high stream flows are expected at
most locations. Near median or high stream flows together with predicted high summer
rainfall increases the risk of flooding across areas of eastern Australia which can provide
waterbird habitat of varying duration depending on the extent of flooding and follow-up
rains.
Source: www.bom.gov.au 34Victorian harvest estimates 2020
2020 harvest estimates
 Harvest statistics can provide information on the health and dynamics of game duck
 populations, including distribution, abundance and productivity.

 •    Due to continued dry conditions and low game duck abundance, the 2020 duck season
      was modified. The season length was 38 days, starting on 2 May and concluding on 8
      June, and the daily bag limit was three birds. Blue-winged Shoveler could not be hunted.

 •    COVID-19 restrictions meant hunting could only occur on your own property at the start
      of the season. Restrictions were eased that meant hunters could hunt on private
      property and public land from Wednesday 13 May. Hunters could not camp over night
      and hunting parties were restricted to no more than 10 people. These restrictions
      remained in place until the end of the season on 8 June.

 •    These restrictions and the reduced season significantly impacted on participation levels
      and the resultant size of the total seasonal harvest.

 •    There was a maximum of 23,378 Game Licence holders endorsed to hunt duck in 2020.
      It was estimated that 32%, or 7,481, actually hunted, each taking an average seasonal
      harvest of 8.1 birds.

 •    The average number of duck hunting days per active duck hunter
       was estimated to be 3.9.

Source: Moloney, P.D. and Hampton, J.O. (2020) Estimate of duck and Stubble Quail harvest in Victoria for 2020
                                                                                                                 36
2020 harvest estimates cont…
• The total estimated seasonal harvest in 2020 was 60,400, the lowest recorded
harvest since the telephone surveys were introduced in 2009 and less than one-
sixth of the average annual duck harvests revealed by previous surveys
(373,000).
• The total estimated number of duck hunting days was 29,500 (95% CI = 22,900–
38,100) and was the lowest recorded, less than one-third of the average annual
duck hunting days in previous surveys (95,000).
• The two most commonly harvested species were Pacific Black Duck (comprised
46% of the total harvest) and Australian Wood Duck (30% of the total harvest).
The remaining ducks harvested were Grey Teal (10%), Chestnut Teal (7%),
Mountain Duck (6%) and Pink-eared Duck (Long-term harvest estimates
Estimates 2009 1 20102 2011 2012 2013 2014 2015 3 2016 4 2017 5 20186 2019 7 2020 8 Aver 2009
-2020
Licensed hunters 18,348 21,861 23,716 24,533 24,036 26,261 25,837 25,681 26,324 25,799 24,925 23,378 24,225
Total # hunter days 76,659 85,801 103,450 109,718 91,748 118,800 91,264 100,749 96,508 91,570 81,023 29,501 89,680
Total harvest 222,302 270,574 600,739 508,256 422,294 449,032 286,729 271,576 438,353 396,965 238,666 60,403 347,160
Average # days 4.0 4.0 4.5 4.6 3.7 4.6 3.6 3.9 3.8 3.6 3.3 1.26 3.74
hunted in the season
Seasonal harvest per 11.1 12.5 26.0 21.2 17.2 17.3 11.4 10.5 17.4 15.7 9.62 2.58 14.39
licence holder
Opening weekend 4.5 4.2 9.2 5.3 9.5 5.7 5.8 5.1 7.1 6.3 4.4 N/A 5.6*
bag per hunter
Average # ducks per 2.7 3.1 5.7 4.6 4.6 3.7 3.1 2.6 4.5 6.4 2.9 2.05 3.84
day hunted
*Doesn’t include 2020 Harvest estimates are at 95% confidence intervals
Modified season arrangements
1. Two (2) birds per day with an additional three (3) Wood Duck. No Blue-winged Shoveler, Pink-eared Duck or Hardhead duck (49 day season)
2. Five (5) birds per day with an additional three (3) Wood Duck. No more than 1 Blue-winged Shoveler (72 day season)
3. Ten (10) birds per day which included a maximum of two Blue-winged Shoveler on opening day. Five (5) birds per day which includes a maximum of one Blue-
winged Shoveler for remainder of season (80 day season)
4. Eight (8) birds on opening day. Four (4) birds per day for remainder of the season. No Blue-winged Shoveler hunted in 2016 (87 day season)
5. Ten (10) birds per day. No Blue-winged Shoveler hunted in 2017 (87 day season)
6. Ten (10) birds per day. No Blue-winged Shoveler hunted in 2018 (87 day season)
7. Four (4) birds per day on opening weekend. Five (5) birds per day for the remainder of the season. No Blue-winged Shoveler hunted in 2019 (65 day season)
8. Three (3) birds per day. No Blue-winged Shoveler hunted in 2020 (38 day season). COVID-19 restrictions applied to travel, gathering size, no overnight camping
38Estimates of harvest per game duck species Grey Teal, Wood Duck and Black Duck consistently make up the majority of the harvest each year. The size of the Grey Teal harvest was significantly lower than normal in 2020 and accords with the significant reduction in Grey Teal abundance detected during the EAWS. Black Duck harvest was higher than normal. 39
Summary

 Summary
Summary
•   Eastern Australia experienced extreme drought conditions between 2017 – 2019. This had a
    significant negative impact on the health of wetlands and waterways and consequently,
    waterbird populations, including game ducks.

•   Most of Australia has received average to below average rainfall in 2020 and there has been
    some partial recovery of the prolonged rainfall deficiencies.

•   Despite reaching La Nina thresholds and isolated high rainfall events in some locations,
    widespread above average rainfall has failed to eventuate in eastern Australia in 2020. Soil
    moisture levels are reducing with the dry winter, spring and early summer.

•   As a result, waterbird habitat has only increased marginally in 2020. The EAWS wetland area
    index has increased from the lowest recorded in 38 years last year to the 5th lowest recorded
    and is at 42% of the long-term average.

•   Habitat is greatest in EAWS bands 2 – 5 (northern Victoria to northern NSW) and band 10
    (north Queensland). 48% of wetlands surveyed (including dry wetlands) held no waterbirds.

                                                                                                    41
Summary
• Low densities of waterbirds are dispersed throughout eastern Australia, with the largest
concentrations in band 5 (northern NSW) and band 10 (north Queensland). This applies to
game ducks also.
• In response to the continued poor conditions for waterbirds, the EAWS game duck index of
abundance remains low at 44% of the long-term average. This is the 7th lowest recorded in
38 years and declined by 23% from the previous year.
• Excluding 2016, there has been very little large-scale waterbird breeding since 2013 and the
existing populations constitute core breeding stock.
• Hunting activity and game duck harvests were significantly reduced in 2020 due to COVID-
19 restrictions on travel, a prohibition on overnight camping and limit on the size of group
gatherings, in addition to a short (5 ½ week) season with reduced (3 bird) bag limit.
• Waterbird abundance, breeding index, breeding species richness and habitat availability are
showing continuing long-term declines. Five of the eight game duck species are showing
long-term declines.
• La Nina thresholds have been reached and the seasonal climate outlook is for a wetter than
average January – March period for 2021. A positive summer Southern Annular Mode and
the Madden-Julian Oscillation are predicted to contribute to above average rainfall across
eastern Australia. However, persistent, widespread, above average rainfall is needed to lift
areas out of deficiency at annual and longer timescales and provide
relief from the impacts of the long period of low rainfall.
42References
▪ Bureau of Meteorology - www.bom.gov.au
▪ Department of Primary Industries (DPI) 2020: https://edis.dpi.nsw.gov.au/
▪ Jenouvrier S. (2013) Impacts of climate change on avian populations. Glob Change Biol, 19: 2036-2057.
doi:10.1111/gcb.12195
▪ Kingsford R. T. and Norman F. I. (2002) Australian waterbirds—products of the continent's ecology, Emu - Austral
Ornithology, 102:1, 47 69, DOI: 10.1071/MU01030
▪ Kingsford RT, Bino G, Porter JL. (2017) Continental impacts of water development on waterbirds, contrasting two
Australian river basins: Global implications for sustainable water use. Glob Change Biol. 2017;00:1–12.
https://doi.org/10.1111/gcb.13743
▪ Moloney, P.D. and Hampton, J.O. (2020) Estimate of duck and Stubble Quail harvest in Victoria for 2020: results
from surveys of Victorian Game Licence holders in 2020. Unpublished Client Report for the Game Management
Authority. Arthur Rylah Institute for Environmental Research, Department of Environment, Land, Water and
Planning, Heidelberg, Victoria.
▪ Murray Darling Basin Authority – www.mdba.gov.au
▪ Porter J.L., Kingsford R.T., Francis, R., and Brandis K. (2020) Aerial Survey of Wetland Birds in Eastern Australia -
October 2020 Annual Summary Report, University of New South Wales 2020.
▪ Primary Industries and Regions SA 2020 – www.pir.sa.gov.au/
▪ Queensland Government 2020. Drought declarations (Department of Agriculture and Fisheries):
http://www.longpaddock.qld.gov.au/drought/drought-declarations/
▪ The Long Paddock- www.longpaddock.qld.gov.au
43You can also read