INTER AND INTRA-ANNUAL SPATIO-TEMPORAL VARIABILITY OF HABITAT SUITABILITY FOR ASIAN ELEPHANTS IN INDIA: A RANDOM FOREST MODEL-BASED ANALYSIS
←
→
Page content transcription
If your browser does not render page correctly, please read the page content below
Submitted for possible publication in the IEEE International India Geoscience and Remote Sensing Symposium 2021 (In-
                                          GARSS 2021), scheduled for December 6 – 10, 2021 in Ahmedabad, Gujarat, India.

                                                          INTER AND INTRA-ANNUAL SPATIO-TEMPORAL VARIABILITY OF
                                                             HABITAT SUITABILITY FOR ASIAN ELEPHANTS IN INDIA:
                                                                  A RANDOM FOREST MODEL-BASED ANALYSIS

                                                                    P. Anjali                                                            Deepak N. Subramani

                                            Dept. of Computational and Data Sciences                                       Dept. of Computational and Data Sciences
                                                    Indian Institute of Science                                                    Indian Institute of Science
                                                     Bangalore, India 560 012                                                       Bangalore, India 560 012
arXiv:2107.10478v1 [cs.LG] 22 Jul 2021

                                                       anjalip1@iisc.ac.in                                                            deepakns@iisc.ac.in

                                                                     ABSTRACT                                      and shrinking forest land, studies about seasonal habitat changes is
                                                                                                                   the need of the hour for understanding movement and migration pat-
                                         We develop a Random Forest model to estimate the species distribu-        terns of the species. The advent of hyper-spectral sensors provides
                                         tion of Asian elephants in India and study the inter and intra-annual     immense possibilities in the field of geosciences to monitor the evo-
                                         spatiotemporal variability of habitats suitable for them. Climatic,       lution of ecosystems over time. This sensing technique can be uti-
                                         topographic variables and satellite-derived Land Use/Land Cover           lized to arrive at a species habitat suitability model which can then
                                         (LULC), Net Primary Productivity (NPP), Leaf Area Index (LAI),            be used for planning and conservation measures.
                                         and Normalized Difference Vegetation Index (NDVI) are used as
                                         predictors, and the species sighting data of Asian elephants from              The present paper models the inter and intra-annual spatio-
                                         Global Biodiversity Information Reserve is used to develop the Ran-       temporal variability in the habitat suitability of E. maximus using
                                         dom Forest model. A careful hyper-parameter tuning and training-          a machine learning approach. The newly developed model is used
                                         validation-testing cycle are completed to identify the significant pre-   to study habitat degradation during the period 2001-2016. This
                                         dictors and develop a final model that gives precision and recall of      analysis is the first step towards developing a comprehensive Ar-
                                         0.78 and 0.77. The model is applied to estimate the spatial and tem-      tificial Intelligence (AI) based model for suggesting policies for
                                         poral variability of suitable habitats. We observe that seasonal re-      Human-Elephant conflict in India.
                                         duction in the suitable habitat may explain the migration patterns of
                                         Asian elephants and the increasing human-elephant conflict. Further,
                                         the total available suitable habitat area is observed to have reduced,
                                         which exacerbates the problem. This machine learning model is in-                             2. DATA AND METHODS
                                         tended to serve as an input to the Agent-Based Model that we are
                                         building as part of our Artificial Intelligence-driven decision support   Data. The target variable for the present study is the species pres-
                                         tool to reduce human-wildlife conflict.                                   ence data of E. maximus. This data set is obtained from the Global
                                                                                                                   Biodiversity Information Reserve [3]. A total of 231 observations
                                                                1. INTRODUCTION                                    of E. maximus were available from 2000 to 2016. There is an un-
                                                                                                                   certainty associated with each observation location. Therefore two
                                         Asian elephants (Elephas maximus) once ranged over a large part           more pseudo-presence locations were sampled from the locations
                                         of the Asian continent but are now restricted to highly fragmented        within the uncertainty range. We use predictor variables from three
                                         zones in most parts while being extinct in the others. The declining      categories: climatic, topographic, and vegetation-related. Table 1
                                         population of this endangered species requires strategic conserva-        provides a summary of the variables and their sources.
                                         tion measures to improve both the quantity and quality of the habi-            Methods. We use the Random Forest (RF) Classifier for mod-
                                         tat, which has degraded severely owing to anthropogenic pressures.        elling habitat suitability [4]. Random Forest is a versatile model with
                                         Under such a scenario, habitat suitability studies play a crucial role    the ability to capture complex relationships between environmental
                                         in planning and conservation actions and tackling issues such as          variables and species presence [5]. Further, Random Forest is an en-
                                         Human-Wildlife conflict. As per the environment ministry data, a to-      semble learning scheme with randomness introduced in the feature
                                         tal of 655 elephants were killed throughout India from 2009 to 2016       selection process for each tree and in the choice of features for each
                                         due to conflict with humans [1]. The main reasons for the deaths          split. As such, it is expected to outperform other machine learn-
                                         were reported to be electrocution, train accident, poaching, and poi-     ing algorithms. The classical species distribution model MaxEnt [2]
                                         soning. The years 2010-11 and 2012-13 topped in elephant deaths           suffers from an issue due to the limited number of observation data,
                                         when 106 and 105 deaths, respectively, were reported.                     making it difficult to model the time periods for which data was un-
                                              The widely used MaxEnt method [2] uses presence-only data to         available. On the other hand, the Random Forest model enables us
                                         estimate species distribution, but fails terribly owing to the absence    to develop the relationship between the environment variables and
                                         of sufficient data during all years and months which can adequately       species presence in a general setting, which can predict the habitat
                                         represent the environmental covariates to model the spatio-temporal       suitability even for time periods when no species presence observa-
                                         change. Also, in the prevailing situation of drastic climate changes      tion data is available.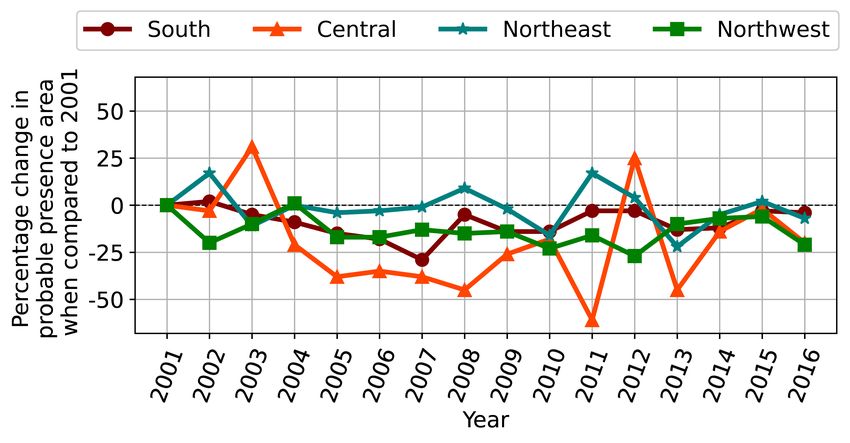
Table 1: Summary of the predictor variables used in the Random Forest habitat suitability model

   Category           Variable                                   Source                                     Unit                Spatial
                                                                                                                                resolution
   Climatic           Monthly precipitation                      https://www.worldclim.org                  mm                  2.5 minute
                      Monthly minimum temperature                https://www.worldclim.org                  °C                  2.5 minute
                      Monthly maximum temperature                https://www.worldclim.org                  °C                  2.5 minute
   Topographic        Elevation above sea level                  https://www.worldclim.org                  m                   30      arc-
                                                                                                                                seconds
                      Distance to rivers and water-bodies        Derived       using      QGIS      with    m
                                                                 data          downloaded           from
                                                                 https://www.openstreetmap.org
                      Distance to roads                          Derived       using      QGIS      with    m
                                                                 data          downloaded           from
                                                                 https://www.openstreetmap.org
                      Land Use Land Cover (LULC)                 https://bhuvan.nrsc.gov.in                 categorical         30m
   Vegetation re-     Net Primary Productivity (NPP)             https://neo.sci.gsfc.nasa.gov              gC/m²/day           0.1 degrees
   lated
                      Leaf Area Index (LAI)                      https://neo.sci.gsfc.nasa.gov              m²/m²               0.1 degrees
                      Normalized Difference Vegetation In-       https://neo.sci.gsfc.nasa.gov              Dimensionless       0.1 degrees
                      dex (NDVI)

      3. RANDOM FOREST MODEL DEVELOPMENT                                   can reasonably estimate the suitable habitat.

We first prepare a labeled data set to develop the Random Forest
Classification model from the available data. The target is set as the
presence, pseudo-presence and pseudo-absence data, for which the
corresponding predictor variables are obtained. Pseudo-presence is
required due to the uncertainty in the presence data (Sec. 2). Pseudo-
absence data is generated since the random forest model requires
both presence and absence data for training and the latter is unavail-
able [6]. Pseudo-absence points were sampled from regions outside
the available IUCN range maps for E. maximus, assuming the loca-
tions were unsuitable for occupancy [7]. 70% of the prepared labeled
data set was used for training-validation and 30% was used for test-
ing or model evaluation.
     During model development, the predictor variables (from among         Fig. 1: Importance factor of the predictor variables used in the Ran-
the ten listed in Table 1) with the least importance-factors, viz. Land    dom Forest model
Use/Land Cover (LULC), distance to roads, and distance to rivers
and water-bodies were identified and discarded in the final model.
Fig. 1 shows a bar chart of the importance-factors for the different
predictor variables. The most significant predictor variables were
Net Primary Productivity (NPP), Leaf Area Index (LAI) and ele-
vation above sea level. NPP measures the flux of carbon dioxide
between the plants and the environment, and is related to vegetation
growth over time. LAI estimates the area covered with leaves over
a unit land area, and thus measures the canopy thickness. The poor
correlation of presence data with distance to roads and LULC could
be due to the severe fragmentation of the habitat due to agricultural
and developmental activities.
     For regularizing the model, the hyper-parameters tuned were the
number of estimators, number of features considered at every split,
and maximum tree depth. The model was selected with 500 estima-
tors, two features for splitting at every node, and a maximum tree
depth of 22.
     The final model was selected as the model that had the best clas-
sification metrics, quantified through the area under the receiver op-
erating characteristic curve (AUC; Fig. 2) and precision-recall val-            Fig. 2: ROC curve for the Random Forest model training
ues. The testing precision for the best model is 0.77, recall is 0.76,
and F1 score is 0.769, indicating that the model generalizes well and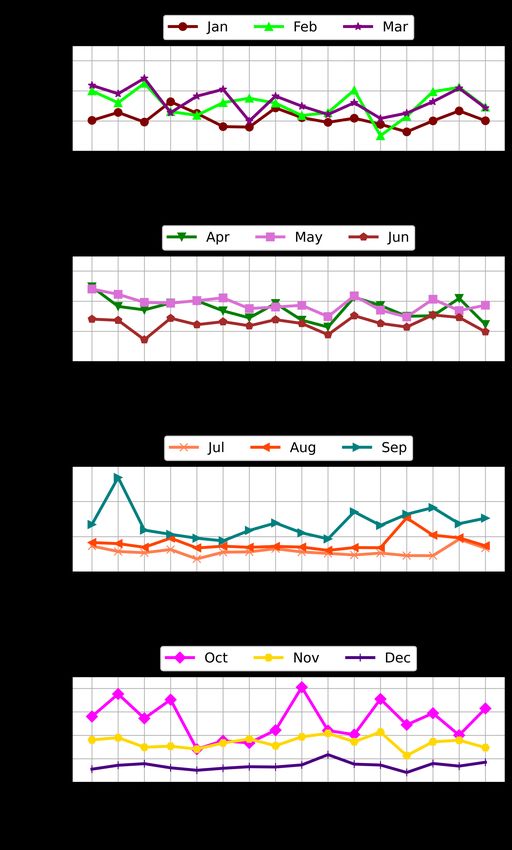
4. SPATIO-TEMPORAL ANALYSIS OF HABITAT
SUITABILITY
Our Random Forest model was applied to estimate the suitable habi-
tat range of E. maximus in India from 2000 to 2016. The monthly
mean predictor variables for each year were used as input and the
corresponding output of the Random Forest model is used for the
analysis.
Spatially, E. maximus occurs in four major areas in India: north-
east, central, north-west and south India [8]. Fig. 3 shows the per-
centage change in the aforementioned four regions with respect to
the base year of 2001. We observe a general decreasing trend with
a few anomalous years in which the suitable habitat area increased.
Crucially, the years 2011 and 2013, which saw the maximum de-
crease in habitat suitability, were the years that reported maximum
elephant deaths [1].
Fig. 4 shows the inter and intra-annual variability of the total
area of suitable habitat as estimated by the Random Forest model.
Within a year, December to August season has the lowest area of
suitable habitats. September to November months, following the
monsoon season, have an increase in the suitable habitat areas. This
trend is expected due to seasonal changes in climate and vegetation
wherein the habitable area shrinks during the dry months while in-
creased during the wet months.
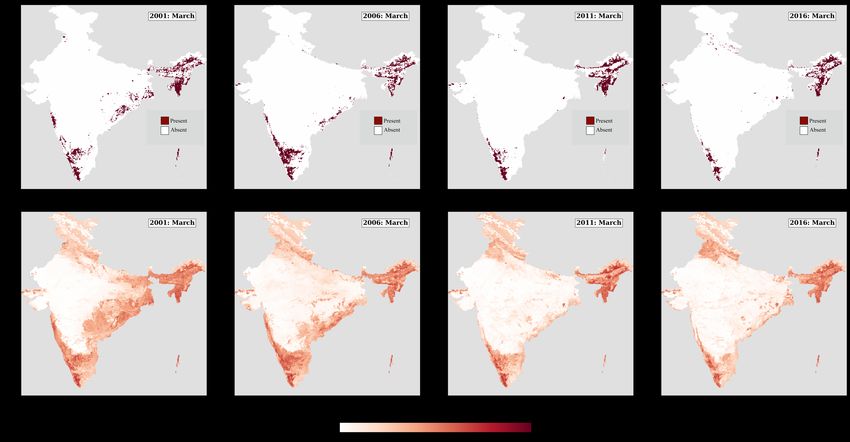
The spatial distribution of suitable habitat across the years in the
month of March (Fig. 5) shows a downward trend. As can be seen,
the suitable habitat range has shrunk significantly in the past few
years. This shrinkage in suitable habitats could explain the inter-
state movement and migration that has been observed in the recent
years. Further, the spatial distribution shows severe fragmentation of
habitat in the states of Kerala, Karnataka, and Tamil Nadu that could
account for the migration of the elephants from these southern states
to Goa and Maharashtra looking for better landscapes [7]. A similar
movement of elephants is also observed into the northern parts of
Andhra Pradesh from Odisha [7], and can be explained by looking
at the spatial pattern. Even though Western Ghats and Northeast ex-
hibits relatively stable habitats, there is severe fragmentation of the
habitat in central and north-western India, which are the regions that Fig. 4: Time series of the area (in sq. km) classified as a suit-
top the human elephant conflict problem in India. Such changes in able habitat for Asian elephants by the Random Forest model during
the suitable habitat exacerbates the Human-Elephant conflict prob- 2001-2016
lem and must be carefully studied and policy changes implemented.
5. CONCLUSION AND FUTURE WORK
A random forest model was developed to estimate the suitable habi-
tat for E. maximus in India by assembling a data set from remotely
sensed products and species presence data. This model was devel-
oped as a sub-model for an agent-based modeling system for study-
ing the human-wildlife conflict problem, emphasizing elephants in
India. The shrinking habitats pose a severe threat to the existence
of the species. Severe habitat fragmentation coupled with the ability
of E. maximus to traverse over long distances in search of food and
shelter is expected to aggravate the already grim human-elephant
conflict problem. With the population on the declining trend, it is
crucial to develop strategic conservation actions to save this endan-
gered species. Actions for preserving existing habitats and ensuring
connectivity by maintaining the corridors between them should be
Fig. 3: The percentage change in the area classified as probable pres- taken up imminently and seriously. Our next step is to develop an
ence during 2001-2016 when compared with 2001 for the four re- AI-based agent-based modeling system to aid in the decision-making
gional zones in India to solve human-wildlife conflict problems.Fig. 5: Estimated change in the habitat suitability of E. maximus for the month of March in the years 2001, 2006, 2011 and 2016 by the
random forest model. Panels a, b, c, and d show the binary classification of estimated presence and absence. Panels e, f, g, and h show
the probability distribution for classification of a pixel as presence, red indicating high habitat suitability and white indicating low habitat
suitability
References
[1] A. Mayank. “Over 80 elephants killed every year due to human
elephant conflict”. In: Mint (Sept. 2017).
[2] S. J. Phillips, M. Dudik, and R. E. Schapire. “A maximum en-
tropy approach to species distribution modeling”. In: Proceed-
ings of the 21st International Conference on Machine Learn-
ing. ACM Press, New York. (2004), pp. 655–662.
[3] GBIF Secretariat. GBIF Backbone Taxonomy. Checklist
dataset. Elephas maximus Linnaeus, 1758. https://doi.
org/10.15468/39omei. May 2021.
[4] L. Breiman. “Random Forests”. In: Machine Learning 45
(2001), pp. 5–32.
[5] R. Valavi et al. “Modelling species presence-only data with
random forests”. In: bioRxiv (2020). DOI: 10.1101/2020.
11.16.384164.
[6] J. Evans et al. Modeling Species Distribution and Change Us-
ing Random Forest. Nov. 2011, pp. 139–159. DOI: 10.1007/
978-1-4419-7390-0_8.
[7] C. Williams et al. Elephas maximus. The IUCN Red List of
Threatened Species 2020: e.T7140A45818198. https : / /
dx.doi.org/10.2305/IUCN.UK.2020- 3.RLTS.
T7140A45818198.en.. 2020.
[8] N. Baskaran et al. “Current Status of Elephants in India”. In:
Gajah 35 (Jan. 2011).You can also read