Classification of Cardiac Abnormalities from ECG Signals using SE-ResNet
←
→
Page content transcription
If your browser does not render page correctly, please read the page content below
Classification of Cardiac Abnormalities from ECG Signals using SE-ResNet
Zhaowei Zhu1* , Han Wang2* , Tingting Zhao1 , Yangming Guo1 , Zhuoyang Xu1 , Zhuo Liu1 , Siqi Liu3 ,
Xiang Lan2 , Xingzhi Sun1# , Mengling Feng2#
1
Ping An Technology, Beijing, China
2
National University of Singapore, National University Health System, Singapore
3
NUS Graduate School for Integrative Sciences & Engineering, Singapore
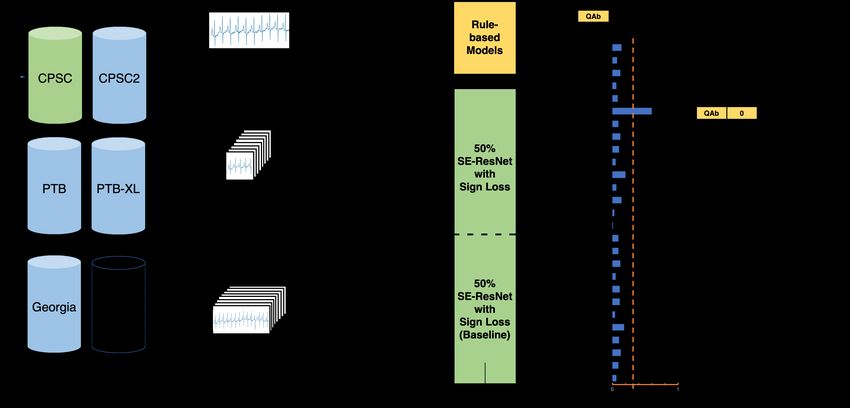
Abstract 2.1. Datasets & Labelling
In PhysioNet/Computing in Cardiology Challenge 2020, The public challenge data consist of 43,101 12-lead ECG
we developed an ensembled model based on SE-ResNet to signals from 6 different datasets, namely CPSC, CPSC2,
classify cardiac abnormalities from 12-lead electrocardio- PTB, PTB-XL, Georgia and INCART. The sampling fre-
gram (ECG) signals. Our approach integrated data from quency of the signals varies from 257 Hz to 1000 Hz, and
multiple sources, signals with different lengths, models with the length of the signals varies from 6 seconds to 30 min-
deep-learning and clinical perspectives and a special multi- utes. There are 111 labeled abnormalities in total, of which
label loss to achieve a robust classification performance. 27 are included in the final scoring metrics. From these
Our best model achieved a score of 0.885 on the offline data, we created our offline training set and test set via the
training data and a score of 0.682 on the online test data, following approaches.
suggesting a robust and stable performance of our model Processing original data. INCART dataset was ex-
over unseen data. Based on the best entry, our team Heart- cluded from our training data since it has only 74 30-
Beats ranked 3rd out of the 100 teams that participated in minutes records with a sampling frequency of 257 Hz and is
this year’s Challenge. significantly different from other datasets. All data without
a label in the 27 scored classes were excluded as well. PTB
dataset was downsampled from 1000 Hz to 500 Hz to make
1. Introduction the sampling frequency of all training data unified. Since
lead III, aVR, aVL and aVF are linearly dependent on other
leads and can be calculated based on Einthoven’s Law [4]
Electrocardiogram (ECG) examines the physiological
and Goldberger’s equations [5] , these 4 leads were also
activities of the heart and helps the diagnosis of many car-
excluded. In the rest of the data, we randomly split 80%
diovascular abnormalities [1]. Diagnosis with the ECG
as the training set and 20% as the offline test set. The final
signal requires the clinician to careful examine and identify
sizes of the training set and test set are 30,172 and 7,544
the inter-beat and intra-beat patterns. The process can be
respectively.
both time-consuming and error-prone [2]. Thus, a quick
Relabelling CPSC data. CPSC dataset was relabeled
and accurate algorithm for automatic ECG pattern classifi-
due to the fact that the labels cover only 9 classes and
cation is always desired. In the PhysioNet/Computing in
the class distribution is significantly different from other
Cardiology Challenge 2020, participants were to develop a
datasets. A baseline model was first trained on the original
model to automatically identify the cardiac abnormalities
training set, and used for inference on CPSC dataset. For
present in 12-lead ECG recordings [3]. In this paper, we
each signal, among all the classes with inference output
will describe our approaches to tackle the challenge.
probability higher than 0.8, the classes that were not in the
original 9 classes but in the 27 scored classes were added
2. Methods as a new label.
To check the validity of our relabelling strategy, out of all
The overall system design is shown in Figure 1 and will the relabelled data with inference output probability higher
be elaborated below. than 0.95, 11 records were reviewed by a clinician. The
feedback that most of the new labels were valid testified
that CPSC dataset has missing labels.
* These authors contributed equally and are co-first authors.
# These authors contributed equally and are co-corresponding authors. Including external dataset. In order to help validate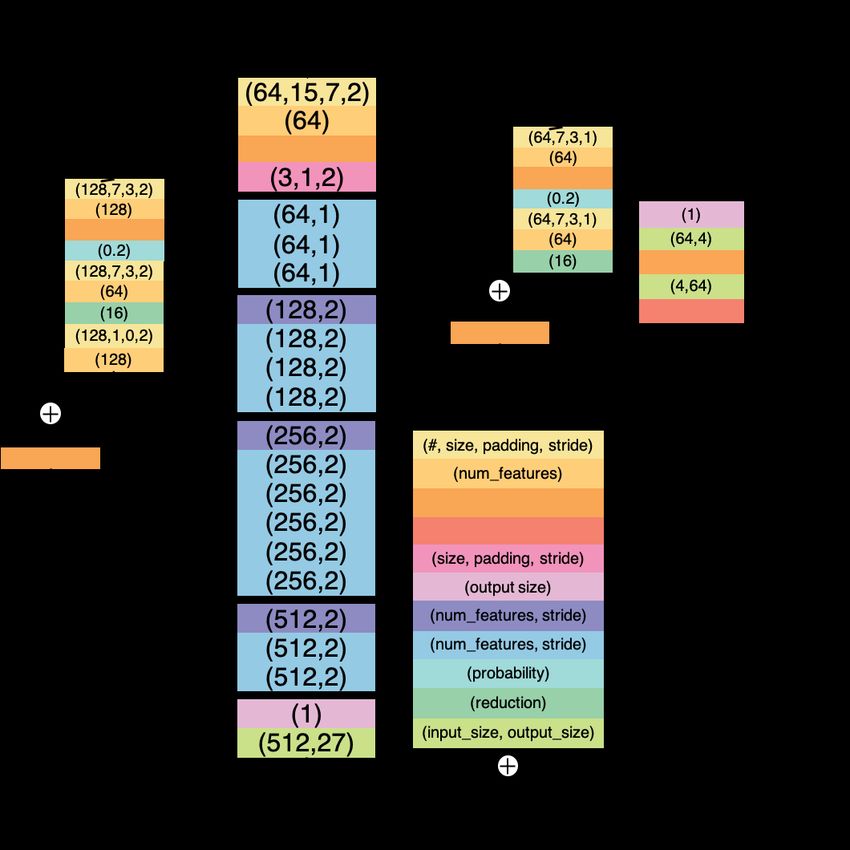
Figure 1. Illustration of the system design.

the generalizability of our model, an external dataset from
Hefei Hi-tech Cup ECG Intelligent Competition [6] (Hefei
dataset in short) was introduced. Hefei dataset consists
of 40,000 records of 8-lead ECG signals with a sampling
frequency of 500 Hz and length of 10 seconds. Out of
all the records, 6,500 records with labels in the 27 scored
classes were randomly selected and formed an external test
set.

2.2.     Data Preprocessing
   To better prepare the data for model training, we adopted
the following data preprocessing techniques.
   Truncating & padding. For the baseline model, all
input signals were fixed at 30 seconds in length. This was
done by truncating the part exceeding the first 30 seconds
for longer signals and padding the shorter signals with zero.
For the other ensembled model, the input length was fixed
at 10 seconds with the same preprocessing method.
   Wavelet denoising. To reduce the noise in ECG sig-
nals, biorthogonal wavelet transformation was applied. The            Figure 2. Architecture of the SE-ResNet model.
numbers of vanishing moments for the decomposition and
reconstruction filters were 2 and 6 respectively. The level      this way, more important channels could be given higher
of refinement was set to be 8.                                   weights, leading to a better prediction performance. Our
                                                                 baseline model was an SE-ResNet model with the input
2.3.     System Architecture                                     length of 30 seconds. To minimize the effect of padding on
                                                                 the shorter signals, another SE-ResNet model was trained
   SE-ResNet. SE-ResNet [7] was used as our main model           with the input length of 10 seconds and ensembled with the
for the task. Introducing Squeeze-and-Excitation (SE) block      baseline model. The structure of our SE-ResNet model is
into the ResNet [8] structure allows the model to adaptively     shown in Figure 2.
adjust the weights of each channel in the feature maps. In
Sign Loss. A significant issue observed in our data was Algorithm 2: Final bradycardia prediction
class imbalance, which resulted in predictions biased to- Input: Prediction from ensembled model
wards the majority class. To mitigate this issue, a multi- Prediction from rule-based model
label sign loss [9] was adapted and used during our training. Output: Final classification of bradycardia
The sign loss is defined as follows: if Prediction from rule-based model is False
return False
else
(1 − p)2 ,
, |y − p| < 0.5 return Prediction from ensembled model
sign(p) = 1
(1 − p)− 2 , |y − p| ≥ 0.5
2.4. Training Setup
Loss(p, y) = sign(p) × BinaryCrossEntropyLoss(p, y)
The ensembled model was trained for 19 epoches with a
The gradient of the loss changes significantly around batch size of 16 on a machine with 117 GB RAM, 4-core
0.5, hence emphasizes the loss incurred from mis-classified CPU and one NVIDIA V100 GPU. The model parameters
samples and reduces the accumulated loss from the large were optimized with the Adam optimizer [12]. The learning
number of negative samples that have been already correctly rate during training was set as 0.001, and rescheduled to
classified. The optimal binarization threshold will also be 0.0001 at the 13th epoch. The optimal binarization threshold
close to 0.5 and more robust. was found to be 0.36 on the offline test set.
Rule-based model. The baseline model did not perform
well enough for certain classes while there were relatively 3. Results
clear clinical rules to follow. One of such classes is brady-
cardia. Bradycardia is defined when the heart rate is slower Table 1 shows the locally evaluated challenge scores on a)
than 1 beats per second [10], or the R-R interval between the test set divided from the official offline data, b) the test
two heartbeats is longer than 1 second. To detect the R-R set from Hefei dataset and c) the full training set consisting
intervals, Pan & Tompkins algorithm [11] was used to de- of both offline training and test set.
tect the R-peaks on lead I, and R-R intervals could be easily
calculated. The pseudocode of the rule-based model for 20% test Hefei test Full training
bradycardia is shown in Algorithm 1. 1) Model15000 0.674 0.300 0.805
2) Model5000 0.674 0.236 0.782
3) Model1) + 2) 0.680 0.305 0.883
Algorithm 1: Rule-based bradycardia classifier
4) Model3) + Rule 0.683 0.319 0.885
Input: List of R-R intervals
Output: Classification of bradycardia Table 1. Model performance on offline datasets. SNR
brady beats = 0; postprocessing were done on all four models.
foreach R-R interval
if 1s ≤ length of interval ≤ 1.6s The 4th model scored highest in all three sets, hence was
brady beats += 1 chosen as our best entry, and obtained an online challenge
if brady beats / # of R-R intervals ≥ 0.5 score of 0.682.
return True
else 4. Discussion
return False
From the results above, our ensembled approach demon-
strated its ability to classify the cardiac abnormalities de-
However, the final bradycardia prediction of the system
spite of the challenges presented, e.g. noise in the signals
was not purely decided by the rule-based model. A very
and labels. The offline score on the 20% test set is 0.683,
high recall and low precision were observed when doing so,
only differed the online score by 0.001, suggesting good
and this could be attributed to the sub-optimal label quality
generalizability and little overfitting.
of the datasets. Therefore, the prediction of rule-based
During the challenge, we also experimented with several
model was only taken when its output is negative. The
other ideas. One idea that we would like to share and
pseudocode for the final bradycardia prediction is shown in
hopefully inspire further explorations is the segmentation
Algorithm 2.
of abnormal heartbeats.
SNR Postprocessing. Signals that were predicted to be Abnormal heartbeats segmentation via 1D U-net.
negative for all classes were revised to be positive for the Some of the cardiac abnormalities are associated with indi-
default normal class, sinus rhythm (SNR). vidual heartbeats. If the model can learn to recognize theseindividual heartbeats that directly lead to the abnormality Rhythm Society endorsed by the International Society for
label, it may perform and generalize better, especially when Computerized Electrocardiology. Journal of the American
the abnormal heartbeats are rare and sparse over the signal College of Cardiology 2007;49(10):1109–1127.
span. [2] Bickerton M, Pooler A. Misplaced ecg electrodes and the
Based on the preliminary analysis of the prediction re- need for continuing training. British Journal of Cardiac
sults and advice from a clinician, we selected data with Nursing 2019;14(3):123–132.
[3] Perez Alday EA, Gu A, Shah A, Robichaux C, Wong AKI,
PVC labels to annotate. The raw lead-II signals were trans-
Liu C, Liu F, Rad BA, Elola A, Seyedi S, Li Q, Sharma A,
formed into images by plotting on a grid background. The Clifford GD, Reyna MA. Classification of 12-lead ECGs:
images were then imported into Colabeler [13], and we the PhysioNet/Computing in Cardiology Challenge 2020.
manually annotated all suspected PVC heartbeats by spec- Under Review 2020;.
ifying their x-axis spans. Lastly, we translated the x-axis [4] Kligfield P. The centennial of the Einthoven electrocardio-
spans back to the actual locations on the signals. Due to gram. Journal of Electrocardiology 2002;35(4):123–129.
time constraint, only 160 PVC data were annotated and [5] Goldberger AL, Goldberger ZD, Shvilkin A. Goldbergers
used for subsequent training. We adapted U-net [14], a clinical electrocardiography: a simplified approach. Else-
popular segmentation model in medical imaging to segment vier, 2018.
the PVC heartbeats. The 160 annotated PVC records were [6] URL https://tianchi.aliyun.com/competi
used as positive samples and 500 randomly selected records tion/entrance/231754/introduction.
without PVC label were used as negative samples to train [7] Hu J, Shen L, Sun G. Squeeze-and-excitation networks.
2018 IEEECVF Conference on Computer Vision and Pat-
the model. The PVC classification is considered as positive
tern Recognition 2018;.
if there is any positive PVC signal output. When we incor- [8] He K, Zhang X, Ren S, Sun J. Deep residual learning for
porated U-net into our system, the PVC predictions were image recognition. 2016 IEEE Conference on Computer
solely determined by U-net. Vision and Pattern Recognition CVPR 2016;.
Our experiments showed that incorporating U-net in- [9] Sun X, Chakrabarty K, Huang R, Chen Y, Zhao B, Cao H,
creased the Fbeta and Gbeta measures in the evaluation met- Han Y, Liang X, Jiang L. System-level hardware failure pre-
rics, but no challenge score improvement was observed. diction using deep learning. Proceedings of the 56th Annual
Due to the additional training time required, we did not Design Automation Conference 2019 2019;.
incorporate U-net in our final system. [10] Bradycardia, Nov 2019. URL https://www.mayocl
inic.org/diseases-conditions/bradycard
5. Conclusions ia/symptoms-causes/syc-20355474.
[11] Pan J, Tompkins W. A real-time QRS detection algorithm.
In this paper, we have described our approach used in the IEEE Transaction on Biomedical Engineering ;32.
PhysioNet/Computing in Cardiology Challenge 2020. Our [12] Kingma DP, Ba J. Adam: A method for stochastic optimiza-
tion. In Bengio Y, LeCun Y (eds.), 3rd International Confer-
ensembled SE-ResNet model is able to classify 27 cardiac
ence on Learning Representations, ICLR 2015, San Diego,
abnormalities on 12-lead ECG signals with a challenge
CA, USA, May 7-9, 2015, Conference Track Proceedings.
score of 0.682 on the online test set. Since the system is 2015; URL http://arxiv.org/abs/1412.6980.
trained on real-life datasets, we believe that it has a great [13] URL http://www.colabeler.com/.
potential in the actual clinical practice. [14] Ronneberger O, Fischer P, Brox T. U-net: Convolu-
tional networks for biomedical image segmentation. Lec-
Acknowledgments ture Notes in Computer Science Medical Image Computing
and Computer Assisted Intervention – MICCAI 2015 2015;
We would like to thank Dr. Pipin Kojodjojo from Na- 234–241.
tional University Health System, Singapore for his valuable
clinical input on ECG signals. This study is partially sup-
ported by the National University Start-up grant. Address for correspondence:
Xingzhi Sun
References 3 Xinyuan Road, Chaoyang District, Beijing, China
sunxingzhi820@pingan.com.cn
[1] Kligfield P, Gettes LS, Bailey JJ, Childers R, Deal BJ, Han-
cock EW, Van Herpen G, Kors JA, Macfarlane P, Mirvis Mengling Feng
DM, et al. Recommendations for the standardization and 12 Science Drive 2, Singapore
interpretation of the electrocardiogram: part i: the electro- ephfm@nus.edu.sg
cardiogram and its technology a scientific statement from
the American Heart Association electrocardiography and
arrhythmias committee, council on clinical cardiology; the
American college of cardiology foundation; and the HeartYou can also read