HOUSEHOLD SPENDING INTENTIONS SERIES - MARCH 2021 - COMMBANK
←
→
Page content transcription
If your browser does not render page correctly, please read the page content below
Household Spending
Intentions Series.
March 2021

Household Spending Intentions Series

A new view on
Australia’s spending.
However you do business or invest, knowing what’s around the corner can
keep you one step ahead.
Whether you are at the helm of a family business, a policy maker, an investor
or one of Australia’s corporate enterprises - robust insights on shifting
consumer spending intentions are critical for your plans for the future and
determining whether it’s time to ramp up or down.
CommBank’s Household Spending Intentions series combines our spending
data, one of Australia’s largest financial data sources, with Google Trends
publically available search activity. By connecting with advance readings on
actual spending data to intentional data, our analysis should provide an early
indication of prospective spending trends.
Tracked across seven spending sectors, our analysis can offer a future lens
into specific industries.
When these sectors are looked at together, the Household Spending
Intentions series provides a holistic view on the changing spending
behaviours of Australians and the potential implications for the economy.

                                                                                                                   2
Household Spending Intentions Series

Summary
The Household Spending Intentions (HSI) series for March 2021 showed
improvement across five of the seven spending categories, with strong increases
in Home Buying, Travel, Entertainment, Education and Motor vehicle spending
intentions. Health & Fitness spending intentions consolidated recent gains in
March, while Retail spending intentions were lower. However, it must be noted
that we are now experiencing significant base effects with the distortion in
spending intentions that were evident at the start of the COVID-19 period in
March last year.

This month's snapshot

 Home Buying                   Retail                Motor Vehicle                Entertainment   Travel   Education         Health & Fitness

                                                                                                                                                 3
Household Spending Intentions Series
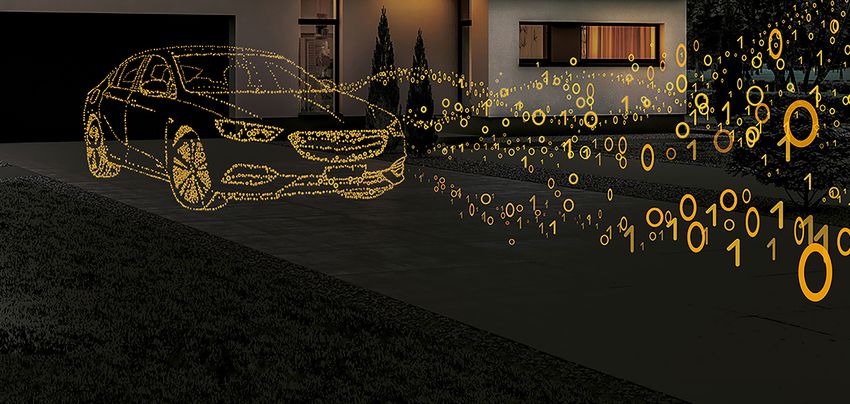
HSI Dashboard
% % %
%
18 18
Home Buying Retail
60 60
HSI
Spending Intentions 40 40
Spending Intentions Smoothed
HSI 12 12
• Home buying spending intentions increased in Smoothed • The pace of Retail spending intentions declined in
March to a new series-high. While part of the 20 20
March 2021 – reflecting the jump in retail sales at the
strength reflects the declines seen at the start of start of the COVID-19 lockdowns one year ago. 6 6
the COVID-19 period last year, the strong increase • The year to March 2021 saw a wide range of spending
0 0
in March reflects both an increase in home loan patterns across different sectors of the market.
applications and Google searches. Relative to March last year, strong increases were 0 0
• We continue to expect the home buying market -20 -20 seen in spending on clothing & footwear, department
to be a key source of support for the Australian stores, furniture and home equipment stores,
economy in 2021 – driven largely by the very low Source: CBA / Google Trends hardware stores, jewellery & watch stores, luggage Source: CBA / Google Trends
level of interest rates. -40 -40 & leather goods, beauty stores & barbers, cosmetic -6 -6
• As we stated in last month’s HSI report, Jan 15 Jan 16 Jan 17 Jan 18 Jan 19 Jan 20 Jan 21 stores, health spas, digital apps, electronic stores and Jan 15 Jan 16 Jan 17 Jan 18 Jan 19 Jan 20 Jan 21
residential property prices in Australia are florists.
(annual % change) (annual % change)
expected to be up 8% in 2021 and 6% in 2022, • Some major categories, however, saw declines
with house prices expected to be 9% higher this in the year to March, including: grocery stores &
year. supermarkets, duty free stores, pharmacies and
stationary & office supplies.
% %
%
Travel Health and Fitness
%
40 40
HSI
Spending Intentions 20 20
Spending Intentions Smoothed
6 6
• Travel spending intentions jumped higher in 0 0 • Health & Fitness spending intentions were largely
March, partly due to the start of the collapse seen unchanged in March, consolidating the gains 4 4
last year, but also due to an increase in travel seen since the end of 2020. While actual spending
-20 -20
related spending in the month. continued to rise, Google searches were down.
2 2
• For the year to March, spending intentions • Health & Fitness spending intentions were very
-40 -40
increased noticeably for; amusement parks, HSI volatile through 2020 as the impact of COVID-19
aquariums, camper & recreation vehicle dealers, and the various lock-downs across the states had a
Smoothed 0 0
hotels, motels & resorts, motor home and RV -60 -60 significant impact. This volatility will now likely be
rentals, sport & rec camps, tourist attractions, reflected in the annual changes throughout 2021.
Source: CBA / Google Trends Source: CBA / Google Trends
trailer park & camp grounds and car rentals. • For March 2021 the largest annual increases
-80 -80 -2 -2
• Declines were seen in the annual pace of Jan 15 Jan 16 Jan 17 Jan 18 Jan 19 Jan 20 Jan 21 in spending were seen for; sports clothing, Jan 15 Jan 16 Jan 17 Jan 18 Jan 19 Jan 20 Jan 21
spending for airlines, cruise ships, timeshare, chiropractors, dentists, doctors, hospitals, nursing
travel agents and bus lines. (annual % change) and personal care, optometrists, podiatrists, bicycle (annual % change)
shops, professional sport, golf courses (private and
public) and sporting goods stores.
4
Household Spending Intentions Series

                    HSI Dashboard
                                                                                                                                                                                         %                                                   %
                                                                %                                                   %
                                                                                                                                                                                         6                                                   6
Entertainment                                                                                                             Education
                                                               30                                                   30                                                                                HSI

Spending Intentions                                                                                                       Spending Intentions
                                                                                                                                                                                                      Smoothed
                                                               20                                                   20                                                                   4                                                   4

                                                               10                                                   10                                                                   2                                                   2
•   Entertainment spending intentions were also sharply                                                                   •   Education spending intentions continued their
    higher in March, as the base-effects from 2020 came                                                                       recovery in March, with the number of transactions
    into play and as spending increased in the month.           0                                                   0         improving even while Google searches and the value         0                                                   0

•   Some of the biggest improvements in spending on                                                                           of transactions declined.
    the year for March 2021 included: on premise drinking      -10                                                  -10   •   In terms of transaction volume, increases were seen in     -2                                                  -2
    establishments, restaurants, fast food outlets, boat                     HSI                                              the year to March for colleges & universities, secondary
    rentals, bowling alleys, cable TV, movie theatres, dance                 Smoothed                                         schools and trade & vocational schools.                    -4                                                  -4
                                                               -20                                                  -20
    halls, studios & schools, digital books, movies & music                                                               •   In terms of transaction values, increases in the year
    and musical theatre venues.                                      Source: CBA / Google Trends                              to March were seen in correspondence schools,                   Source: CBA / Google Trends

                                                               -30                                                  -30                                                                  -6                                                 -6
•   In contrast, some weakness is evident in spending in                                                                      secondary schools and trade & vocational schools. This
                                                                 Jan 15 Jan 16 Jan 17 Jan 18 Jan 19 Jan 20 Jan 21                                                                          Jan 15 Jan 16 Jan 17 Jan 18 Jan 19 Jan 20 Jan 21
    off-premise alcohol, digital games and video game                                                                         was offset by declines in business & secretarial schools
    supplies and establishments.                                                                                              and colleges & universities.
                                                                                (annual % change)                                                                                                           (annual % change)

Motor Vehicle                                                   %                                                   %

Spending Intentions
                                                                                                     HSI
                                                                                                     Smoothed
                                                                5                                                   5

•   Motor vehicle spending jumped higher in
    March. While Google searches were little
    changed, motor vehicle purchases and motor                  -5                                                  -5
    vehicle loan applications both increased in                                                                                                         The first issue of our Household Spending
    March 2021 and relative to March 2020.                                                                                                              Intentions report from 23 July 2019 can be
•   The changing use of public transport, supply                                                                                                        found here. The report provides more detail
    shortages and changing patterns of work                    -15                                                  -15
    are all supporting an improvement in motor
                                                                                                                                                        on the thinking behind our HSI measures.
    vehicle spending intentions.
                                                                     Source: CBA / Google Trends
•   The ongoing improvement in the housing                     -25                                                 -25
    market is also expected to support the                        Jan 15 Jan 16 Jan 17 Jan 18 Jan 19 Jan 20 Jan 21
    outlook for motor vehicle spending – as
    increased household wealth can translate into                               (annual % change)
    increased demand for new or used cars.

                                                                                                                                                                                                                                         5
Household Spending Intentions Series
The approach
The need to get ahead of emerging trends has never been greater. Policy makers
need to keep ahead of changes in demand for public goods and services if they
want to keep the voters happy. Companies need to keep ahead of changes in
demand for private goods and services if they want to keep their shareholders
happy. Individuals need to keep ahead to maximise their personal utility.
We all need early warning signs of emerging risks and issues.
When peering into the future it is essential to know where you are standing.
And here the Commonwealth Bank has an advantage. The Bank’s business
generates a significant amount of close to “real time” information on how the
economy is travelling. This information relates particularly to the household
sector. Households are the dominant part of the economy and drive much of its
activity and volatility. From that perspective, CBA is the largest financial services
organisation in the country with over sixteen million customers. The interaction
with these customers generate a vast array of data on the activities of Australian
households. An ongoing sample of more than 2½ million households who
are CBA customers, for example, gives us information on income, wealth and
spending trends shortly after the end of each month.
CBA data measures are really coincident indicators of economic activity. But they
are leading indicators in a publication sense.
Even with the best data, however, economists have never been very good in
measuring and incorporating intentions into their forecasts.
At the most basic level, the act of spending is preceded by an intention to spend.
Spending money on a holiday is a good example. By the time you’ve decided
where to go on tripzard.com, booked a flight on webjet.com, chosen a hotel on
tripadvisor.com, topped up your Travel Money Card at commbank.com.au and
decided what to do when you get there on LonelyPlanet.com you have scattered
a fair amount of clues about your intention to spend! Search activity is one way to
track these intentions. And Google Trends provides the needed tools.
By combining the up-to-the minute data from CBA’s household surveys with
relevant searches from Google Trends, we have developed indicators of
household purchase intentions. (click here to see how spending intentions form).
6Talk to us Visit commbank.com.au/spendingintentions or email globalmarketsresearch@cba.com.au Things you should know: This ‘Commonwealth Bank Household Spending Intentions’ series provides general market-related information, and is not intended to be an investment research report. The ‘Commonwealth Bank Household Spending Intentions’ series has been prepared without taking into account your objectives, financial situation (including the capacity to bear loss), knowledge, experience or needs. Before acting on the information in the ‘Commonwealth Bank Household Spending Intentions’ series, you should consider the appropriateness and, if necessary seek appropriate professional or financial advice, including tax and legal advice. The data used in the ‘Commonwealth Bank Household Spending Intentions’ series is a combination of the CBA Data and publically available Google Trends™ data. Google Trends is a trademark of Google LLC. Commonwealth Bank of Australia (the “Bank”) believes that the information in this report is correct and any opinions, conclusions or recommendations are reasonably held or made, based on the information available at the time of its compilation, but no representation or warranty, either expressed or implied, is made or provided as to accuracy, reliability or completeness of any statement made in this report. Any opinions, conclusions or recommendations set forth in this report are subject to change without notice and may differ or be contrary to the opinions, conclusions or recommendations expressed elsewhere by the Bank or any member of the Commonwealth Bank of Australia group of companies. Any valuations, projections and forecasts contained are based on a number of assumptions and estimates and are subject to contingencies and uncertainties. Different assumptions and estimates could result in materially different results. The Bank does not represent or warrant that any of these valuations, projections or forecasts, or any of the underlying assumptions or estimates, will be met. Past performance is not a reliable indicator of future performance. Where ‘CBA data’ is cited, this refers to the Bank proprietary data that is sourced from the Bank’s internal systems and may include, but not be limited to, credit card transaction data, merchant facility transaction data and applications for credit. The Bank takes reasonable steps to ensure that its proprietary data used is accurate and any opinions, conclusions or recommendations are reasonably held or made as at the time of compilation of this report. As the statistics take into account only the Bank’s data, no representation or warranty is made as to the completeness of the data and it may not reflect all trends in the market. All customer data used, or represented, in this report is anonymised and aggregated before analysis and is used, and disclosed, in accordance with the Group’s Privacy Policy Statement. The CBA Spotlight Series does not contain any recommendations but provides commentary on Australian macroeconomic themes. As the CBA Spotlight reports are based on CBA Data, the IB&M Client Analytics team provide raw data that may directly or indirectly relate to the themes that have been selected for coverage by the Chief Economist. The IB&M Client Analytics team are subject to the same personal conflict requirements and trading restrictions as research, and individuals are wall- crossed per report. CBA Spotlight reports may be viewed in advance of publication by CBA Marketing and Communications in order to produce infographics. Reports are only provided to Marketing and Communications team members under strict wall-crossing and during this period their individual trading is monitored. We are under no obligation to, and do not, update or keep current the information contained in this report. Neither the Bank nor any of its affiliates or subsidiaries accepts liability for any loss or damage arising out of the use of all or any part of this report. All material presented in this report, unless specifically indicated otherwise, is under copyright of the Bank. None of the material, nor its content, nor any copy of it, may be altered in any way, transmitted to, copied or distributed to any other party, without the prior written permission of the Bank. In the case of certain products, the Bank or one of its related bodies corporate is or may be the only market maker. Financial markets products have an element of risk. The level of risk varies depending on a product’s specific attributes and how it is used. The Bank will enter into transactions on the understanding that the customer has: made his/her own independent decision to enter into the transaction; determined that the transaction is appropriate; ensured he/she has the knowledge to evaluate and capacity to accept the terms, conditions and risks; and is not relying on any communication (including this report) from the Bank as advice. This report is not directed to, or intended for distribution to or use by, any person or entity who is a citizen or resident of or located in any locality, state, country or other jurisdiction where such distribution, publication, availability or use would be contrary to law or regulation or that would subject any entity within the Commonwealth Bank group of companies to any registration or licensing requirement within such jurisdiction. Unless agreed separately, we do not charge any fees for any information provided in this report. You may be charged fees in relation to the financial products or other services the Bank provides, these are set out in the relevant Financial Services Guide (“FSG”), relevant “PDS”, relevant Terms & Conditions, and/or relevant contract. If you have a complaint, the Bank’s dispute resolution process can be accessed on 13 22 21 when in Australia, and +61 2 9841 7000 from overseas. Commonwealth Bank of Australia ABN 48 123 123 124 AFSL 234945 and its subsidiaries, including Commonwealth Securities Limited ABN 60 067 254 399 AFSL 238814 (CommSec), Commonwealth Australia Securities LLC and CBA Europe Ltd., are domestic or foreign entities. Global Markets Research is a business division of the Commonwealth Bank group of companies.
You can also read