AUD/USD Exchange Rate Outlook - Richard Grace Chief Currency and Rates Strategist & Head of International Economics +(612) 9117 0080 ...
←
→
Page content transcription
If your browser does not render page correctly, please read the page content below
AUD/USD Exchange Rate Outlook

Richard Grace
Chief Currency and Rates Strategist & Head of International Economics
+(612) 9117 0080
richard.grace@cba.com.au

March 2015
Outlook for AUD/USD Exchange Rate
AUD/USD is likely to further depreciate to 0.7300 by end-June and 0.7000 by end-2015 for 5 reasons –
(1) Lower commodity prices - supply-driven declines in Australia’s commodity export prices, are applying
downward pressure to Australia’s terms of trade.
(2) Narrower Australia-US interest rate differentials – low global and Australian inflation, a weak domestic
economy and a terms of trade driven contraction in
Australia’s real gross domestic income is generating
downward pressure on Australian swap rates. At the
AUD/USD EXCHANGE RATE same time, an improving US economy and guidance
1.15 1.15
from the FOMC is generating mild upward pressure
Recent Ten-Year Average on US short-term swap rates.
1.00 0.8864 1.00
(3) Slower Chinese growth, lower Asian inflation, rates and
0.85 0.85
currencies, which are applying downward pressure.
0.70 0.70
(4) A stronger USD – in response to a higher US terms of
1983 - 2004 Average trade, and the prospect of higher US interest rates.
0.55 0.7040 0.55
AUD /USD (rhs)
0.40 0.40
(5) Cross-rate pressure - from a large USD bid in the global
Dec-83 Oct-94 Aug-05 Jun-16 foreign exchange market.
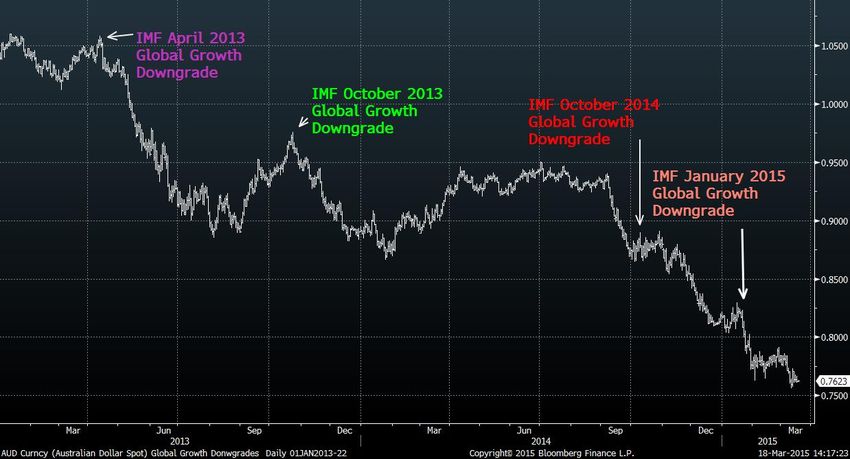
2Importance of Global Growth Revisions Should Not be Underestimated
IMF revisions to global growth should be taken note of.
3Commodity Prices Lower – Led by Increases in Supply
Excess commodity supply is driving commodity prices lower, rather than soft demand.
GLOBAL OIL BALANCE GLOBAL MINING INVESTMENT
%pa (source: Energy Intelligence Group) %pa
8 8 $US
350
(volumes, 1995 prices)
bn
280
Globla Oil Supply
4 4
Average 210
140
0 0
Global Oil Demand 70 Developed markets
Emerging markets
-4 -4 0
Jan-04 May-06 Sep-08 Jan-11 May-13 Sep-15 1995 1998 2001 2004 2007
4Commodity Prices Lower – Led by Increases in Supply
AUD being used as a proxy for lower commodity prices and because export prices falling.
AUD/USD & AUSTRALIA'S
OIL PRICE & RBA COMMODITY TERMS OF TRADE
PRICE INDEX 130 1.15
140 140
Australia
Brent Oil Price US$b Terms of Trade Index (lhs)
(lhs)
112 1.01
112 116
94 0.87
84 92
RBA Commodity Price
Index (SDR Terms) rhs 76 0.73
56 68
AUD /USD (rhs)
58 0.59
28 44
40 0.45
0 20
Mar-00 Jul-03 Nov-06 Mar-10 Jul-13 Nov-16
Jun-88 Jun-93 Jun-98 Jun-03 Jun-08 Jun-13
5Lower Global Commodity Prices Impact Australia’s Terms of Trade
The Australian terms of trade effect is a major driver of interest rates and especially AUD
AUSTRALIA GDP AND INCOME AUSTRALIA GDP GROWTH
GROWTH %
Annual % Change
%
5.0 8.0
Domestic Demand
8 8
2.5 6.0
GDP
4 4
0.0 4.0
Difference between
Real Gross Domestic
Income and Real GDP 0 0
-2.5 2.0
Growth YoY% (lhs)
RBA Cash Rate (rhs) Net Exports (contribution)
-5.0 0.0 -4 -4
Mar-02 Feb-05 Jan-08 Dec-10 Nov-13 Oct-16 Mar-00 Dec-03 Sep-07 Jun-11 Mar-15
6Australian Unemployment Rate & RBA Cash Rate
Australia unemployment rate generally rises when employment growth is less than 2.0%
AUSTRALIA LABOUR MARKET AUSTRALIAN EMPLOYMENT
& RBA CASH RATE 6
8.4 3.7 Total Employment Growth
(YoY%) lhs
5 If employment growth falls 6.6
Unemployment Rate below 2.0% (YoY), the
7.0 (Inverted Three Month 4.3 unemployment rate
Moving Average) rhs 4 generally rises 6.2
5.6 4.8 3 5.7
2 5.3
4.3 5.4
1 4.9
2.9 5.9
0 4.4
RBA Cash Rate (lhs)
Unemployment
1.5 6.5 Rate (rhs)
-1 4.0
Mar-04 Jun-06 Sep-08 Dec-10 Mar-13 Jun-15
Jan-03 Dec-05 Nov-08 Oct-11 Sep-14
7Australian vs. US Unemployment Rate
Australia-US unemployment rate divergence and differential is a powerful guide for AUD.
AUSTRALIA & US AUD/USD & AUSTRALIA-US
UNEMPLOYMENT RATES
UNEMPLOYMENT RATE DIFFERENTIAL
US Unemployment -5.0 1.14
AUD/USD (rhs)
11.0 Rate 11.0
Australia-US
-3.0 Unemployment Rate 0.99
(lhs)
9.0 9.0
-1.0 0.84
7.0 7.0
1.0 0.70
5.0 5.0 3.0 0.55
Australian Unemployment Rate
3.0 3.0 5.0 0.40
Feb-78 Feb-88 Feb-98 Feb-08 Feb-18 Feb-78 Feb-88 Feb-98 Feb-08 Feb-18
8Australia’s Domestic Economy Weak and Australia-US Rates Narrowing
US economy firming. Australia-US two-year bond spread currently at 123bpts
MARKET PRICING FOR RBA
% (30-day Interbank Futures ) Bpts
3.00 0.15
AUD/USD & AUSTRALIA-US 2.75 0.10
% TWO-YEAR BOND SPREAD
2.50 Bpts Per Meeting (rhs) 0.05
6.0 1.15
Australia-US Two-Year Bond
2.25 0.00
Spread (lhs)
4.5 1.03
Cumulative (lhs)
2.00 -0.05
3.0 0.90 1.75 -0.10
Pricing RBA Rate Cuts
1.50 -0.15
1.5 0.78
MAR 15 JUN 15 SEP 15 DEC 15 MAR 16 JUN 16
MARKET PRICING FOR FED FUNDS
% (30-day Fed Fund Futures)
0.0 0.65 2.50
150 Bpts
2.25
Pivot Level
-1.5 0.53 2.00
Market Pricing for
AUD/USD (rhs) 1.75 Fed Rate Hikes
1.50
-3.0 0.40
Mar-92 Jan-97 Nov-01 Sep-06 Jul-11 May-16 1.25
Current Fed Funds Rate
1.00
0.75
0.50
December 2015
0.25
9 0.00
Mar-15 Sep-15 Mar-16 Sep-16 Mar-17 Sep-17Forecasts – Exchange Rates
Date AUD
Period (input)
Current 0.7728
AUD/USD & TERMS OF TRADE Mar-15 0.7600
Jun-15 0.7300
136 2.00
Sep-15 0.7200
Australia Dec-15 0.7000
Terms of Trade Mar-16 0.7100
117 Index (lhs) 1.68 Jun-16 0.7200
AUD /USD (rhs)
Sep-16 0.7300
Dec-16 0.7400
98 1.36 Mar-17 0.7500
Jun-17 0.7600
Float
Sep-17 0.7800
Dec-17 0.8000
78 1.04
Mar-18 0.8200
Jun-18 0.8500
Sep-18 0.8800
59 0.72 Dec-18 0.8800
Mar-19 0.8800
Jun-19 0.8800
40 0.40 Sep-19 0.8800
Sep-59 May-71 Jan-83 Sep-94 May-06 Jan-18 Dec-19 0.8800
Mar-20 0.8800
Jun-20 0.8800
Sep-20 0.8800
Dec-20 0.8800
10Some Long-Run Considerations on Commodity Prices
REAL COMMODITY PRICES OVER THE LAST 214 YEARS
11Important Disclosures & Disclaimer
The information contained in this document is made available for persons who are wholesale clients, sophisticated investors or professional investors as defined in the
Corporations Act 2001.
This document is not to be construed as a solicitation or an offer to buy any securities or financial instruments. This document has been prepared without taking account of the
objectives, financial situation (including the capacity to bear loss), knowledge, experience or needs of any specific person who may receive this article. All recipients should,
before acting on the information in this report, consider the appropriateness and suitability of the information, having regard to their own objectives, financial situation and
needs, and, if necessary seek the appropriate professional or financial advice regarding the content of this report. The information does not purport to be a complete statement
or summary of a transaction.
Financial markets products have an element of risk. The level of risk varies depending on the product’s specific attributes and how it is used. Potential investors should note
that the product discussed is a sophisticated financial product which involves dealing in derivatives. Unless you are familiar with products of this type, this product may not be
suitable for you. The Bank will enter into transactions on the understanding that the customer has: made his/her own independent decision to enter into the transaction;
determined that the transaction is appropriate; ensured he/she has the knowledge to evaluate and capacity to accept the terms, conditions and risks; and is not relying on any
communication from Commonwealth Bank as advice.
We believe that the information in this document is correct and any opinions, conclusions or recommendations are reasonably held or made, based on the information
available at the time of its compilation, but no representation or warranty, either expressed or implied, is made or provided as to accuracy, reliability or completeness of any
statement made in this article. Any opinions, conclusions or recommendations set forth in this document are subject to change without notice and may differ or be contrary to
the opinions, conclusions or recommendations expressed elsewhere by the Bank or the wider Commonwealth Bank of Australia Group of Companies. We are under no
obligation to, and do not, update or keep current the information contained in this report. Neither the Bank nor any of its subsidiaries accept liability for any loss or damage
arising out of the use of all or any part of this article. Any valuations, projections and forecasts contained are based on a number of assumptions and estimates and are subject
to contingencies and uncertainties. Different assumptions and estimates could result in materially different results. The Bank does not represent or warrant that any of these
valuations, projections or forecasts, or any of the underlying assumptions or estimates, will be met. Past performance is not a reliable indicator of future performance.
The Bank has provided, provides, or seeks to provide, investment banking, capital markets and/or other services, including financial services, to the companies described in
the article and their associates. All material presented in this article, unless specifically indicated otherwise, is under copyright to the Bank. None of the material, nor its
content, nor any copy of it, may be altered in any way, transmitted to, copied or distributed to any other party, without the prior written permission of the Bank. In the case of
certain products, the Bank or one of its related bodies corporate is or may be the only market maker. The Bank, its agents, associates and clients have or have had long or
short positions in the securities or other financial instruments referred to herein, and may at any time make purchases and/or sales in such interests or securities as principal
or agent, including selling to or buying from clients on a principal basis and may engage in transactions in a manner inconsistent with this article.
Unless agreed separately, we do not charge any fees for any information provided in this presentation. You may be charged fees in relation to the financial products or other
services the Bank provides, these are set out in the relevant Financial Services Guide (FSG) and relevant Product Disclosure Statements (PDS). Our employees receive a
salary and do not receive any commissions or fees. However, they may be eligible for a bonus payment from us based on a number of factors relating to their overall
performance during the year. These factors include the level of revenue they generate, meeting client service standards and reaching individual sales portfolio targets. Our
employees may also receive benefits such as tickets to sporting and cultural events, corporate promotional merchandise and other similar benefits. If you have a complaint,
the Bank’s dispute resolution process can be accessed in Australia on phone number 132221 or internationally 61 2 98417000.
Produced by Commonwealth Bank of Australia ABN 48 123 123 124
12In the UK and Europe: This document is made available in the UK and Europe only for persons who are Eligible Counterparties or Professional Clients, and not Retail Clients
as defined by Financial Conduct Authority rules. The Commonwealth Bank of Australia and CBA Europe Ltd are both registered in England (No. BR250 and 05687023
respectively).
Commonwealth Bank of Australia: Authorised and regulated by the Australian Prudential Regulation Authority. Authorised by the Prudential Regulation Authority.Subject to
regulation by the Financial Conduct Authority and limited regulation by the Prudential Regulation Authority. Details about the extent of our regulation by the Prudential
Regulation Authority are available from us on request.
CBA Europe Ltd: Authorised and regulated by the Financial Conduct Authority
In Singapore: The information in this brochure is made available only for persons who are Accredited Investors or Expert Investor in terms of the Singapore Securities and
Futures Act. It has not been prepared for, and must not be distributed to or replicated in any form, to anyone who is not an Accredited Investor or Expert Investor. If you are an
Accredited Investor or Expert Investor as defined in Regulation 2(1) of the Financial Advisers Regulations ("FAR"), the Bank is obliged to disclose to you that in the provision of
any financial advisory services to you, we are exempted under Regulations 33, 34 and 35 of the FAR from complying with the business conduct provisions of sections 25
(Obligation to disclose product information to clients), 27 (Recommendations by licensees) and 36 (Disclosure of interests in securities) respectively, of the Financial Advisers
Act ("FAA").
In Japan: This document is made available only for institutional customers. Commonwealth Bank of Australia, Tokyo Branch is a licensed banking business authorized by
Japan Financial Services Agency.
In Hong Kong: The contents of this document have not been reviewed by any regulatory authority in Hong Kong. You are advised to exercise caution in relation to the offer. If
you are in any doubt about any of the contents of this document, you should obtain independent professional advice.
The provision of this document to any person in the Hong Kong does not constitute an offer of securities to that person or an invitation to that person to acquire, apply, or
subscribe, for the issue of, or purchase, securities unless the recipient is a person to whom an offer of securities may be made in Hong Kong without the need for a prospectus
under section 2 and the Seventeenth Schedule of the Companies Ordinance (Cap. 32 of the Laws of Hong Kong) (“Companies Ordinance”) pursuant to the exemptions for
offers in respect of which the minimum consideration payable by any person is not less than HK$500,000 or its equivalent in another currency. Neither this document nor any
part of it is, and under no circumstances are they to be construed as, a prospectus (as defined in the Companies Ordinance) or an advertisement of securities in Hong
Kong. The products have not been, nor will they be, qualified for sale to the public under applicable Hong Kong securities laws except on a basis that is exempt from the
prospectus requirements of those securities laws.
Minimum Investment Amount for Hong Kong Investors: HK$500,000
13In the USA: The Bank is authorized to maintain a Federal branch by the Office of the Comptroller of the Currency.
This document is made available for informational purposes only. The products described herein are not available to retail investors. NONE OF THE PRODUCTS
DESCRIBED ARE DEPOSITS THAT ARE COVERED BY FDIC INSURANCE.
This product is not suitable for investment by counterparties that are not “eligible contract participants” as defined in the U.S. Commodity Exchange Act (“CEA”) and the
regulations adopted thereunder; or (ii) entities that have any investors who are not “eligible contract participants.” Each hedge fund or other investment vehicle that
purchases the products must be operated by a registered commodity pool operator as defined under the CEA and the regulations adopted thereunder or a person who has
qualified as being exempt from such registration requirement. CBA cannot execute swaps with any US person unless our counterparty has adhered to the ISDA Dodd Frank
protocol.
This report was prepared, approved and published by Global Markets Research, a division of Commonwealth Bank of Australia ABN 48 123 123 124 AFSL 234945 (the
“Bank”) and is distributed in the United States by the Bank’s New York Branch and its Houston Loan Production Office. If you would like to speak to someone regarding
securities related products, please contact Commonwealth Australia Securities LLC (the “U.S. Broker–Dealer”), a broker–dealer registered under the U.S. Securities
Exchange Act of 1934 (the “Exchange Act”) and a member of the Financial Industry Regulatory Authority (“FINRA”) at 1 (212) 336-7737. The information contained herein is
not intended to be an exhaustive discussion of the strategies or concepts mentioned herein or tax or legal advice. Investments and strategies are discussed in this report only
in general terms and not with respect to any particular security or securities transaction, and any specific investments may entail significant risks including exchange rate risk,
interest rate risk, credit risk and prepayment risk among others. There also may be risks relating to lack of liquidity, volatility of returns and lack of certain valuation and
pricing information. International investing entails risks that may be presented by economic uncertainties of foreign countries as well as the risk of currency fluctuations.
Investors interested in the strategies or concepts described in this report should consult their tax, legal or other adviser, as appropriate. This report is not intended to provide
information on specific securities. The Bank’s New York Branch and its Houston Loan Production Office provides its clients access to various products and services available
through the Bank and its affiliates.
In the United States, U.S. brokerage products and services are provided solely by or through the U.S. Broker-Dealer. The U.S. Broker-Dealer is a wholly-owned, but non-
guaranteed, subsidiary of the Bank, organized under the laws of the State of Delaware, U.S., with limited liability. The U.S. Broker-Dealer is not authorized to engage in the
underwriting of securities and does not make markets or otherwise engage in any trading in the securities of the subject companies described in our research reports.
14You can also read