Field and laboratory investigation of rainfall-triggered slope failure in unsaturated loess soils, New Zealand
←
→
Page content transcription
If your browser does not render page correctly, please read the page content below
E3S Web of Conferences 195, 01017 (2020) https://doi.org/10.1051/e3sconf/202019501017
E-UNSAT 2020
Field and laboratory investigation of rainfall-triggered slope
failure in unsaturated loess soils, New Zealand
Katherine Yates1,*, Adrian Russell2, and Clark Fenton11
1
Department of Geological Sciences, University of Canterbury, New Zealand
2
Department of Civil and Environmental Engineering, University of New South Wales, Australia
Abstract. Shallow rainfall triggered slope failures occur frequently in loess and loess-derived deposits
across the South Island, New Zealand. These failures, which occur in both natural slopes and engineered
cuttings, impact road infrastructure, residential housing and rural land use. When dry, the loess can form
near vertical cuttings. However, with increase in moisture content loess slopes become susceptible to
shallow slope failures. To date, the influence of negative pore-water pressure (suction) on the stability of
loess slopes in New Zealand has not been well understood. In this paper, data from long term in situ field
monitoring of rainfall, suction and volumetric water content from a loess slope in Banks Peninsula,
Canterbury are presented with laboratory triaxial test results undertaken on undisturbed unsaturated loess
samples. Field and laboratory soil responses to wetting and drying are compared, and the characteristics of
rainfall events which reduce suction in situ and therefore slope stability are discussed.
1 Introduction examine the hydraulic state of loess in situ. Preliminary
findings of this ongoing research programme are
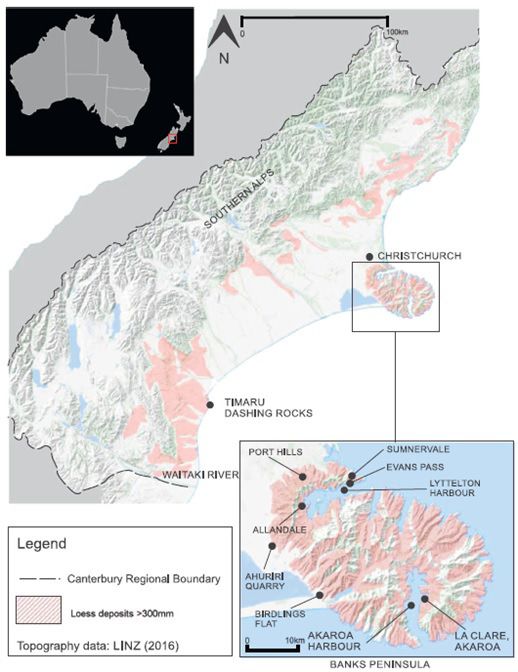
Loess and loess-derived soils (e.g., loess colluvium) are presented.
widespread across slopes in Canterbury, in the South
Island of New Zealand (Fig. 1). These Late Pleistocene
and Postglacial (Holocene) age deposits were formed by
aeolian processes and are primarily composed of silt-
sized grains [1-4]. In general, these loess deposits are
unsaturated and are sensitive to changes in moisture
content. At low moisture contents (~ 5%) cut slopes in
loess can stand near-vertical, however, the shear strength
decreases rapidly upon relatively small (2% - 3%)
increases in moisture content [5, 6]. This, along with
susceptibility of the loess to dispersion, makes the
material prone to instability upon infiltration of rainfall.
Typical mechanisms of slope failure include shallow
slides, debris flow and tunnel gullying (internal erosion)
[1, 2, 7]. Because these materials are widespread in
Canterbury, instability can be problematic for residential
development, infrastructure and rural land use. In
particular, the popular tourist area of Akaroa Harbour on
Banks Peninsula (Fig. 1) has frequent instability issues
due to a higher average annual rainfall than the
surrounding Canterbury Plains. Previous research on
Canterbury loess has provided limited review of the
behaviour of the material as an unsaturated soil [6].
The purpose of this paper is to provide an overview
of current research into the unsaturated characteristics of
loess from Akaroa Harbour, Canterbury. This research
includes triaxial testing and laboratory characterisation
of the soil-water characteristics of Canterbury loess.
Fig. 1. Distribution of loess across Canterbury, New Zealand
Data from long-term field instrumentation of a natural
[6].
loess slope is presented alongside laboratory data to
*
Corresponding author: katherine.yates@pg.canterbury.ac.nz
© The Authors, published by EDP Sciences. This is an open access article distributed under the terms of the Creative Commons Attribution License 4.0
(http://creativecommons.org/licenses/by/4.0/).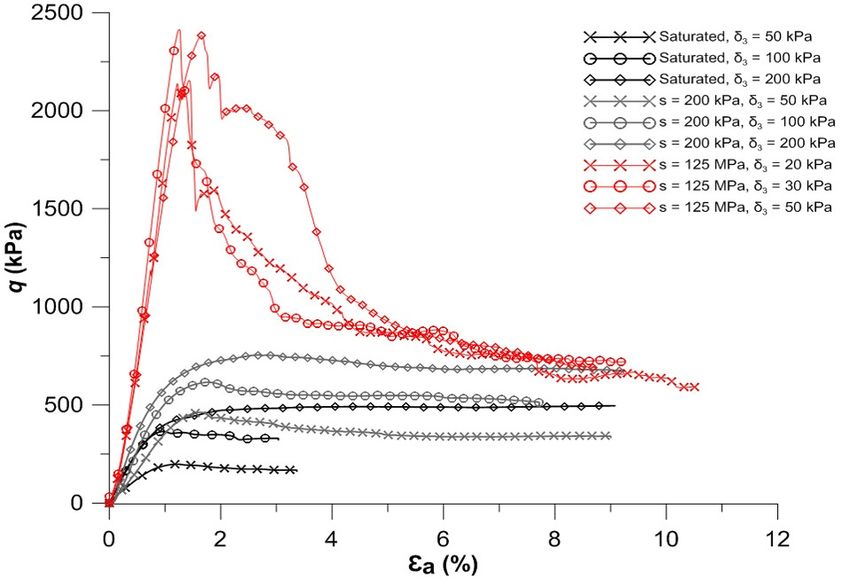
E3S Web of Conferences 195, 01017 (2020)                                                        https://doi.org/10.1051/e3sconf/202019501017
E-UNSAT 2020

       2 Laboratory testing of Akaroa Loess                             shearing. The selected strain rate was determined from
                                                                        consolidation testing of saturated intact and remoulded
                                                                        specimens.
       2.1 Index properties                                                 Fig. 3 presents shear strength data for saturated and
       Akaroa loess is classified as low plasticity clay                unsaturated samples. Suction values for unsaturated
       according to the Unified Soil Classification system.             specimens were 200 kPa and 125 MPa (at natural
       Index properties are listed in Table 1, and the particle         moisture content of 3%). 200 kPa suction was applied to
       size distribution curve is shown in Figure 2.                    specimen post-saturation using the axis translation
                                                                        technique and a High Air Entry porous disk (1500 kPa
                                                                        capacity). Unsaturated specimens were sheared under
                                                                        constant suction.
                                                                            Specimen at natural moisture content were sheared
                                                                        without pre-test saturation or application of suction.
                                                                        Suction in the specimen was measured to be 125 MPa
                                                                        prior to the test. The purpose of testing at natural
                                                                        moisture content was to examine the deformation
                                                                        behavior of the loess found in situ at low moisture
                                                                        contents and high suction values. Confining pressures for
                                                                        specimen where suction was 125 Mpa were required to
                                                                        be lower than that for specimen where suction was 200
                                                                        kPa due to limitations to the axial load transducer in the
                                                                        triaxial.
                                                                            Triaxial test results (Fig. 3) indicate an increase in
                                                                        shear strength of the soil relative to increase in suction.
                                                                        When suction is 125 MPa failure was brittle, and similar
                                                                        to failure of soft rock. Less than 6 % volumetric
       Fig. 2. Particle size distribution curve for Akaroa Loess.       compression was recorded for each test.

              Table 1. Index properties of Akaroa Loess.
                 Property                        Value
                                 3
            Dry Density(g/cm )                     1.6
             Liquid Limit (%)                     24.8
             Plastic Limit (%)                    17.2
              Plasticity Index                     7.6
             Specific Gravity                     2.78
            Gravel Content (%)                      0
             Sand content (%)                     16.0
             Fines content (%)                    84.0                  Fig. 3. Deviator stress (q) vs. axial strain (εa) from triaxial
             Clay fraction (%)                    19.3                  testing on intact Akaroa Loess.

        Unified Soil Classification                CL
                                                                        2.3 Soil-water characteristic curve
       2.2 Triaxial testing
                                                                        The soil water characteristic curve (SWCC) of the loess
       A series of isotropically-consolidated, drained triaxial         was determined using the pressure plate test (ASTM
       tests were conducted on saturated and unsaturated intact         D6836-16) and the WP4C soil potential (dew point)
       loess specimen. A modified Bishop Wesley device was              apparatus. Remoulded samples of loess were prepared
       used for both saturated and unsaturated triaxial testing.        for both test methods by tamping moisten material to a
       Intact specimens were hand-carved from block samples             dry density of approximately 1.6 t/m3 (e = 0.69) to
       extracted from a road cutting near the field                     represent densities observed at the field instrumentation
       instrumentation site in Akaroa Harbour. Block samples            site.
       were extracted from the site using hand tools and then               Remoulded specimen prepared for the pressure plate
       shaped with a hand saw and fine sand paper to 50 mm              test were saturated by soaking in a de-aired water
       diameter and 100 mm height.                                      overnight prior to commencing the test. Two High Air
           All specimens were sheared at a strain rate of 0.004         Entry plates (300kPa and 1500kPa air entry value) were
       mm/min to allow dissipation of pore pressures during             used to obtain a wide range of suction values. Prior to

                                                                    2
E3S Web of Conferences 195, 01017 (2020) https://doi.org/10.1051/e3sconf/202019501017
E-UNSAT 2020
commencing the test, the dimensions of each specimen installation and lack of required ongoing maintenance. A
were recorded to allow observation of volumetric change TB3 tipping bucket rain gauge from Hydrological
with changes in suction. Two remoulded samples were Services Pty Ltd was installed at ground surface to
removed at each pressure stage for destructive testing. measure local precipitation. All instrumentation,
A WP4C device (Decagon Devices Ltd) was used to including the data logger (Campbell Scientific CR1000)
determine the soil water characteristic curve for suctions were powered by solar panel and one rechargeable deep
above 1379 kPa. The apparatus uses a chilled-mirror to cycle battery.
measure total suction within the sample. Immediately Each CS616 sensors were installed in direct contact
after suction is measured, the sample is measured for with the in situ soil at the base of individual machine
volumetric change and then dried to determine the augured holes. A similar installation method was applied
moisture content. For these tests, osmotic suction was to the MPS-6 sensors however each sensor was encased
assumed to be negligible. in saturated remoulded loess prior to lowering down the
Because the loess soil in Akaroa has a fractal particle auger hole. This was undertaken to ensure good contact
size distribution, a SWCC relationship can be clearly between the sensor and soil. Holes were backfilled with
established by presenting both pressure plate and dew compacted soil extracted from the site. Probes were
point test results in log(Sr) – log(s) plane (Figure 4) [8, arranged in four arrays comprised of three MPS-6
9]. Results from both laboratory test methods correlate sensors and three CS616 sensors. MPS-6 and CS616
well across the range of suctions tested. The main drying sensors were installed in pairs at approximately 0.5m,
curve and top scanning line are identified from Fig. 4. 1.0m and 2.0m deep to observe the wetting front through
The slope of the top scanning line is a representation of the soil (Fig. 5, Fig. 6). The probes were installed in
the slope of other scanning lines down the SWCC. October 2017 and removed in May 2019.
A selection of the monitoring data is presented in
Fig. 7 and 8. This shows the hydrological response
recorded onsite over January and February 2018 (Austral
Summer). This section of data is presented because it
provides an example of the loess in situ undergoing
prolonged periods of drying in between two rainfall
(wetting) events. Suction measurements reached the
highest (~5MPa) during these months, and
correspondingly the VWC the lowest (~11%).
Fig. 4. Log(s) vs. Log(Sr) plot of laboratory testing data for
SWCC for remoulded Akaroa loess where e=0.69, including
interpretation of main drying and top scanning curve.
Fig. 5. Cross section schematic of one array of probes installed
on site.
3 Field Instrumentation
To examine the unsaturated behaviour of loess in situ, a
field instrumentation programme was conducted in a
natural loess slope in Akaroa Harbour. The monitoring
system was installed for an 18-month period to measure
matric suction, volumetric water content and rainfall.
The site selected for instrumentation is a grassed, north-
facing 15° slope adjacent to a historic gully erosion
feature (downslope) and recent shallow instability
(upslope hummocky ground).
Volumetric water content (VWC) was measured
using 12 Campbell Scientific CS616 water content
reflectometers. These were calibrated in the laboratory
prior to deployment. Matric suction was measured
indirectly using 12 Decagon MPS-6 devices which were Fig. 6. Plan view schematic of probe installation including four
arrays and solar panel.
calibrated by the manufacturer for drying only. These
devices were chosen for their durability for long-term
3E3S Web of Conferences 195, 01017 (2020) https://doi.org/10.1051/e3sconf/202019501017
E-UNSAT 2020
a) a)
b) b)
c) c)
Fig. 7. Suction measurements between 1 January 2018 to 28 Fig. 8. Volumetric water content measurements between 1
February 2018 from monitoring site in Akaroa Harbour. (a) January 2018 to 28 February 2018 from monitoring site in
0.5m depth, (b) 1.0m depth, (c) 2.0m depth. Akaroa Harbour. (a) 0.5m depth, (b) 1.0m depth, (c) 2.0m
depth.
4E3S Web of Conferences 195, 01017 (2020) https://doi.org/10.1051/e3sconf/202019501017
E-UNSAT 2020
Climatic processes, including evapotranspiration, air
humidity and temperature, are attributed to the drying of a)
the loess over this time. Although general wetting and
drying trends are comparative between CS616 and MPS-
6 sensors, there is some discrepancy in between the data
sets that may be attributed to localized variation in
exposure to hydraulic processes. Some fluctuation in the
MPS-6 data at 0.5 – 1.0 m depths is due to intermittent
interference recorded on site.
Two major rainfall events occurred on 5 January
2018 and 20 February 2018 (ex-tropical cyclone Gita)
caused significant reduction in suction to < 50kPa and
correspondently VWC increased to 18%-21%.
Characteristics of these rainfall events are detailed in
Table 2. Changes to the hydraulic state of the deeper
loess (> 1.0 m) was less pronounced than that recorded
by the shallower probes (~0.5m) due to less exposure to
meteorological influences. Several minor rainfall events
occurred during this period, however these did not result
in a change in the hydraulic path of the material.
Between 1 January to 28 February 2018 the loess on site
remained in an unsaturated state up to 2m depth despite b)
infiltration from recorded rainfall events.
Table 2. Characteristics of major rainfall events.
5 January 20 February 2018
Property
2018 (ex-cyclone Gita)
Duration (hrs) 21 35.3
Max. Intensity
14.4 9.6
(mm/hr)
Total rainfall (mm) 48.2 118.2
4 Comparison between laboratory and
field data
In situ field monitoring of a loess slope and laboratory
testing of the SWCC for Akaroa loess can be used to
examine the unsaturated behaviour of the material. c)
Drying data recorded between 1 January 2018 and 28
February 2018 from field instrumentation is presented
with laboratory SWCC to examine the hydraulic
behaviour of in situ loess (Fig. 9). Wetting data was not
included due to the lack of reliability in the MPS-6
measurements. Comparison between the data sets
indicate that the hydraulic state of the loess remained on
one of the scanning lines during periods of drying and
never reached the main drying curve of the SWCC.
To examine agreement between the laboratory
scanning line and the field scanning line, the slope of the
top scanning line is replicated nearer to the field data. As
the depth (m) of the recorded field data increases, the
hydraulic state of the loess is positioned towards the
‘wetter end’ of the scanning line. With depth, agreement
between the slope of the scanning line and the field data
also increases. Localised variation in particle size
distribution and density of the soil < 0.5 m may lead to Fig. 9. Overlay of field monitoring data on laboratory testing
variation in the scanning line slope observed on site. data, (a) 0.5m deep probes, (b) 1.0m deep probes, (c) 2.0m
deep probes.
5E3S Web of Conferences 195, 01017 (2020) https://doi.org/10.1051/e3sconf/202019501017
E-UNSAT 2020
Noticeably, the wetter field data located on the Zealand Journal of Geology and Geophysics, 1964.
scanning curve does not appear to reach the main 7(January 2015): p. 811-838.
wetting curve. Possible reasons for this may be that the 4. Ives, D., Nature and distribution of loess in
main wetting curve is located at a different location to Canterbury, New Zealand. New Zealand Journal of
that of what is implied from the laboratory test data. Geology and Geophysics, 1973. 16(3): p. 587-610.
Alternatively, the hydraulic state of loess in situ may
5. Hughes, T.J., A Detailed Study of Banks Peninsula
remain on a scanning curve when exposed to continuing
Shear Strength. 2002.
climatic changes. Further work is required to understand
this behaviour. 6. Yates, K., C.H. Fenton, and D.H. Bell, A review of
Typical modes of shallow instability in the loess can the geotechnical characteristics of loess and loess-
be explained by examining both field and monitoring derived soils from Canterbury, South Island, New
data. It was observed from the field monitoring data that Zealand. Engineering Geology, 2018. 236: p. 11-21.
the largest variation in the hydraulic state of the loess 7. Hutchinson, G., Akaroa Harbour suffers extensive
was within the upper ~1.0 m. More importantly, this earth movements. Soil & Water, 1975. 12: p. 6-7.
upper layer underwent the greatest reduction in suction 8. Russell, A.R., How water retention in fractal soils
upon rainfall infiltration. As it is shown the shear depends on particle and pore sizes, shapes, volumes
strength of the loess decreases with decrease in suction, and surface areas. Géotechnique, 2014. 64(5): p.
shallow failure mechanisms (< 1 m) can be expected. 379-390.
9. Russell, A.R. and O. Buzzi, A fractal basis for soil-
4 Conclusions water characteristics curves with hydraulic
hysteresis (Technical Note). Géotechnique, 2012.
Field instrumentation and laboratory testing has been 62(3): p. 269-274.
conducted to examine the unsaturated characteristics of
loess in New Zealand. This paper examines some of the
data collected during this study. As expected, triaxial
testing on saturated and unsaturated specimen indicate
an increase in shear strength with increase in suction.
Due to an observed reduction in suction that occurs upon
infiltration of rainfall, it is expected that the stability of
the loess will reduce particularly in the upper 0.5 m of
the loess profile. Research is ongoing to further quantify
the effect of suction on loess slope stability.
Comparison between laboratory data and drying data
from field instrumentation showed that the hydraulic
state of the loess during January and February 2018
remained on one of the scanning lines. The main drying
and wetting lines were not reached during this period.
Good agreement was observed between the slope of the
laboratory scanning line and the slope of the field
scanning line.
Acknowledgements
The authors acknowledge the contribution of Environment
Canterbury (ECan) and University of Lincoln to this research.
References
1. Bell, D.H., P.J. Glassey, and M.D. Yetton. Chemical
stabilisation of dispersive loessical soils, Banks
Peninsula, Canterbury, New Zealand. in 5th
International IAEG Congress. 1986. Buenos Aires,
Argentina.
2. Bell, D.H. and B.B. Trangmar. Regolith materials
and erosion processes on the Port Hills,
Christchurch, New Zealand. in 5th International
Conference and Field workshop on Landslides.
1987. Christchurch, New Zealand.
3. Raeside, J.D., Loess Deposits of the South Island,
New Zealand, and Soils Formed on them. New
6You can also read