Correlation between corona current and radio interference due to high voltage
←
→
Page content transcription
If your browser does not render page correctly, please read the page content below
Correlation between corona current and radio interference due to high voltage
insulator string
Subba Reddy B Udaya Kumar Debasish Nath
Senior Member, IEEE Dept of Electrical Engg Dept. of Electrical Engg
Dept. of Electrical Engg, Indian Institute of Science Indian Institute of Science
Indian Institute of Science Bangalore- 560012, INDIA Bangalore-560012, INDIA
Bangalore-560012, INDIA uday@hve.iisc.ernet.in nath@ee.iisc.ernet.in
reddy@hve.iisc.ernet.in
Abstract -- The Radio Interference (RI) from electric power individual corona discharges typically possess a rise time
transmission line hardware, if not controlled, poses serious measurable in 10s of ns, which is followed by a slow tail
electromagnetic interference to system in the vicinity. The measured in 100s of ns. A several discharges are produced in
present work mainly concerns with the RI from the insulator every half cycle of the power frequency voltage and there
string along with the associated line hardware. The laboratory could be several sites producing corona and the noise
testing for the RI levels are carried out through the measurement
generated has considerably wide frequency spectrum. The RI
of the conducted radio interference levels. However such
measurements do not really locate the coronating point, as well level is high in the broadcast frequency range (0.5-1.6MHz)
as, the mode of corona. At the same time experience shows that it and then decreases gradually at higher frequencies [1].
is rather difficult to locate the coronating points by mere Detailed studies of corona current characteristics have shown
inspection. After a thorough look into the intricacies of the that positive corona is the main source of radio noise from
problem, it is ascertained that the measurement of associated transmission line [1].
ground end currents could give a better picture of the prevailing
corona modes and their intensities. A study on the same is C. Consequence of radio noise: The Radio Interference (RI)
attempted in the present work. Various intricacies of the from electric power transmission line hardware, if not
problem, features of ground end current pulses and its controlled, poses serious electromagnetic interference to
correlation with RI are dealt with. Owing to the complexity of
such experimental investigations, the study made is not fully
system in the vicinity [2,3]. Also, in future, if the transmission
complete nevertheless it seems to be first of its kind. lines are to be employed for general communications, it
becomes imperative to limit the corona generated
Index Terms--Radio interference, corona, high voltage electromagnetic noise [4-6].
transmission, insulators, conductor hardware, corona current. With regard to the transmission lines, the sources of RI are
both line conductors and the line hardware including the
I. INTRODUCTION insulator strings [8]. The present work mainly concerns with
the insulator string along with the associated line hardware.
A. Sources of corona on line conductors and hardware
The existing standards have two tests pertaining to RI and
The local electric breakdown of air or the corona is quite
corona. First one involves measurement of conducted RI
common on the high voltage power transmission line
through suitable circuit configuration and a radio noise meter.
hardware. The operating stress is ideally lower than the
The second one involves identification of onset a visual
corona inception levels, however, due to some manufacturing
corona, which is relatively subjective.
defects, damages caused during the transportation and
installation, deposition of contaminants like dust particles or
D. Associated standard: Hence, governing standards have
water droplets etc. the local field can get significantly
prefixed upper limits for radio interference levels from
intensified. As a result, the corona can occur on line
different components of high voltage transmission lines [2].
conductors, nuts and bolts of the hardware, arcing horns,
For convenience, the laboratory testing for the RI levels are
guard rings, suspension clamps, etc. Also, since the
carried out through the measurement of the conducted radio
conductors and tie-wires with the tops of the insulator; and
interference levels [2,7,12].
the pins with the entire surface of the thread in the pin holes,
do not make perfect electrical contacts, corona may occur in
E. Problem identification
the intervening air gaps.
The RI measurement does not really locate the coronating
point, as well as, the modes of corona. At the same time
B, The generation mechanism of Radio noise
experience shows that it is rather difficult to locate the
Radio noise in High Voltage transmission line is associated
coronating points by mere inspection. The associated
with the pulsating modes of corona discharges developing at
geometry involves both highly localized field intensification
the line conductor and hardware, sparking resulting from poor
points, as well as, relatively extended moderate field
electrical contact and scintillations on the contaminated
intensification points. This in turn leads to both point corona
insulator surfaces. The current pulse associated with
and a diffuse corona to start with, which later transform into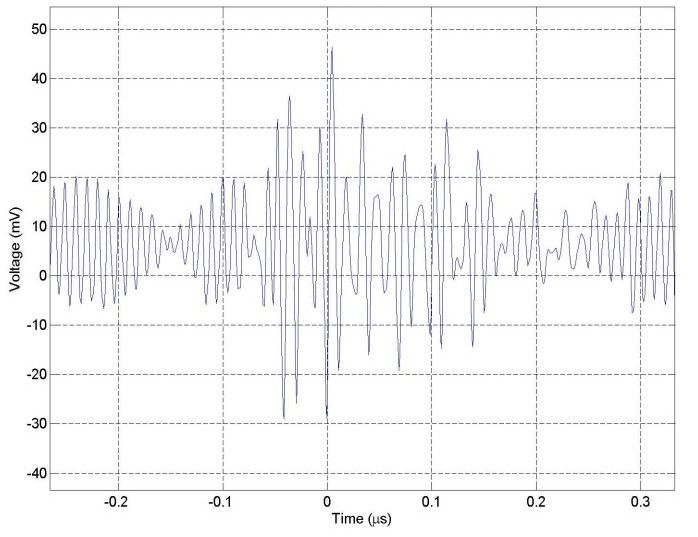
corona streamers at high field points. In other words, different B. Radio Interference Measurements
modes of corona like burst, glow and streamer all will be The International Standard [2] specifies the procedure for a
onset as the test voltage is increased. After a thorough look radio interference (RI) test carried out in a laboratory on
into the intricacies of the problem, it is ascertained that the clean and dry insulators at a frequency of 0,5 MHz or 1 MHz
measurement of associated ground end currents along with the or, alternatively, at other frequencies between 0.5 MHz and 2
resulting conducted noise could give a better picture of the MHz. The frequencies of 0.5 or 1 Mhz are preferred because,
prevailing corona modes and their intensities. This forms the usually the level of radio noise at this part of the spectrum and
basic objective of the present work. It is worth mentioning also because 1 MHz lies between the low and medium
here that the literature addressing the above stated problem is frequency radio broadcast bands.
hard to find and hence the present work can be considered as As per the standard [2], the measuring apparatus, as per the
one of the first attempts in this area. specification of CISPR 16-1, has been currently used for the
RI characteristics of insulators.
The voltage is gradually applied in steps, to reach a value
II. PRESENT WORK of 90 kV (15% above phase voltage), held for at least five
In the intended experimental approach, on the minutes, to allow RIV phenomenon to stabilize. Then, voltage
application of voltage to the insulator string both resulting is reduced slowly in steps. The radio noise generated by the
radio noise and ground end currents are to be measured. With insulator string is observed. Three such cycles are repeated,
regard to the ground end current it can be conveniently and RIV in dB (above 1 mV) at different voltages is recorded
measured indirectly by measuring the voltages. for four insulator strings. The experiments were repeated at
least five times to check for repeatability.
A. Details of experimental investigations
Experimental arrangement commonly used test circuits for C. Current Measurements
measuring radio interference are those recommended by IEC The corona current in principle is measurable at two ends
and NEMA. For the present work the IEC circuit shown in of the string i.e. from high voltage end and from ground end.
Figure 1 is employed. The main components of the circuit are Of course, for very accurate measurements, optical link
high voltage source (50 Hz, 150 kV, 300 kVA transformer between measuring system and the oscilloscope would be
with primary voltage of 230/440 V and with a rated essential. At present, due to the non-availability of such a
continuous current of 2A), low pass filter which can be tuned system at our laboratory, conventional method is only
to the required frequency, high voltage bus end terminations, employed. The current is indirectly sensed by measuring the
coupling capacitor (0.00161 F realised by two units of voltage across a 50 Ω resistor connected at the ground end. It
0.00322 F of GE make connected in series), measuring applies to both the ground end lead of insulator string, as well
impedance (R1=265 , R2=50 and L=2.2 mH) and radio as, the input to RIV meter as indicated in the figure. However,
noise meter type SMV 11, VEB Messelektronik Berlin make for safety purpose, in the ground end lead of insulator string a
is used for the measurements. The input voltage to the high resistance 5 kΩ is also inserted. However, before
transformer is 400 V two phase ac. The testing arrangement is proceeding further on measurement, the following needs to be
so designed to be simpler for operation and all the necessary discussed.
precautions have been incorporated for proper safety and The corona current pulses are known to have short front
protection with essential tripping arrangements. The test durations measured in 10s of ns. As a consequence, their
object consisted of 9-disc insulators(132kV system) and the propagation characteristics would be more like waves on
test voltage was 85kV. antenna rather than classical circuit domain pulses and
further, their propagation is not governed by the applied
voltages. A very similar situation prevails with the
measurement of partial discharge pulses in high voltage
power apparatus and cables. Therefore, the quantity measured
at any given point on the circuit need not be and will not be
the actual corona current pulse generated at the source.
Nevertheless, owing to the linearity of the system for such
pulses, measured current should be directly related to the
corona pulse at the generation point.
Amongst the two possible current measurement points, the
investigation is started with measuring the current at the input
to RIV meter. The reasons for the same are as follows. Firstly,
the reference value as per prevailing standards, the RIV
measurement as per the prescribed circuit is the testing
Fig. 1. RIV Measuring circuit as per IEC [2] augmented with ground end method and therefore, the current coupled through the RIV
current measurement
coupling capacitor governs the test result. Therefore, it would
The details of the parameters measured are as follows: be prudent first to consider this current and study whether
intended identification of coronating source could be carriedout. Secondly, as mentioned before, the corona pulse will infrequent values at the higher end. There seems to be a good
propagate on ground lead in an antenna mode and hence correlation between the most frequent values and the RIV
several reflections and attenuation can be expected in the path levels.
of the ground lead which has several bends and runs along
supporting steel frame. It will therefore be quite involved to IV. SUMMARY AND CONCLUSIONS
correlate the signal strength at the RIV input. Considering The practical RI measurement does not really locate the
these, first the input to the RIV meter itself is considered for coronating point, as well as, the modes of corona on insulator
its characteristics. string and associated hardware. This work proposed the
measurement of ground end currents to possibly aid the
III. EXPERIMENTAL RESULTS identification of types of corona involved. The experimental
A. Some observations on the waveshape of measured current investigation carried out indicated the difficulties arising out
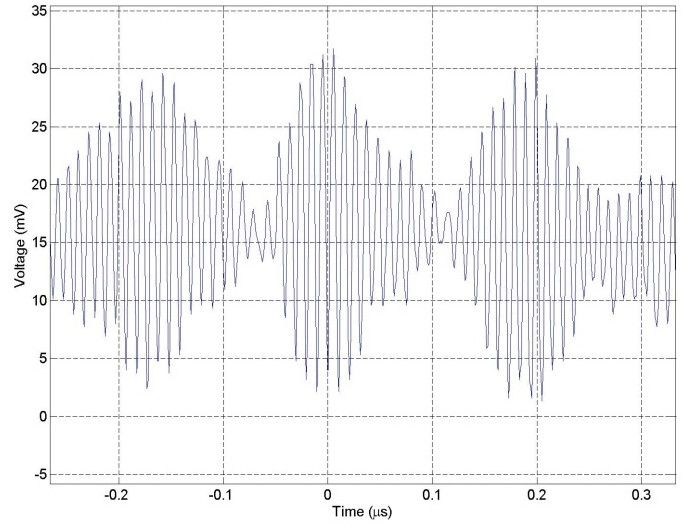
Sample voltage waveforms at the RIV input is presented in of noise due to radio and communication signals, distortion of
figure 2. To verify whether a small surface abrasion such as the corona current pulse along the path to ground and
bird droppings or collection of conducting dust can existence of simultaneous sources of corona on the test
significantly alter the noise levels, a contour of GI wire is specimen. Based on the distinct features of ground end
placed firmly on the surface (using tape) around the cap currents, an attempt is made to at least identify two kinds of
region (with a physical contact to the cap). The results with corona sources. Also, a correlation is shown to exist between
and without this GI wire loop is categorized by with defect in the most frequent peak to peak values of ground end currents
the figures. Due to the strong influence of local radio and the radio interference levels. Even though the present
broadcasting stations and other communication towers, there study made is not fully complete it is opined that it is first of
was a consistent background noise measuring peak-to-peak its kind.
amplitude of less than 10 – 20 millivolts. The same can be
seen in figures 2 & 3. There are several types of waveforms REFERENCES
that could be seen, however, two kinds of waveforms were [1] Transmission line reference book 345kV and above, published by
very frequent. They have been shown in figure 2 as type 1 and EPRI Palo Alto, CA 94304, 1979.
2. The type1 waveform has initial high frequency oscillations [2] IEC 60437, Radio Interference test on high voltage insulators, 1997.
(caused by the corona pulse initiated travelling waves on the [3] IEEE Std 539, IEEE standard definitions of terms relating to Corona
and Field effects of overhead power lines, 1990.
system), which is followed by the lower frequency [4] Sharma Maruvada and Giao Trinhn, “ A basis for setting limits to
oscillations. The excitation of the low frequency oscillations Radio interference from high voltage transmission lines”, IEEE Trans
can be attributed to the 1 MHz tuned filter at the source end on PAS, Vol PAS 94, Sept/Oct 1975, pp 1714-1724.
and the coupling capacitor of the RIV arm. The inductor at [5] P Sharma Maruvada, “ Electrostatic field effects from HV power lines
in substations”, CIGRE session Paris, Aug 25 th – 2nd Sept 1976.
the low voltage arm of RIV part may not be participating [6] E R Taylor, VL Chartier, DN Rice “Audible Noise and Visual Corona
much due to the existence of parallel relatively low strength from HV and EHV Transmission Lines and Substation”, IEEE
resistive branch. The excitation of the low frequency Transactions on Power Apparatus and Systems, Vol. PAS 88, No.5,
oscillation is expected due to a surface discharge on the May1969, pp-666-679
[7] IEEE Std 187, IEEE Standard on Radio Receivers, 1990.
insulator (porcelain disc and supporting insulating surface of [8] J Golinski et al, “Measurements of RIV on large EHV apparatus in HV
the source side tuned filter). laboratory”, IEEE Trans on PAS, Vol. PAS-98, No.3, May/June 1979,
On the other hand, the type 2 waveform is attributed to the pp 817-822.
conductor to air type discharges, which on average is found to [9] E.V. Atta, E.L. White, "Radio Interference from line insulators", Trans
AIEE, pp 1-5, 1930
have lower magnitude and much shorter duration. Study is [10] Luigi Paris, Mario Sforzini, "RI problems in HV line design, IEEE
being continued to further ascertain the above identification Transactions on Power Apparatus and Systems, Vol. PAS-87, No. 4,
of the source. April 1968.
[11] P. Sarma Maruvada, N. Giao Trinh, "A basis for setting limits to radio
B. Correlation between the radio noise and averaged peak interference from high voltage transmission lines", IEEE Transactions
on Power Apparatus and Systems, Vol. PAS-94, No. 5,
amplitude of corona generated current September/October 1975.
It is evident from the earlier sections that the actual corona [12] IEEE Radio Noise Subcommittee Report – Working Group No. 3,
generated pulse will be extremely difficult to be measured on "Radio noise design guide for high voltage transmission lines", IEEE
any high voltage test system for RIV level. As explained Transactions on Power Apparatus and Systems, Vol. PAS-90, No. 2,
March/April 1971.
earlier, the corona pulse induces the waves in the system and [13] Soliman El Debeiky and Mohammad Khalifa, " Calculating the corona
due to linearity of the system, possesses a direct correlation pulse characteristics and its radio ineterference", IEEE Trans on PAS
with respect to the measurable current at the ground end. The Vol. PAS-90, No.1,pp 165-179, Jan/Feb 1971.
ground end current waveforms at the RIV coupling capacitor
(measured through the voltage across a 50 Ω resistor) and
RIV levels are compared in table 1. It is worth noting here
that the amplitude of the waveforms at any voltage level is not
the fixed one. Measured peak to peak values vary from lower
level to higher levels. However, for the tabulation, only the
most frequently observed values are given along with someTable 1. Comparison of measured RIV levels and peak
to peak voltage (current Χ 50 Ω) levels
Voltage RIV(dB) Most frequently Less
(kV) measured voltage levels frequently
(mV)p-p measured
voltage levels
(mV)p-p
forward backward
40** 19-20 100
50 26-27 132-140 94-122
60 31-31.5 134-146 136-180 152
70 36-36.5 184-230 170-200 190-230
75/76 37-37.5 238 180-236 260 – 300
80 39-39.5 244 236-250 300+ - 400
** This correspond to ambient noise, which exhibits some fluctuations
Fig. 2(c) 90 kV type 1 with defect
Fig.2(a) 80 kV type 1 with defect
Fig. 2(d) 85 kV type 1
Fig.2(b) 85 kV type 1 with defect
Fig.2(e) 85 kV type 2 with defectFig.2(f) 90 kV type 2 with defect
Fig.3(a) 85 kV with defect
Fig.2(g) 85 kV type 2
Fig.3(b) 90 kV with defect
Figure 3. Sample measured voltage(current Χ 50 Ω) waveforms
at the ground end lead of insulator string
Fig.2(h) 90 kV type 2
Figure 2. Sample measured voltage (current Χ 50 Ω) waveforms
at the input to the RIV meterYou can also read