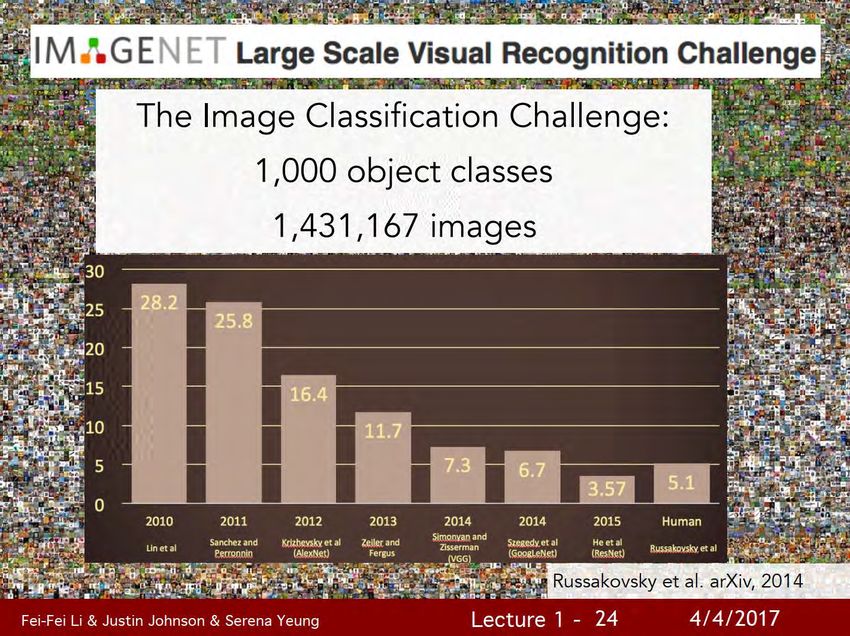
Deep-Learning for the observation of marine/terrestrial life - Marc Chaumont - Fondation pour la recherche sur la biodiversité
←
→
Page content transcription
If your browser does not render page correctly, please read the page content below
Deep-Learning for the
          observation of
       marine/terrestrial life

Marc Chaumont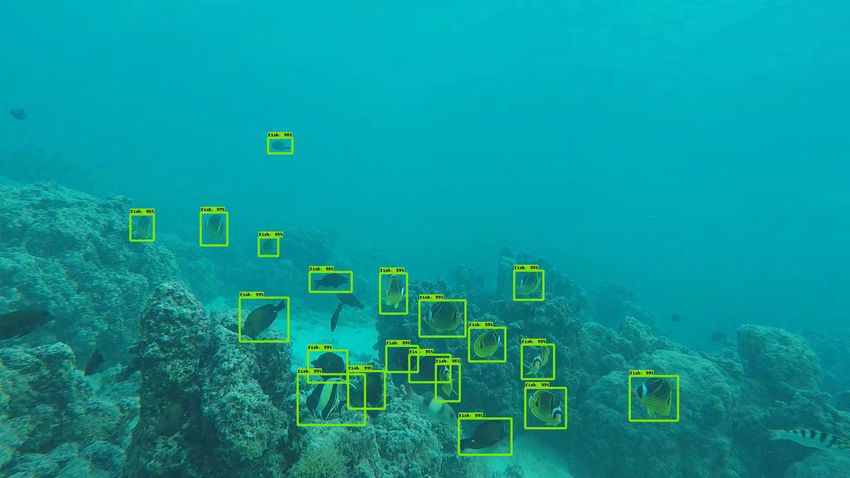
Eels
       Fish Localization / Identification     detection
                            Shark                Species
                               localization   classifications

                            under DCP
                            with multiple
Poverty prediction          cameras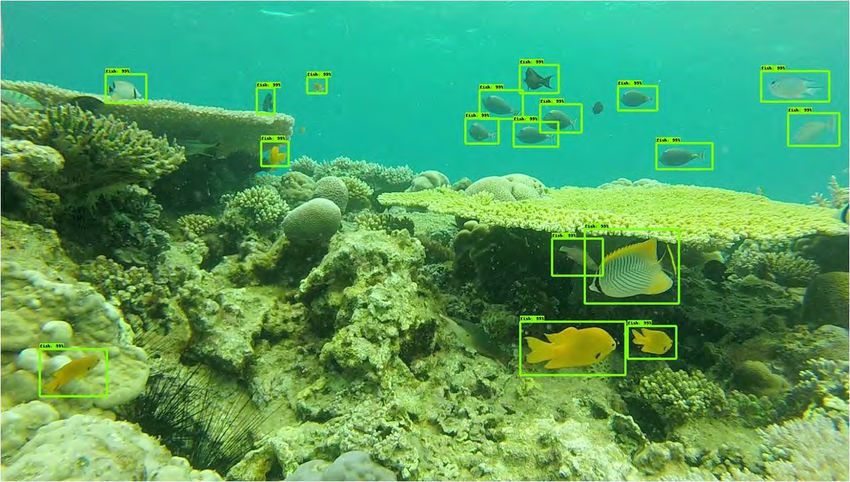
LIRMM researchers involved

Gérard Subsol                         Marc Chaumont

Working on several applications of    Steganography and more generally image
2D and 3D image processing.           and video processing

Computer science, image processing,   Image and video processing, Deep Learning,
modelling                             Data-Mining.
LIRMM (14 min from here)
Buildings

Historical building               New building
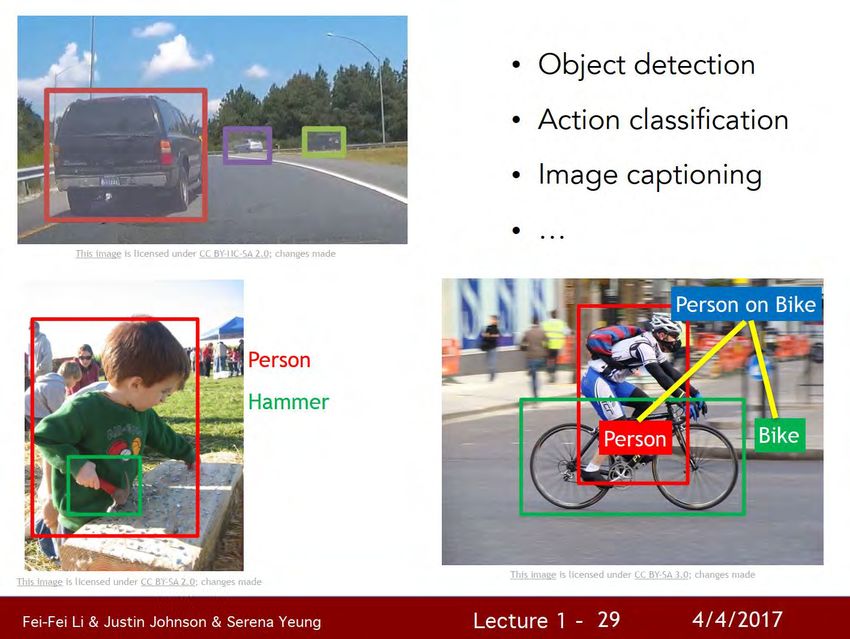
Outline
• Few words on Deep Learning

• Few projects done in our « subset »-team
   (Gérard and me)
ns
The learning protocol
(supervised case)
• STEP 1) We « show » to the « network »
exemples et counter-exemples
THE LEARNING
fish
fish
Un réseau deep
other
other
• STEP 2) We use the network 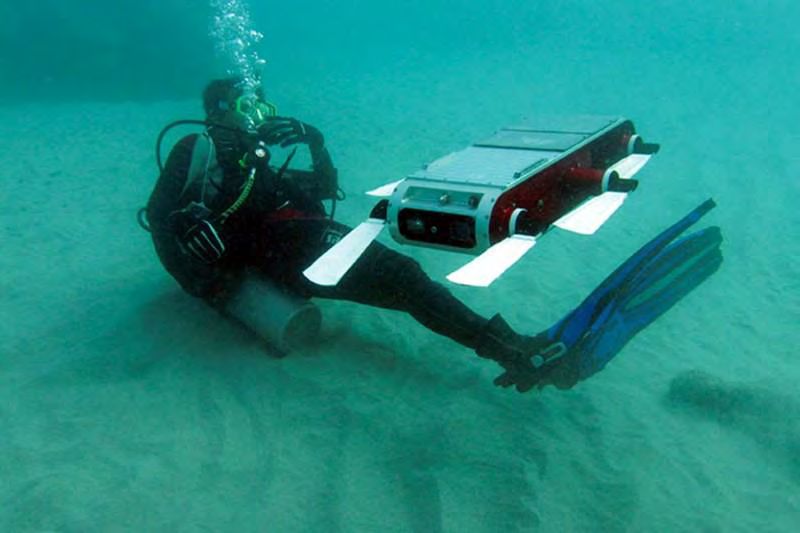
A CNN
 Convolutional Neural Network
  Average or max [+ sub-sampling]
                 normalisation

convolutions
                  Non linear function
                 (= activation function)
Outline • Few words on Deep Learning • Few projects done in our « subset »-team (Gérard and me)
Eels
       Fish Localization / Identification     detection
                            Shark                Species
                               localization   classifications

                            under DCP
                            with multiple
Poverty prediction          cameras
Counting and identification of species
• Manual studies: costly in time and resources, non-reproducible,
limited...
• Solution: Methods based on video acquisition
Gérard Subsol
Sébastien Villon,
David Mouillot, Sébastien Villeger, Thomas ClaverieLocalization / identification (D. Mouillot, S. Villeger, T. Claverie, S. Villon, G. Subsol, M. Chaumont) Video analysis allows: - to increase the volume of recovered data, - to verify and compare the results, - to overcome human physical limitations.
Localization / identification
(D. Mouillot, S. Villeger, T. Claverie, S. Villon, G. Subsol, M. Chaumont)
How much is it reliable?
(D. Mouillot, S. Villeger, T. Claverie, S. Villon, G. Subsol, M. Chaumont)

                          Let us compare !
  9 species

  The Human                     VERSUS               The Machine

           20 minutes /                                    GoogleNet
           Human                                    (trained on 20 species)

            14 Humans
Result
95
% of 90
individuals
correctly 85
identified
80
GoogleNet Humains
The machine is 6% more accurate and 100 times faster
Villon, Sébastien, et col. "A Deep learning method for accurate and fast identification of coral reef fishes in underwater
images.” Ecological informatics 48 (2018).Can we really trust the results?
Output scores on a test set
Scores
output by
the network
Case where it is a Case where it is
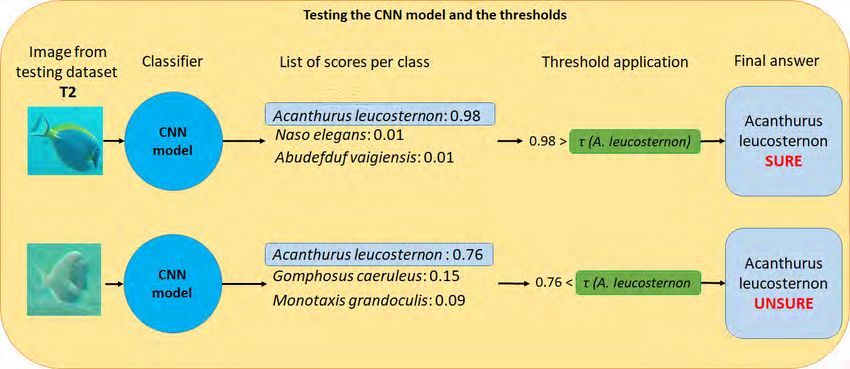
correct classifications an incorrect classificationA possible solution The post-processing: The network can: - predict a species, -or can refuse to predict (“unsure class”)
Results
No post-processing
Objective n°1:
Keep correct
classification
maximum
Objective n°2:
Minimize the
incorrect
classification
                                Ratio (%)

                     Correct classification

                     Incorrect classification

                           « Unsure »           21
New project (in continuity)
OBJECTIVE:
- Better detection,
- Size estimation,
- 3D motion estimation,
Behavior estimation
Stereo-System………………………. fixed on a………….robot
" Detection and counting of fish with a stereo-vision system",
research engineer: Sep. 2020 – August 2021 @LIRMM, Montpellier, ICAR.
Supervisors: Marc Chaumont, Gérard Subsol, …Eels
Fish Localization / Identification detection
Shark Species
localization classifications
under DCP
with multiple
Poverty prediction camerasShark localization // multi-view
Fish fishing net
Aggregating
Device
(FAP)
Chain
Shark
Container with
the cameras
Prototype :
(this is just an
« artistic » vision…)
Tunas
" Detection and counting of sharks from a sequence of multi-view underwater images by Deep-Learning ",
Post-Doc: Mehdi Yedroudj : Dec. 2019 – August 2020 @LIRMM, Montpellier, ICAR.
Supervisors: Marc Chaumont, Gérard Subsol, Vincent Creuze, Laurent Dagorn, Manuela CapelloEels
Fish Localization / Identification detection
Shark Species
localization classifications
under DCP
with multiple
Poverty prediction camerasEels counting
European management plan
for the restoration of the eel stock
" Identification and counting of eels from multibeam sonar videos by Deep-Learning ",
Master 2 internship 2020 @LIRMM, Montpellier, ICAR.
Supervisors: Gérard Subsol, Vincent Creuze, Mehdi Yedroudj, Marc Chaumont, Jason Peyre, Raphaël LagardeEels
Fish Localization / Identification detection
Shark Species
localization classifications
under DCP
with multiple
Poverty prediction camerasPrediction of poverty with a CNN ?
Predicted poverty in Uganda
From a 400x400 pixel images (poverty annual consumption level of households)
(1 km x 1km) the CNN should
predict a poverty value (scalar)
(0 = Low ; 100 = high)
Ask to Google Static Maps API,
for the image 400 × 400 pixels
at zoom level 16
Image from « Transfer learning from deep features for remote sensing and poverty
mapping » M. Xie et al. AAAI’2016Is it done?
Is there still room for
computer-science research?
Only correlated to 70% to the ground truth
Image from « Transfer learning from deep features for remote sensing and poverty mapping » M. Xie et al. AAAI’2016Objective: work
with images sequences
Deep Poverty (0% … 100%)
learning
… variable resolution,
temporal irregularities,
small database,
etc…
https://ericsvenson.com/monitoring-mining-impact/
Post-doc (funded by
Belmont/CESAB) 2020
" Poverty prediction by Deep Learning from a satellite image sequence ", Thesis (ANR)
Master 2 internship 2020 @LIRMM, Montpellier, ICAR.
in September 2020
Supervisors: Marc Chaumont, Gérard Subsol, Laure Berti-Équille, Dino IencoOther projects … • Prediction of the number of pelagic species for a GPS position Post-doc : Laura Mannocci (Marbec) Start in January 2020. • Prediction of genomic hybridization of European brown trout by image analysis (Marbec) Master 1 internship 2020 • Evaluation of wildlife crossings (bridges and tunnels) along highways (with VINCI Autoroutes, France and Claude MIAUD@ CEFE CNRS) Master internship 2021 ? SUBJECTS discussed in the past … : • Detection of plastics on the surface and in water (Marbec, Sète, France), • Identification of fish, gorgonians and algae (Banyuls Observatory, France), • Detection of fish malformations (“Poissons du soleil”, Balaruc, France), • Study of fish larvae (ECOCEAN society), • DNA analysis/comparison of marine species (SPYGEN society, France), • Analysis of microscopic images of coral reproduction (CORAIL Laboratory - CRIOBE Moorea), • TAAF…
TO BE CONTINUED …
Parts ofurban
                   the      image        that
                        areas nonurban areas
                                              “react”
                                             water  roads

Original daytime satellite
      images from
   Google Static Maps

 filter activation maps

  Overlay of activation
maps onto original images

Combining satellite imagery and machine learning to predict poverty N. Jean, M. Burke, M. Xie,
W. M. Davis, D. B. Lobell, S. Ermon, Science, 353(6301), 790-794, 2016
Comptage du nombre de bateaux
• La baie de Paulilles (aire protégée)
Posidonies
Entre Collioure et Banyuls-sur-Mer
• Question du parc marin : Coralligène = éco-syst. avec algues calcaire
Corrélation nb bateau / dégradation fond marin ?
WILLIAM Puech, VINCENT Itier, GRAPTIN Régis, Younes ZegaouiDispositif de surveillance • Image de 10 656 x 1 998 pixels • Un image toute les 30 minutes
Ce que l’on voudrait obtenir
Etape préliminaire (base + classif)

                  Entraînement               Validation

Ciel                   2094                    518
Mer                    2086                    526
Moteur                 1952                    252
“Scooter”               576                     74
Terre                  1605                    552
Voilier                2183                    440
            Base de donnée d’apprentissage
                                                          Matrice de confusion sur base de validation (2362 images).

  Inception v3 pré-entrainé sur 2 millions d’images sur ImageNet (tranfer learning)
That’s all folks!
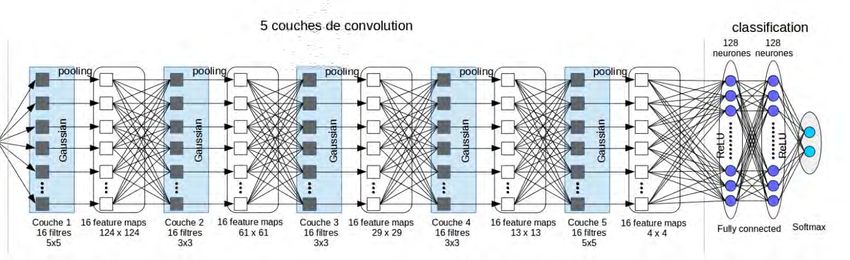
Le réseau CNN
 Convolutional Neural Network
  moyenne ou max [+ sous-échantillonage]
                 normalisation

convolutions
                 fonction non linéaire
                (= fonction d’activation)
La convolution
Exemple : convolution d’une zone 3x3 de l’image avec un « kernel »
200 210 15 1 1 1 ? ? ?
255 180 7 1 1 1 ? 114,4 ?
100 63 0 1 1 1 ? ? ?
contenu local de l’image « kernel » (noyau) résultat (output)Le réseau CNN
Convolutional Neural Network
moyenne ou max [+ sous-échantillonage]
normalisation
convolutions
fonction non linéaire
(= fonction d’activation)Le réseau CNN
Convolutional Neural Network
moyenne ou max [+ sous-échantillonage]
normalisation
convolutions
fonction non linéaire
(= fonction d’activation)Le pooling
Le réseau CNN
 Convolutional Neural Network
  moyenne ou max [+ sous-échantillonage]
                 normalisation

convolutions
                 fonction non linéaire
(= fonction d’activation)Exemple : Batch Normalisation
Le réseau CNN
 Convolutional Neural Network
  moyenne ou max [+ sous-échantillonage]
                 normalisation

convolutions
                 fonction non linéaire
(= fonction d’activation)Formellement (et grossièrement..)
L’apprentissage
                (expliqué avec les mains..)
Surface représentant la « distance » entre le score donné par le réseau et la vérité terrain
Localisation/Identification
automatique de poissons dans des
vidéos sous-marines
Le pipeline …
Intérêt : biomasse,
détection nouvelles espèces,
utilisation pour l’analyse comportementale, …L’architecture globale
GoogLeNet avec 27 couches et un soft-max.
Sebastien Villon, Marc Chaumont, Gerard Subsol, Sebastien Villeger, Thomas Claverie, David Mouillot,
"Coral reef fish detection and recognition in underwater videos by supervised machine learning :
Comparison between Deep Learning and hog+svm methods", ACIVS'2016, Advanced Concepts for
Intelligent Vision Systems, Lecce, Italy, October 24-27, 2016, 12 pages, published by Springer in the
Lecture Notes in Computer Science series.Une application d’identification Un utilisateur dessine un rectangle autour du poisson L’application renvoie un résultat sous forme d’un « top 5 ».
Poisson/Pas poisson via Faster-RCNN
         • Apprentissage :
                  – Méditerranée : 7 vidéos, 300 frames, 1268 vignettes.
                  – Mayotte: 5 vidéos, 110 frames, 866 vignettes.
         • Test:
                  – Mayotte : 1 vidéo, 23 frames, entre 18 et 25 individus par
                    frames
                                                                                                   • Rappel moyen: 0.78
                                                                                                       (on rate quelques poissons)
                                                                                                   • Précision moyenne : 0.99
                                                                                                       (mais on en invente aucun)

Ren S., He K., Girshick R., Sun J. “ Faster r-cnn: Towards real-time object detection with region proposal networks “. In NIPS’2015
Zoph B., Vasudevan V., Shlens J., Le Q. V. Learning transferable architectures for scalable image recognition. In CVPR’2018
Liu C., Zoph B., Neumann M., Shlens J., Hua W., Li L. J., ... Murphy, K. “ Progressive neural architecture search. In ECCV’2018 -> PNAS
Classification automatique
à partir d’imagettes
Utilisation du Deep Learning
(réseau de neurones convolutionnel)
– Apprentissage via une grandes bases d’images (+ de 121 espèces pour
le moment / objectif de ~ 300 espèces )
Un réseau deepHumain vs Machine
tache de classification d’imagettes
Images testées Taux de bonne classification
• Temps idenfication :
- Expert Humain (11) : ~ 5 secondes
- Machine : ~ 0.06 secondes sur notre plateforme
Images : 128x128x3.
Humain : test dure ~ 20 minutes et un expert teste ~ 270 images ;
Machine : GPU Nvidia Titan X ~ 3000 coeurs; apprentissage sur 1,100,000 vignettes, 70 epochs - 14 joursLes erreurs
Gestion « sûr » / pas « sûr »
• Post-processing:
  Définition d’une classe « le réseau n’est pas
  sûr » en plus des classes contenant les
  espèces
Choix d’un scénario
Par espèce :
• Seuil 1 : meilleur classif
  min [ #{Misclassif} | (#{Vrai Positif} = maximum) ]
       taux mauvaise classif.         taux classification correcte
• Seuil 2 : borne l’erreur de classif
  max [ #{Vrai Positif} | (#{Misclassif} < 5 %) ]
        taux classif. correcte   taux mauvaise classification
• Seuil 3 : erreur de classif minimum
  max [ #{Vrai Positif} | (#{Misclassif} = minimum) ]
        taux classif. correcte         taux mauvaise classification
Résultats
• Data-set (Ile de Mayotte) :
– D0 : 130 vidéos, 69 169 images, 20 espèces.
Entre 1 134 et 7 345 imagettes par espèce.
– D1 : 20 vidéos, 6 320 images
– D2 : 25 vidéos, 13 232 images
ResNet 100 couchesLes scénarios…
Qui va traiter les « unsures » ?
• CAS1 et CAS2 : Personne
Détection d’événements (peu importe le taux d’erreur)
– monitoring d’espèces invasives
– évenement rare
• CAS3: Des humains ; les “unsures” sont vraiment “unsure”
Gain de temps pour le traitement de gros volumes
• CAS4: L’expert
L’expert recherche une qualité d’annotation sur un petit data-setUtilisation de l’arbre taxonomique
Post-traitement par rapport à l’arbre taxonomique :
CAS1: Les votes (confiants) sont cohérents
On classe au plus fin (espèce/genre/famille)
CAS2: Les votes (confiants) sont incohérents
2 d’accords -> la majorité l'emporte
Non d’accords -> classé dans « Unsure ».
-> Supprime les erreurs quand incohérences.
-> Permet de réduire les classifications incorrectes.SeaCLEF 2017
The CLEF Association is an independent no-profit legal entity, established in October 2013.
• Tâche 4: Reconnaissance individuelle des baleines
• Analyse des nageoires caudales
Objectif : A partir d’une image de caudale,
trouver l’individu correspondant dans la base
Aire de Madagascar
C’est le jeu des 7 différences !
Unsupervised identification
Alexis Joly, Jean-Christophe Lombardo, Julien Champ, Anjara Saloma
https://www.imageclef.org/lifeclef/2017/seaBonnes correspondances (très peu) Mauvaises correponcances (beaucoup)
Une solution = traitement du signal +
      recherche dans une base
La cohérence spatial (répartition spatiale) des marqueurs
   biologique locaux est une information crucial pour réduire
   les faux positifs.

• Principe :
  1) Trouver des zones caractéristiques (points) de l'images
        (traitement du signal; SIFT)
  2) Appareiller les points et « filtrer »
  Estimer une transformation géométrique entre l'image à appareiller et
  l'image cible pour affiner l'apparition
  3) Evaluer la "similitude" entre les deux individus comparés
  via une métrique de « scoring » des zones appareillés.
                                        SIFT-based matching
                                                              ConvNet features
En 1D la direction de la pente est égale au négatif de la dérivé
You can also read