Niche analysis of dominant species in alpine desert grassland communities in Qaidam Basin
←
→
Page content transcription
If your browser does not render page correctly, please read the page content below
E3S Web of Conferences 257, 03021 (2021)                                                            https://doi.org/10.1051/e3sconf/202125703021
AESEE 2021

         Niche analysis of dominant species in alpine desert grassland
         communities in Qaidam Basin
         SUN Jiancai1, LI Yonghui1, Deng Deting1, YANG Sha1, WU Yukun1, SHI Huilan1*
         1College   of Eco-Environmental Engineering, Qinghai University, Xining 810016, China

                       Abstract: Community dominant plants and their ecological niche research is the focus of community ecology
                       research. To explore the niche characteristics of desert dominant plants and the relationship between them and
                       soil factors in Qaidam Basin, and to provide a basis for the construction of desert plant communities and the
                       sustainable management of natural resources in Qaidam Basin. Taking 13 desert plant communities in Qaidam
                       Basin, Qinghai Province as the research objects, this paper analyzed the characteristics of desert plant
                       communities and dominant species based on soil physical and chemical properties, and calculated the niche
                       width and niche overlap of dominant plants. The dominant plants are, Haloxylon ammodendron, Tamarix
                       chinensis, Achnatherum splendens, Poacynum hendersonii, Reaumuria songonica, Phragmites australiss,
                       Sympegma regelii, and Ajania Tenuifolia, Artemisia sphaerocephala, Ceratoides latens, Pearl russianthistle,
                       Scirpustriquter. There were different degree of niche overlap among species in the community. In addition,
                       CCA sequencing showed that different species had different requirements on the environment, and the
                       distribution of dominant species was mainly affected by soil total nitrogen and soil organic matter.

                                                                             niche characteristics. When the amount of available
                                                                             resources is limited, the wide niche species have stronger
      1 Introduction                                                         competitive ability, while the narrow niche species have
      Niche refers to the position of a population in time and               weaker competitive ability. The lack of available resources
      space in a natural ecosystem and its functional relationship           stimulated the increase of species' niche width, while the
      with related populations[1]. Niche separation is a way to              niche width narrowed when available resources were
      achieve species coexistence, and reveals the dynamics and              abundant.
      causes of interspecific competition and evolution in                       Niche overlap[7] refers to the degree of common
      communities [2].                                                       utilization of a certain resource niche by two species,
          Grinell[3] used the concept of niche in 1917 to divide             which is measured by measuring the degree of similarity
      the spatial units of the environment and the position of a             of species in the total resource spectrum. Species using the
      species in the environment. Elton[4]regards ecological                 same resources cannot coexist for a long time, that is,
      niche as the status and function of species in biological              complete competitors cannot coexist. The concept of niche
      community or ecosystem. Hutchinson[5] proposed the                     is closely related to the principle of competitive exclusion.
      concept of N-dimensional niche, emphasizing the impact                 The species niche often overlaps within the community.
      of various environmental variables on the survival of                      Niche differentiation[3] refers to the distance between
      species. Hutchinson proposed the concept of basic niche                the preferred positions of adjacent competitors on the
      and actual niche [4], proposed that a niche is the overall             resource spectrum, and is the dissimilarity of species'
      relationship between a plant and its environment.                      ecological niche, which is used to calculate the degree of
      Colinvaux proposed the concept of species niche. After the             difference of species' ecological niche.
      1980s, Liu Jianguo and Ma Shijun put forward the
      extended niche theory [6]. Wang Gang[5] defined the                    2 Materials and methods
      generalized species niche as the mapping relationship
      between environmental variables and species variables.
          The quantification of niche characteristics is                     2.1 Overview of the study area
      conducive to the comparison of the range of space
                                                                             Qaidam Basin is a plateau basin, located in the northwest
      occupied by species and the ability to use resources in
                                                                             of Qinghai Province, mainly in the Tibetan Autonomous
      communities, and the quantitative description of these
                                                                             Prefecture of Haixi Mongolian Formation. It is a closed
      environmental effects. The niche measurement mainly
                                                                             basin surrounded by Kunlun Mountains, Altun Mountains
      includes niche width, niche overlap and niche
                                                                             and Qilian Mountains. It is located between 90° 16’E and
      differentiation.
                                                                             99°16 'E and between 35° 00’N and 39° 20’N. The basin
          Niche width is one of the quantitative indicators of
         *corresponding author: hlshi7701@126.com;
          2267290531@qq.com
© The Authors, published by EDP Sciences. This is an open access article distributed under the terms of the Creative Commons Attribution License 4.0
(http://creativecommons.org/licenses/by/4.0/).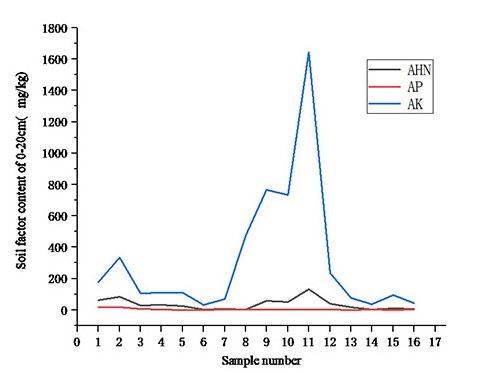
E3S Web of Conferences 257, 03021 (2021) https://doi.org/10.1051/e3sconf/202125703021
AESEE 2021
covers an area of about 240,000 square kilometers. The The calculation formula of niche overlap (NO) of
landforms in the basin are mostly Gobi, bare rock, desert, dominant population is based on the overlapping index
etc., with little cultivated land resources, sandy soil, Pianka[9]:
extensive permafrost, and less irrigation water. It is a N
Pij Pkj (3)
typical inland plateau desert basin with long sunshine, NO j 1
N N
large radiation, large temperature difference, arid climate, ( Pij ) 2 ( Pkj ) 2
long cold winter, short cool summer, and extremely rare j 1 j 1
annual precipitation. In the formula, P is the value of species dominance, N
is the number of quadrants, and the meaning of P is the
same as before
2.2 Selection and setting of sample plots Canonical correspondence analysis (CCA sequencing)
Through field investigation and investigation, 13 transect is a nonlinear multivariate direct gradient analysis method,
zones were randomly set. Different plant types in the which combines analysis with multivariate regression [10].
transect were set with different quadrates: 1m×1m
quadrate was used for herbaceous plants, 2m×2m quadrate 3 Results and analysis
was used for shrub communities with small plants, and
5m×5m quadrate was used for shrub communities with Table 1 statistics the mean value, extreme value and
large plants. The height, coverage and frequency of each coefficient of variation of each soil factor in different areas
species in the sample square were recorded, and the and depths, and reflects the degree of dispersion and
altitude and geographical location of each sample plot concentration of each data in the sample site based on this.
were measured at the same time. Soil samples with 0- The horizontal variation of soil can be described by the
20cm depth and 20-40cm depth were randomly taken in coefficient of variation. When the coefficient of variation
each plot with soil drill to investigate the physical and is less than 0.1, it indicates a weak variation, and most of
chemical properties such as soil moisture content and pH. the data are not significantly different. When the
The dominant species was the main object of this study, coefficient of variation is [0.1,1], it indicates moderate
including Haloxylon ammodendron, Artemisia variation and significant difference in some data. When
sphaerocephala, Artemisia sphaerocephala and Bassia the coefficient of variation was greater than 1, it showed
dasyphylla, which were the dominant species in the desert strong variation, and most of the data showed significant
steppe. Phragmites australis, Tamarix chinensis, Salsola differences. The variation coefficient of soil total
asserine, and Nitraria tangutorum, Ceratoides latens, phosphorus was the smallest in surface layer and deep
Sympegma regelii, Ceratoides latens and Salsola layer, and the vertical distribution of soil total phosphorus
abrotanoides were the dominant species of the desert in Qaidam Basin was more uniform, followed by soil total
shrubs. potassium and organic matter. In the horizontal
distribution, the coefficient of variation of K was the
2.3 Data processing smallest, followed by the coefficient of variation of P and
N. The coefficient of variation of the surface horizontal
Importance values indicate the degree of dominance of a distribution of K was greater than that of the deep
species, which can be calculated as follows: horizontal distribution, which may be caused by the
Importance value (IV)= (relative coverage + relative surface soil being easily affected by environmental and
height + relative frequency) /3 human factors.
The herb niche width is the ratio of the area occupied Soil water plant is to maintain normal physiological
by a particular plant to the area of the entire grassland area. function and guarantee the life activities of the important
The Levins niche width (NB) formula[8] is expressed as conditions, and soil biological, physical and chemical
follows: process essential substance, variation coefficient of soil
r
(1) moisture content is 1.10, in the qaidam basin, the lack of
NB 1/ P 2
i
j 1
ij
rain is the main cause of this difference, directly reflect the
nij , r structural of soil, soil bulk density. It is one of the main
Pij N i nij indicators of soil physical properties. The larger the bulk
Ni j 1
density, the less fluffy the soil is. Soil bulk density is one
Nbi is the niche width value of species I, Pij is the of the indexes to measure soil looseness. The change of
dominance proportion of species I in quadrate j, nij is the soil bulk density is small, and the soil texture is more
dominance degree of species I in community j, Ni is the uniform.
sum of dominance degree of species I in all quadrates, and
r is the number of quadrate.
Hurlbert[8] modified the niche width formula so that
the range of the formula was between [0,1], and the
modified formula was:
NBi 1 (2)
B
r 1
Where, B is the revised niche width value
2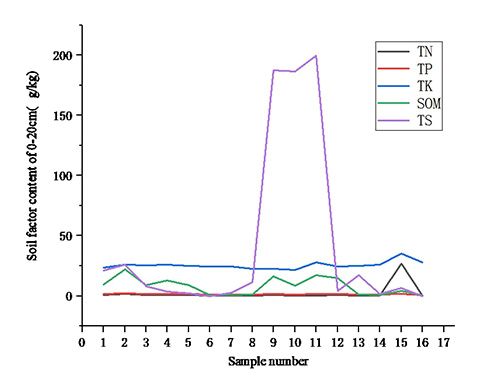
E3S Web of Conferences 257, 03021 (2021)                                                           https://doi.org/10.1051/e3sconf/202125703021
AESEE 2021

                                               Table 1 summary table of soil ecological factors

                         Indicators          Soil depth      Max value       Min value      Coefficient of       Average
                                                                                              variation           value

                     Soil total nitrogen      0 -40 cm          1.41             0.13             0.74              0.49
                           (g/kg)             20-40cm            1.1             0.13             0.64              0.41
                                              Average           1.26             0.13             1.11              0.45
                      Total phosphorus        0 -20 cm          2.38             0.91             0.24              1.44
                            (g/kg)            20-40cm           2.18             0.87             0.27              1.43
                                              Average           2.28             0.89             0.01              1.43
                        Total kalium          0 -20 cm          35.15           21.53             0.12             25.77
                           (g/kg)             20-40cm           28.79           18.79             0.11             23.50
                                              Average           31.97           20.16             0.07             24.64
                     alkali-hydrolyzable      0 -20 cm           131               3              0.92             38.50
                           nitrogen           20-40cm            76                3              0.91             25.29
                           (mg/kg)            Average           103.5              3              0.29             31.90
                        Available P           0 -20 cm          19.1             1.2              1.15             4.86
                         (mg/kg)              20-40cm             9                1              0.77             3.36
                                              Average           14.05             1.1             0.26             4.11
                        Available K           0 -20 cm          1645              31              1.14            373.17
                         (mg/kg)              20-40cm            943              31              0.98            254.35
                                              Average           1294              31              0.27            313.76
                       Organic matter         0 -20 cm          22.13            0.55             0.86             8.33
                           (g/kg)             20-40cm           16.79            0.55             0.73             6.66
                                              Average           19.46            0.55             0.16             7.50
                      Total salt (g/kg)       0 -20 cm         199.53            1.59             1.42            54.98
                     Water content (%)         0-20cm           26.92            0.38             1.10             7.65
                       Bulk density            0-20cm
                          (g/cm3)                               1.91            0.93              0.24              1.42

      3.1 Distribution characteristics of soil factors
                                                                                            a
      3.1.1 Horizontal distribution characteristics of soil
      factors
      In the horizontal distribution, in the 0-20cm surface layer,
      the total salt content in plot 9, 10 and 11 increased sharply,
      and the maximum value reached 199.53g/kg, 144.98
      higher than the average value (Table1). The plot type was
      the desert shrub of Artemis vulgaris, followed by the
      saline alkaline land wetland of Scirpus mariqueter +
      Phrase. The mean value of total salt in all sample plots was
      54.98. The variation coefficient of soil total K was the
      lowest and its curve was the most gentle (Fig.1a).
      However, the content of available K increased in plot 9,
      10 and 11, and reached the maximum value in plot                                       b
      11(Fig.1b).
          In the deep 20-40cm soil, the content of total
      potassium was significantly higher than other indexes,
      with an average value of 23.50g/kg and a maximum value
      in the sample plot 15. The variation coefficient of soil
      organic matter in deep layer was 0.73, and the content of
      organic matter in sample plot 2 and sample plot 11 was the
      highest. Deep available potassium increased in plot 9, 10
      and 11, and reached 943mg/kg in plot 11. The mean
      content of available phosphorus was 3.36, and the
      coefficient of variation was 0.77.

                                                                           Fig. 1 Distribution characteristics of soil factors at 0-20cm level

                                                                       3
E3S Web of Conferences 257, 03021 (2021) https://doi.org/10.1051/e3sconf/202125703021
AESEE 2021
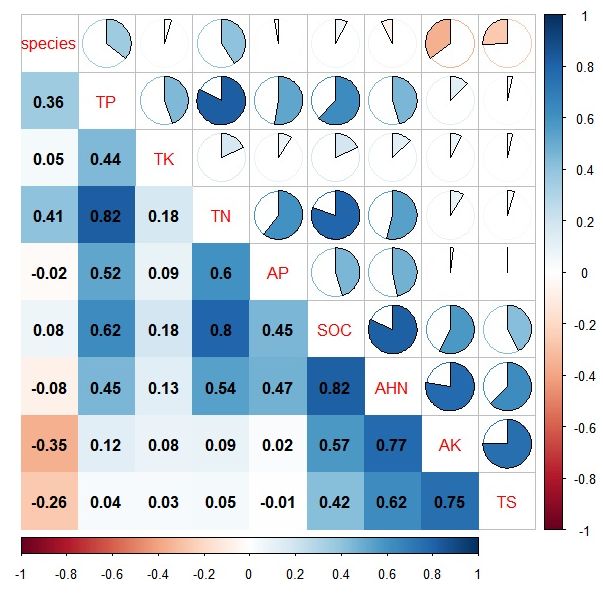
3.1.2 Vertical distribution characteristics of soil phosphorus and total nitrogen, total nitrogen and available
factors phosphorus, organic matter and alkali-hydrolytic nitrogen,
alkali-hydrolytic nitrogen and available potassium, and
The total nitrogen content in the surface soil of sample available potassium and total salt, with correlation
plots 1-5, 8-12 was higher than that in the deep soil. The coefficients of 0.82, 0.8, 0.82, 0.77, 0.75, respectively,
total nitrogen content in the deep soil of sample plots 7, 13 while there was negative correlation between available
and 16 was higher. The total nitrogen content in the phosphorus and total salt. Negative correlation accounted
surface soil and the deep soil of sample plots 6 and 15 was for 14% and positive correlation accounted for 86%,
the same. The total nitrogen content of surface soil was among which the correlation coefficient above 67%
significantly higher than that of deep soil. accounted for 16%, the correlation coefficient between 33%
From the average value of each soil layer, the soil total and 67% accounted for 42%, and the correlation
nitrogen content increased with the decrease of soil depth. coefficient between 0-33% and 33% accounted for 42%
The total phosphorus content in the surface soil of sample (Fig.3).
plots 1-2, 6-7, 11, 13 and 15 was high; the total phosphorus
content in the deep soil of sample plots 3-5, 8-10 and 16
was higher than that in the surface soil, and the total
phosphorus content in the deep soil was high (Fig.2a).
From the average value of each soil layer, the soil total
phosphorus content decreased with the increase of soil
depth. The content of soil organic matter in the surface
layer of samples 1-5, 9-12 was higher than that in the deep
layer of samples 13, 15 and 16. The content of soil organic
matter in the deep layer of samples 6, 7 and 8 was the same
as that in the deep layer of samples 6, 7 and 8. According
to the average value of each soil layer, the content of soil
organic matter decreased with the increase of soil depth,
and the content of soil total potassium was evenly
distributed in topsoil and deep soil (Fig.2b).
a 0-20
20-40
20
Soil organic matter content(g/kg)
Fig. 3 Correlation analysis diagram of soil factors
3.2 Niche characteristics of plant communities
10 in Qaidam Basin
A total of 13 sample plots were set for field plant
community investigation, and the geographical locations,
0 community types and dominant species of the sample
1 2 3 4 5 6 7 8 9 10 11 12 13 14 15 16
Sample number plots were shown in Table 2.
40
b 0-20 3.2.1 Niche width of dominant species
20-40
Niche width is a measure of the status quo of resource and
Soil total potassium content(g/kg)
30 environment utilization of a plant population. The larger
the niche width of a population is, the stronger its ability
20
to adapt to the environment will be, and it will be more
widely distributed in various environments.
Table 2 is the information table of importance values
10 and niche width of dominant species after the community
investigation. According to the analysis of the table,
0
Achnatherum splendens has the largest niche width (IV
1 2 3 4 5 6 7 8 9 10 11 12 13 14 15 16 =0.15, Bi =2.565), Herba splendens (IV = 0.12, Bi = 0.693)
Sample number
and Herba mongolica (IV = 0.28, Bi =0.693) has the
Fig. 2 Vertical distribution characteristics of soil organic matter smallest niche width (Table2).
and total potassium content
3.1.3 Correlation between soil factors
There were significant positive correlations between total
4E3S Web of Conferences 257, 03021 (2021) https://doi.org/10.1051/e3sconf/202125703021
AESEE 2021
Table 2 Plant community questionnaire andImportance and niche width of dominant species
Sample Elevation Important
Longitude Latitude Dominant species Niche width Ranking
number (m) value
1 3039.22 99°3'32"E 36°47'30"N Achnatherum splendens 0.15 2.565 1
2 3075.92 97°56'31"E 36°1'0"N Ajania tenuifolia 0.12 0.693 10
3 2901.56 97°56'31"E 36°3'3"N Artemisia sphaerocephala 0.36 1.099 6
4 2757.78 96°56'0"E 36°14'13"N Haloxylon ammodendron 0.29 1.386 4
5 2746.21 94°26'56"E 36°24'6"N Tamarix chinensis 0.32 1.386 4
6 2719.41 94°15'39"E 36°31'9"N Poacynum hendersonii 0.38 1.098 8
7 2720.57 94°12'13"E 36°33'45"N Phragmites australis 1.00 1.792 2
8 2794.83 93°14'51"E 36°54'28"N Scripus distigmaticus 0.28 0.693 10
9 2802.41 93°10'17"E 36°54'41"N Ceratoides latens 0.71 1.387 3
10 3052.69 91°57'48"E 36°40'23"N Sympegma regelii 0.25 1.097 8
11 2736.98 96°13'44"E 36°22'33"N Reaumuria songonica 0.14 1.096 9
12 3144.58 95°22'9"E 37°48'40"N Pearl russianthistle 0.16 1.099 6
According to the table analysis, the mean value of
niche overlap value was 0.167, and the niche overlap value
3.2.2 Niche overlap of dominant species
was mainly distributed between 0.01 and 0.03, of which
Niche overlap refers to the similarity between two species 7.69% were between 0.01 and 0.02, and 44.87% were
in relation to ecological factors. Niche overlap occurs between 0.01 and 0.03. 80.77% of the niche overlap index
when two species use the same resource or share a certain values were between 0.01 and 0.05, 34.62% of the niche
resource. Table 3 is the statistical table of niche overlap of overlap index values were between 0.03 and 0.05 (Table3).
dominant species.
Table 3 Niche overlap of dominant species
Species 1 2 3 4 5 6 7 8 9 10 11 12
1 1
2 0.034 1
3 0.029 0.022 1
4 0.057 0.043 0.038 1
5 0.046 0.035 0.031 0.059 1
6 0.042 0.032 0.028 0.054 0.044 1
7 0.038 0.029 0.025 0.049 0.040 0.036 1
8 0.025 0.019 0.017 0.032 0.026 0.024 0.022 1
9 0.029 0.022 0.020 0.038 0.031 0.028 0.025 0.016 1
10 0.022 0.027 0.024 0.046 0.037 0.034 0.031 0.020 0.024
11 0.040 0.030 0.027 0.051 0.042 0.038 0.034 0.023 0.027 0.032 1
12 0.027 0.021 0.018 0.035 0.029 0.026 0.023 0.016 0.018 0.022 0.025 1
soil total salt increased from left to right along the first axis.
Soil total nitrogen and soil organic matter decrease from
3.3 Canonical correspondence analysis
bottom to top along CCA2. Soil total nitrogen and soil
Canonical correspondence analysis (CCA sequencing) is a organic matter had the greatest influence on community
nonlinear multivariate direct gradient analysis method, and species distribution, followed by soil water content
which combines analysis with multivariate regression[10]. and soil pH (Fig.4).
In this study, 13 communities and 61 species were selected Different species have different requirements on the
for sequencing analysis based on importance values. environment, so they have different distribution
Canoco 5.0 software was used for CCA sequencing. The differences in the CCA sequence diagram. In the CCA
first axis value of Tentality of Gradient can be calculated sequence diagram, the species located above the
as 12.8 through DCA ranking, so as to conduct CCA horizontal axis are mainly affected by soil total salt and
ranking. Soil pH and bulk density decreased from left to soil bulk density, while the species located to the left of
right along the CCA1 axis, while soil water content and the vertical axis and below the horizontal axis are mainly
affected by soil pH.
5E3S Web of Conferences 257, 03021 (2021) https://doi.org/10.1051/e3sconf/202125703021
AESEE 2021
1.0
3
1.0
35 36
33
34 37 31 4
39 32
38 60 12
61
57 10
BD BD
46 50 44
pH
56
19 45 47 pH 8
49
40 52
41 7
3 2 43 6
48 TS 42
51 TS 5
59
24 9
16
58 26 8
7 WC 11
WC
22 5 10
20 2
53 25 17 15 1
1
6 11 4
55 30 12
54 28 14 13 TP TN SOM 9 TP SOM
18
23
27 21
TN
-1.0
-1.0
29
-1.0 1.0 -1.0 1.0
Fig. 4 CCA two-dimensional sequence diagram of environmental factors of species
the niche size of the community. Niche overlap reflects the
similarity and competition between populations in
4 Conclusion and discussion resource utilization. Higher niche overlap means that
Based on the determination of soil physical and chemical populations have similar ecological requirements for
properties and the analysis of niche and CCA sequence of environmental resources, and therefore may have intense
dominant species in Qaidam Basin, this study found that competition. Most niche studies suggest that a larger niche
there were different degrees of niche overlap among width is often accompanied by a higher niche overlap.
species in the community. In addition, CCA sequencing Achnatherum splendens, ramosissima ramosissima,
showed that different species had different requirements Achnatherum splendens and hemp grandifolium had a
on the environment, and the distribution of dominant large niche width and a high degree of niche overlap.
species was mainly affected by soil total nitrogen and soil
organic matter. Acknowledgement
Niche breadth is to measure plant population scale, the
utilization of resources and environment NiuHuiHui[11] the The study was supported by the following projects:
plant community in the western qaidam basin found that National Key Research and Development Program, China
niche breadth from big to small in turn is: Ceratoides (2017YFC0504800); NSC Promote the Research
latens, Reaumuria songonica, Achnatherum splendens, Cooperation and High-level Talents Training Program
Phragmites communis, Salsola abrotanoides, Nitraria with Canada, Australia, New Zealand and Latin America
tangutorum, Tamarix ramosissima, Haloxylon ([2021]109 CSC); Basic Research Project of Qinghai
ammodendron. This is consistent with the results of niche Science and Technology Department, China (2021-ZJ-
width of dominant species in this paper. And niche breadth 715); National Natural Science Foundation of
of the larger species does not occupy the overlap on the China(C170201); Plant diversity and interpretation in the
niche overlap value, but in a middle position, achnatherum Haixi Desert, Qinghai Province, China (2019-STXY-7).
splendens, for example, it has the highest niche breadth
but niche overlap are floating around in 0.2, and the
important value of species niche breadth not necessarily References
high, reed important value is the largest, but its niche 1. Zhu CQ. (1993) Niche Theory and its Application in
breadth ranked second, These results indicate that these Forest Ecology. J. Chinese Journal of Ecology, (04):
species have obvious response to environmental factors 41-46.
and occupy certain niche under certain conditions. There
is no direct linear relationship between niche width and 2. Lin KM, Guo YS. (2001) The Research Advances on
niche overlap of vegetation. Li Jinxiu[12] found that with Niche Theory and its Application. J. Journal of Fujian
the aggravation of natural grassland degradation, the niche College of Forestry, 21(3): 283-287.
width and total niche width of dominant species of natural 3. May R. Sun RY, Translation [M]. Beijing: Science
grassland in Qaidam Basin showed a decreasing trend, press. 1980.
while the niche overlap value slightly decreased. Different 4. Zhang GM, Xie SC. (1997) Development of Niche
habitat may cause the change of community ecological Concept and Its Perspectives. J. Chinese Journal of
niche, previous studies have shown that natural Ecology,16(6):46-51.
environment pressure will gradually eliminated some
5. Wang G, Zhao SL, Zhang PY, et al. (1984) On the
species, community species richness decreased, and the
Definition of Niche and the Improved Formula for
generalization of the number of can also because the
Measuring Niche overlap [J]. Acta Ecologica Sinica,
habitat pressure to reduce gradually, cause structure
4(2): 119-127.
simplification of the community, the community as a
whole the resource utilization efficiency and 6. Liu JG, Ma SJ. Perspective of Modern Ecology [M].
environmental adaptability will abate. Thereby limiting Beijing: Science press.1990.
6E3S Web of Conferences 257, 03021 (2021) https://doi.org/10.1051/e3sconf/202125703021
AESEE 2021
7. Abrams P. (1980) Some comments on measuring
niche overlap. J. Ecology, 61(1): 44-49.
8. Huang YZ. (1994) Mathematical method in Niche
Theory Study. J. Chinese Journal of Applied Ecology,
5(3): 331-337.
9. Thompson K, Gaston K J, Band S R. (1999) Range
size, dispersal and niche breadth in the herbaceous
flora of central England.J. Journal of Ecology, 87(1):
150-155.
10. Zheng CC, Yi LT, Zhang C, et al. (2015) Interspecific
relationship and canonical correspondence analysis of
the dominant species in ecological service forest of
Jiangshan City in Zhejiang Province. J. Acta
Ecologica Sinica, 35(22): 7511-7521.
11. Niu HH, Chen H, Fu Y, et al. (2019) Ecological niche
characteristics of desert plants in the eastern Qaidam
Basin. J. Acta Ecologica Sinica, 39(08): 2862-2871.
12. Li JX. (2012) Study on the Ecological Niche of
Natural Grassland with Different Degraded Degree in
Qaidam Basin. J. Journal of Anhui Agri, 40(06):
3362-3363+3688.
7You can also read


