A deep learning-based approach for direct PET attenuation correction using Wasserstein generative adversarial network
←
→
Page content transcription
If your browser does not render page correctly, please read the page content below

Journal of Physics: Conference Series

PAPER • OPEN ACCESS

A deep learning-based approach for direct PET attenuation correction
using Wasserstein generative adversarial network
To cite this article: Yongchang Li and Wei Wu 2021 J. Phys.: Conf. Ser. 1848 012006

View the article online for updates and enhancements.

 This content was downloaded from IP address 46.4.80.155 on 11/09/2021 at 01:45
ICAACE 2021 IOP Publishing
Journal of Physics: Conference Series 1848 (2021) 012006 doi:10.1088/1742-6596/1848/1/012006

A deep learning-based approach for direct PET attenuation
correction using Wasserstein generative adversarial network

 Yongchang Li1, Wei Wu1, *
 1
 Department of Information Engineering, Wuhan University of Technology, Wuhan,
 Hubei Province, 430070, China
 *
 Corresponding author’s e-mail: wuwei@whut.edu.cn

 Abstract. Positron emission tomography (PET) in some clinical assistant diagnose demands
 attenuation correction (AC) and scatter correction (SC) to obtain high-quality imaging, leading
 to gaining more precise metabolic information in tissue or organs of patient. However, there
 still are some inevitable issues, such as imperceptible mismatching precision between PET and
 CT imaging, or plenty of ionizing radiation dose exposure in many after-treatment inspections.
 To cope with the abovementioned issues, we introduced a deep learning-based technique to
 achieve a direct attenuation correction for PET imaging in this article. Moreover, wasserstein
 generative adversarial networks and hybrid loss, including adversarial loss, L2 loss and gradient
 difference loss, were utilized to enforce the deep network model to synthesize PET images
 with much richer detail information. A comprehensive research was designed and carried out
 on a total of forty-five sets of PET images of lymphoma patients for the model training stage
 and test stage. Final performances analysis was totally based on our experimental outcomes,
 which demonstrated that the proposed algorithm has definitely improved the quality of PET
 imaging according to qualitative and quantitative study.

1. Introduction
Positron emission tomography (PET) is an extensively adopted functional imaging technology that
enables molecular-level metabolic activities in tissues or organs by injecting FDG or other isotope
tracers. In practice, recessions such as photon attenuation and scattering reduce the resolution of PET
imaging, inevitably resulting in great difficulties for assistant diagnose clinically. However, additional
anatomic imaging for PET AC, such as CT image, exposes patients to extra ionizing radiation doses.
To cut down the ionizing radiation dose to a much lower level while simultaneously obtaining high-
quality PET imaging, various methods have been proposed to generate synthetic CT (sCT) imaging
using MR (produce no radiation) data for PET AC in recent years. These approaches could be roughly
separated into three categories: the tissue segmentation-based approach [1], the atlas-based approach
[2] and the learning-based approach [3]. Initially, the MR-based AC (MRAC) method named tissue
segmentation-based approaches was designed to segment MR images into some different tissue
categories, such as air, fat and bone, and then theoretically assign the attenuation coefficients at 511
keV according to different tissues categories. Atlas-based approaches provide another way to perform
an image registration of MRI and corresponding CT templates to estimate an sCT image and
simultaneously obtain corresponding AC maps. In addition, learning-based techniques typically utilize
machine learning-based approaches to directly learn the nonlinear mapping functions between MR
data and corresponding CT images. Though these methods obtain some favorable results to some

 Content from this work may be used under the terms of the Creative Commons Attribution 3.0 licence. Any further distribution
 of this work must maintain attribution to the author(s) and the title of the work, journal citation and DOI.
Published under licence by IOP Publishing Ltd 1

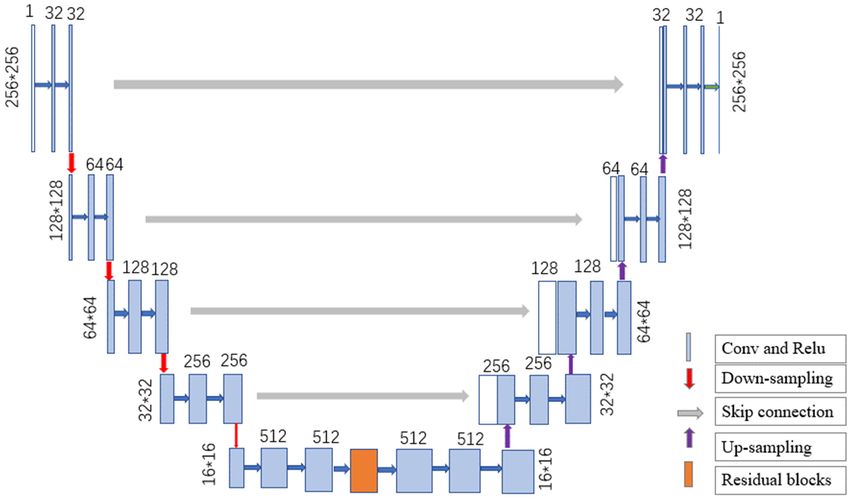
ICAACE 2021 IOP Publishing
Journal of Physics: Conference Series 1848 (2021) 012006 doi:10.1088/1742-6596/1848/1/012006

extent, there are still some common challenges, such as the precision of image matching or the
presentation of feature extraction.
 In the past few years, deep learning has aroused enormous interests from researchers in pattern
recognition and image processing, as well as in medical image processing fields, such as image super-
resolution, image segmentation, image denoising and image generation. Several studies relevant to
deep learning-based MRAC have focused on generating sCT images from corresponding MR images
for diagnostic and quantitative PET imaging using sophisticated CNNs, which can be regarded as a
nonlinear regression task. Han et al. [4] introduced a foundational 2D U-net architecture frame, where
some encoder and decoder layers were directly connected by several skipping connections. Dong et al.
[5] first provided a 3D GANs model to generate sCT images from corresponding MR data. However,
these methods require lengthy MR sequences and are susceptible to the image registration accuracy of
MR images and PET images. Later, Van Hemmen et al. [6] introduced a deep learning-based method
to achieve PET AC from existing NAC PET images directly where their network was consisted of a
classical convolutional encoder-decoder (CED) network. Inspired by the abovementioned work, to
solve the limitations of the abovementioned approaches, in this article, we introduced a deep learning-
based technique for direct PET AC by making better use of NAC PET image.

2. Materials and Methods

2.1. Network Framework
An improved deep learning-based method using 2D WGANs for PET image attenuation correction is
proposed in this paper, as shown in Figure 1. The outline of the proposed model consists of two main
parts: the generator G and discriminator D .The generator of the proposed approach modified the
classical U-net structure, containing the encoder part, the transformation parts, decoder part and four
skipping connections. The input of the generator network is a batch of NAC PET images, and the
corresponding output are sAC PET image with the identical image size as the input. The generator has
five layers: the first layer has two convolution operations, and each layer of the next four layers has
three convolution operations, one max-pool operation followed by a rectified linear unit (ReLu)
activation function.

 Figure 1. The outline of the proposed generator under classical U-net structure.

 2
ICAACE 2021 IOP Publishing Journal of Physics: Conference Series 1848 (2021) 012006 doi:10.1088/1742-6596/1848/1/012006 In the transformation part, ten residual blocks are added between the encoder and the decoder part in the networks. In this case, additional residual blocks enable to prevent gradient from disappearing and increase the depth of the network to obtain the better feature presentation. For the skipping connections, low-level features in the encoder part can be passed into the decoder part by a direct connection, which leads to better feature presentation in the image restoration stage after where low- level features are fused with high-level features. In the decoder part, five convolution-upsampling layers are applied to recover feature maps to the image with the original size and then are transformed into output images. The convolution kernel size of the generator part is 3 3 with a stride of 1. For the discriminator of the proposed algorithm, four convolution layers combined with two full connection network (FCN) layers are built to identify whether inputs of discriminator are from the outputs of generator or the ground-truth. The outputs of the discriminator are directly defined as Earth-Mover (EM) distance, representing the distinct variation between the outputs of generator and the true images, which back-propagates to adjusts the weights of filters in G and D, separately. 2.2. Loss Function and image evaluation To mitigate mode collapse and inevitable training convergence issues when we apply a traditional GAN, the Wasserstein distance rather than the JS divergence was utilized in the proposed algorithm to observe data distributions. Concretely, generator G is designed to synthesize images greatly close to the ground truth, while discriminator D attempts to identify whether it is from the output of G or the ground-truth. Thus, both and are trained by the following loss function equation: min max LWGAN (G, D) Ex D( x) Ez D(G ( x)) Exˆ xˆ D( xˆ ) 1 2 2 G D (1) xˆ G ( x ) 1 Y , U 0,1 (2) where z is the input image and G ( x) represents the outcomes of the generator G . The first two parts of Eq (1) represent the EM distance, and the third part is the gradient penalty term to stable the network training stage. In addition, is a weighted hyperparameter that is set to 10 empirically, and x̂ is sampled from the sets of the outputs of generator G and ground truth images randomly. In addition, the image gradient difference loss (GDL), which is typically designed to compute the gradient difference between estimated AC PET images and the true AC PET images: Lgdl Yx G ( x ) x Yy G ( x ) y 2 2 (3) L2 loss enables the synthetic images and the ground-truth to close to the identical intensity distribution, which can be defined as: h 1 w 1 1 Y 2 Lmse (G ( x ), Y ) (i, j ) G ( x)(i , j ) H W i 0 j 0 (4) The total loss function of the proposed approach consists of the weighted sum of the following parts: L o min max LWGAN (G , D ) mse Lmse gdl Lgdl G D (5) To assess the quality of the estimated sAC PET image, normalized mean error (NME), peak signal- to-noise ratio (PSNR, dB) are selected as our evaluation metrics, which can be defined as: 3
ICAACE 2021 IOP Publishing Journal of Physics: Conference Series 1848 (2021) 012006 doi:10.1088/1742-6596/1848/1/012006 1 N 1 I AC (i ) I sAC (i ) NME ( I AC , I sAC ) N i 0 I AC (i ) (6) N MAX 2 PSNR ( I AC , I sAC ) 10 log10 I AC I sAC 2 F (7) In addition to the abovementioned quantitative evaluation based on pixels, to assess image quality in a more clinical situation, two clinical radiologists were invited to do a blind reader study according to the image quality. 2.3. Data acquisition and training setting In our study, forty-five sets (26 males and 19 females, total 22,000 slice images) of the clinical lymphoma patients were acquired by using a commercial GE Discovery PET/CT 690 scanner. A routine dose of 3.7 MBq/kg FDG was administered intravenously after fasting for at least 6 hours. Imaging was obtained 60 min after injection from the skull basis to the mid-thigh on a Discovery 690 PET/CT scanner with standard CT parameters (120 mA, 120 Kv, 3.8 mm thickness, 3 min per bed). We randomly selected 20,000 slice images (with a size of 256*256) from total anonymous slices as our training dataset and 2,000 slices as our test dataset. The proposed WGANs was normally trained with the Adam optimizer, the learning rate was set to 0.00001 and the batch size was set to 8 based on our available memory. The following hyperparameter were employed to train networks: 0 =0.0001 , mse 1 , gdl 1 according to experimental experience. We applied TensorFlow to implement our network models with a GTX 2080Ti GPU, and it took approximately 28 h for network training convergence. 3. Results & Discussion As shown in Figure 2, due to the attenuation effect and scattering effect of photon, there is a large amount of random noise in the NAC PET image, and the image quality is much poor, which is inapplicable to clinical application and theoretical research. Figure 2. Relevant qualitative outcomes of one patient under cancer therapy. The dashed lines with red colour in figure above indicate the two profiles displayed in Figure 3. However, the sAC PET image estimated with the proposed deep learning-based approach by NAC PET image have clear boundaries among tissues and organs, qualitatively similar to the ground truth 4
ICAACE 2021 IOP Publishing
Journal of Physics: Conference Series 1848 (2021) 012006 doi:10.1088/1742-6596/1848/1/012006

both in noise removal and image uniformity. Also, we also analyzed the profile of the generated AC
PET image, NAC PET and AC PET image in Figure 3. In addition, the proposed method
quantitatively gains a normalized mean error (NME) of 5.02% ± 2.30% and a mean peak signal-to-
noise ratio (PSNR) of 40.651 ± 1.392 during the test stage, which also demonstrate the effectiveness
of the proposed algorithm to some extent.
 Table 1 show that sAC PET images synthesized with the proposed deep learning-based technique
by NAC PET image are much identical to the ground-truth in denoise level, and almost close in
comprehensive quality and diagnostic accuracy.

 Table 1. Quality score (mean ± STD) comparisons of the two types of images by two clinic
 radiologists. The higher score in the table denotes much better image quality.
 Metric/Image NAC PET AC PET sAC PET
 Denoise level — 10 10.00 ± 0.00
 Comprehensive quality — 10 9.55 ± 0.43
 Diagnostic accuracy — 10 9.62 ± 1.41

 The NAC PET image profile (Activity Concentration Bq/ml) have a large gap compared to the true
AC PET image profile, as shown in Figure 3. On the contrary, sAC PET image estimated with the
proposed technique matches the true AC PET profile better as a whole.

 Figure 3: The figure presents the profiles (Activity concentration Bq/ml) of the AC PET image (NAC
 PET and sAC PET image) marked with red dashed lines in Figure 2.

 Although we have achieved favourable results as shown above in qualitative and quantitative
analysis, there still are some flaws needed to be improved: First, the proposed approach is based on a
2D networks, which cannot enable to solve the discontinuity problem among slices. Second, there are
some obvious overestimations of activity concentration in some tissues, such as liver, as shown in
Figure 2. This may be due to our insufficient dataset and unperfect network design to a large extent.
However, the proposed algorithm provides an alternative to perform PET image attenuation correction
on the whole.

 5
ICAACE 2021 IOP Publishing
Journal of Physics: Conference Series 1848 (2021) 012006 doi:10.1088/1742-6596/1848/1/012006

4. Conclusions
In the article, we have introduced a direct deep learning-based technique to synthesize AC PET images
by making full use of NAC PET images. To better refine output image, residual blocks and multiple
loss functions consisted of adversarial loss, GDL and MSE are applied in our network. According to
the qualitative and quantitative study, synthetic AC PET images are closed to the real AC PET in
denoise level and overall quality, indicating that the proposed approach has great potential to enable
deep learning-based PET AC technology in the future.

References
[1] M. Hofmann, B. Pichler, B. Scholkopf, and T. Beyer, “Towards quantitative PET/MRI: a review
 of MR-based attenuation correction techniques,” Eur J Nucl Med Mol Imaging, vol. 36
 Suppl 1, pp. S93-104, Mar, 2009.
[2] D. Andreasen, K. Van Leemput, and J. M. Edmund, “A patch-based pseudo-CT approach for
 MRI-only radiotherapy in the pelvis,” Med Phys, vol. 43, no. 8, pp. 4742, Aug, 2016.
[3] T. Huynh, Y. Gao, J. Kang, L. Wang, P. Zhang, J. Lian, D. Shen, and I. Alzheimer's Disease
 Neuroimaging, “Estimating CT Image From MRI Data Using Structured Random Forest and
 Auto-Context Model,” IEEE Trans Med Imaging, vol. 35, no. 1, pp. 174-83, Jan, 2016.
[4] X. Han, “MR-based synthetic CT generation using a deep convolutional neural network method,”
 Med Phys, vol. 44, no. 4, pp. 1408-1419, Apr, 2017.
[5] D. Nie, Roger. T, Caroline. Petitjean, S. Ruan and D. Shen, “Medical Image Synthesis with
 Context-Aware Generative Adversarial Networks,” Med Image Comput Assist Interv, vol.
 10435, pp. 417-425, Sep, 2017.
[6] Van Hemmen H, Massa H, Hurley S, Cho S, Bradshaw T and McMillan A 2019 A deep learning-
 based approach for direct whole-body PET attenuation correction. J Nucl Med 60

 6
You can also read