Thermal Infrared Hyperspectral Imaging of Methane Landfill Emissions
←
→
Page content transcription
If your browser does not render page correctly, please read the page content below
Thermal Infrared Hyperspectral Imaging of Methane Landfill
 Emissions
 Jean-Philippe, Gagnon.
 Telops

 Summary
 Methane (CH4) and carbon dioxide (CO2) are landfill gas (LFG) originating from the
 decomposition of organic material as encountered in landfill areas. Both are also considered
 greenhouse gas due to their high propensity in absorbing and emitting infrared radiation. For this
 reason, landfill installations are often equipped with wells and pumping systems to collect these
 LFG. Depending on the quality of the gas mixture, the gases might turn out to be collected, flared
 or simply dispersed in the atmosphere through passive methane vents. In some situations, gas
 leaks may occur on the site. In such circumstances, the wells, the tubing system or landfill liner
 integrity might be responsible for the undesirable methane emanations on site. In the case where
 lateral migration occurs, the gas leaks may even occur on properties located in the landfills’
 neighborhood. These situations are difficult to address since large areas need to be surveyed.
 Several gas measurement techniques are currently available. Gas sampling using pressurized
 canister vessels or bags provides accurate results, even at low concentrations, but is time
 consuming since the samples need to be taken into a lab. Electrochemical cell sensors, also
 known as gas sniffers, provide accurate real-time results. Conventional gas measurement
 techniques typically provide single-point results and their use to locate an unknown gas leak within
 such large area is not suitable. In order to illustrate how thermal infrared hyperspectral imaging
 performs in landfill environments, results from diffuse methane emissions are presented. Real-
 time chemical imaging results, carried out on a passive methane vent, are also presented. The
 results illustrate how thermal infrared hyperspectral imaging systems provide valuable information
 to survey methane gas in landfill areas.

 Theory
 It is well known that carbone dioxide (CO2) is a strong greenhouse gas however, methane (CH4)
 has a mass-based greenhouse warming potential (GWPs) 86 times more effective than CO2 on
 a 20-year timescale1. All objects spontaneously emit infrared radiation in the longwave infrared
 (LWIR) spectral range (8-12 μm) under ambient conditions. For infrared-active molecules like
 methane, the absorption/emission of infrared radiation occurs in a very unique fashion as a
 function of energy (or wavelength). This absorption/emission spectrum often refers to the infrared
 spectral signature. Figure 1 depicts the methane spectral signature in the LWIR. The most
 prominent spectral features are located around 1306 cm-1 or 7.65 µm.

GeoConvention 2021 1
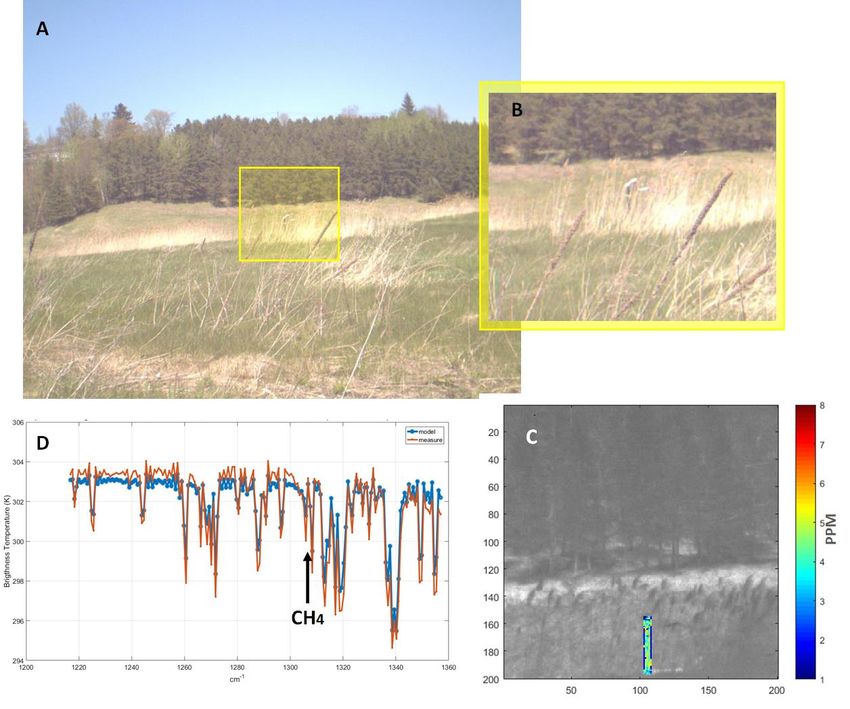
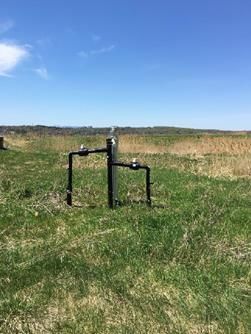
Figure 1: LWIR infrared spectrum of methane.

 For the work presented below, we were fortunate to work with the city of Sherbrooke’s department
 of urban infrastructure to illustrate how thermal infrared hyperspectral imaging performs in landfill
 environments. The data was collected on a former landfill site in Sherbrooke. The site is equipped
 with a biogas collection system. Erreur ! Source du renvoi introuvable. presents some images
 taken on the site. The camera was used to record images all around the site of exposed
 equipment parts susceptible of leaking methane.

 Figure 2: Pictures taken during the data collection campaign on the landfill site.

GeoConvention 2021 2
In this work, ground-based standoff thermal infrared hyperspectral imaging is presented as an
 alternative technique to survey methane emissions in landfill areas. The next sections will present
 the camera used as well as the two data analysis techniques. The first one is an algorithm capable
 of providing real time results for localized emissions while the second is capable of achieving
 higher sensitivity in the case of diffuse methane emissions.

 Method

 The camera used for this experiment was the Hyper-Cam Methane, a unique, high performance,
 thermal hyperspectral imaging camera for the detection and identification of methane (CH4) gas
 leaks and emissions.

 Figure 3: Hyper-Cam Methane focused on a sensing entry point of the methane collection

 Workflow

 The first step to present real time gas emissions imaging is to detect and identify the substance.
 This is accomplished using Telops Reveal DI software which allows for chemical imaging of
 multiple gases simultaneously on an interactive interface (refer to Figure 4). The Reveal DI
 software uses a powerful and specialized generalized likelihood ratio algorithm (GLRT) to detect
 and identify the gas’ signature.

GeoConvention 2021 3
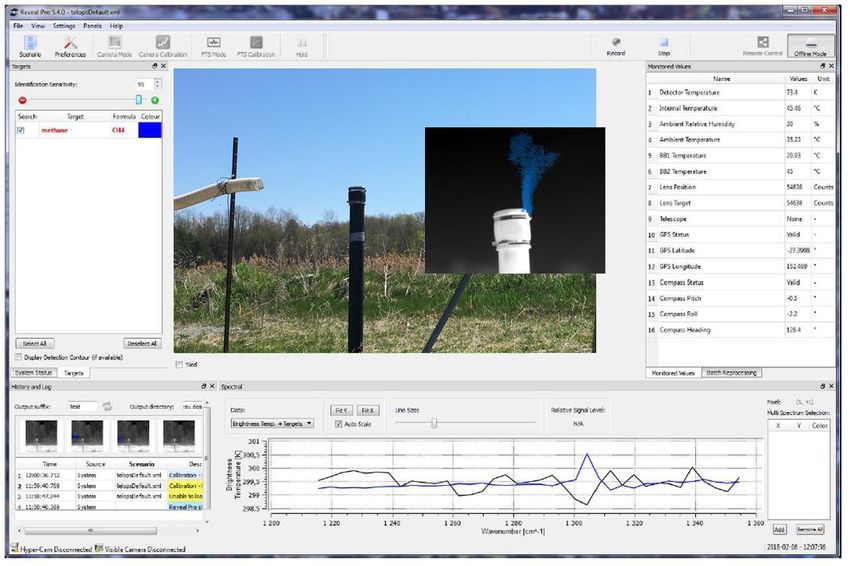
Figure 4: Reveal Detect and Identify (D&I) Software showing methane escaping from an
 opening made in the sensing entry point of the methane collection pipe system.

 The second step is to produce the column path concentration map of the gas plume (in units of
 ppm·m) from the acquired spectral radiance datacube. This is accomplished using a rapid gas
 quantification retrieval algorithm. At its core lies a physical radiative transfer model. More
 precisely, by the Beer-Lambert-Bouguer’s law, the total radiation from a pixel in the gas plume
 measured by the camera can be expressed as:

 Equation 1.

 Whereas the total radiation from a pixel outside the gas plume is:

 Equation 2.

 where:
 = Radiance measured by the camera
 = Transmittance of the gas
 = Transmittance of the atmosphere
 = Radiance of the gas plume at the temperature of the gas T_gas
 = Radiance emitted by the atmosphere
 = Radiance from a pixel outside of the gas plume

GeoConvention 2021 4
By making assumptions such as a constant plume temperature across the column path, a
 localized gas plume and a gas plume temperature equal to the atmospheric temperature, it is
 possible to solve for and thus obtain the gas concentration values.

 Equation 3.

 It is worth noting that the algorithm uses the brightness temperature of strong water vapor spectral
 lines to estimate the atmospheric temperature ( . A principal component analysis (PCA) is
 performed on the image to help select background pixels and thus estimate . Homogeneous
 media are characterized by constant spectral absorption coefficients. Consequently, the light
 transmittance through a layer of such media having a thickness , a concentration and an
 absorption cross-section α is expressed as:

 Equation 4.

 Equation 4 imposes an important limitation to any retrieval procedure. Since the transmittance of
 any layer depends, for each gas species, on the product , called the column density, this product
 remains indivisible. For this reason, the results are quoted in path length units or ppm x m.
 Assuming spherical symmetry of the plume it is possible to estimate local concentrations in units
 of ppm. Knowing the nature of the gas, its extent as well as the specifics of the camera (field-of-
 view, distance to the gas plume), the concentration results can be expressed as total gas mass
 in units of grams3,4.

 Finally, the gas mass flow rate (F) is determined using both the total gas mass (m_gas) per area
 and the mean gas flow velocity (v_gas) assuming the wind direction is orthogonal to the camera
 viewing direction.

 Equation 5.
 = ×

 The mean gas velocity can be approximated as the wind measurement values obtained from
 nearby meteorological stations.

 When the gas emissions are diffuse in nature, there is no singular point of emission and the gas
 tends to occupy a large portion of the image. These facts make it difficult for the GLRT algorithm
 described above to detect its presence. Hence, to analyze those measurements we rely on a
 more involved algorithm. Moreover, by processing hyperspectral data offline, we are not as
 concerned by processing speed and can therefore forgo the assumptions made in the section
 above and tackle equation 1 head on. Equation 1 provides the framework to calculate the spectral
 radiance entering the camera.

 The goal of the whole offline quantification algorithm which can be described as an optimization
 approach is to minimize the difference between the measured radiance spectra acquired by the

GeoConvention 2021 5
camera and the theoretical radiance calculated through the radiometric model of Equation 1, as
 described in Tremblay et al.2. The gas concentrations, plume temperature are allowed to vary
 until the system finds the perfect match in an iterative fashion. Once the path length results are
 obtained, the total gas mass as well as the gas mass flow rate (F) can be determined using the
 method described in the previous section if the gas leak is localized. If the leak is diffuse, i.e. there
 is no single gas emission point, it is difficult and sometime impossible to calculate a flow rate.
 Results From Fugitive Gas Emissions
 In order to demonstrate the capabilities of the technique upon arrival to the site, we focused on
 an exposed pipe (#57) part of the methane collection piping system (refer to Figure 2). For this
 initial demonstration test, the pumping in that specific portion of the biogas collection system was
 voluntarily interrupted. In normal operation, methane is not leaking from the pipe.

 In this case the camera was positioned 5m from the pipe. Figure 5 presents a sequence of 3
 consecutive infrared measurements overlayed with the detected methane plume colored in pink
 identified in real time by the software. The bottom row of Figure 5 presents the calculated methane
 path length concentration images for the corresponding measurements. We observe
 concentrations varying from a few hundreds of ppm·m to upwards of 2000 ppm·m. This approach
 works well in this scenario even though methane is an atmospheric constituent because the
 concentration of methane emissions is far more important than atmospheric methane.

GeoConvention 2021 6
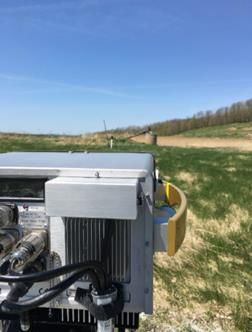
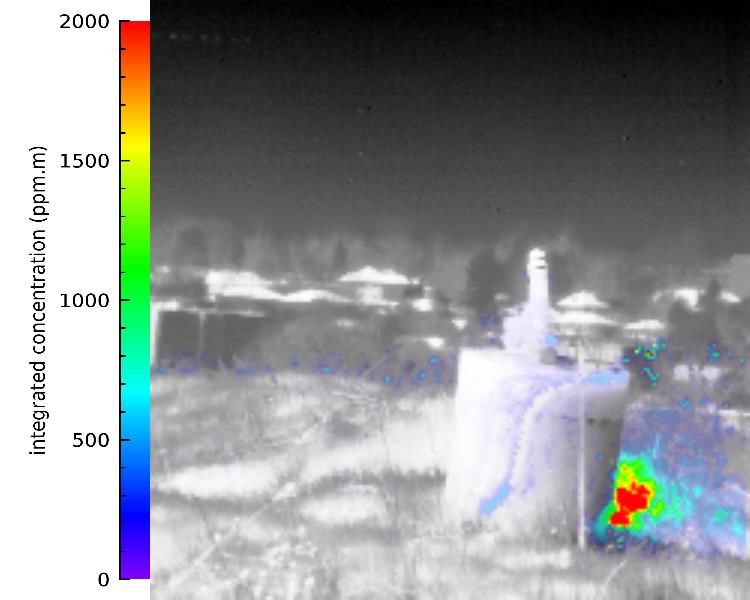
Figure 5: Top: Sequence of 3 consecutive measurements showing methane plume in pink.
 Bottom: Sequence of the same 3 measurements showing the calculated methane path length
 concentration map in units of ppm·m.

 From the known specifics of the camera (field-of-view, distance to the gas plume) and the column
 path concentration results, the total gas mass contained within a specified area of the image is
 calculated. Assuming that the gas velocity is equal to the wind speed, we can calculate a gas flux
 as a function of time, refer to Figure 6. The solid blue line assumes a wind value of 2.2 m/s while
 the shaded areas are bounded using minimum and maximum wind gusts values corresponding
 to that time period.

 Figure 6: Methane flux as a function of time since beginning of the test on pipe #57.

 A survey of several point of interest on the site revealed methane emissions near a concrete
 cylinder collection point. Figure 7 presents an infrared measurement overlayed with the detected
 methane plume in blue and the calculated methane path length concentration image. In this case,
 the rapidly changing wind conditions made it difficult to obtain a gas flux values as a function of
 time.

GeoConvention 2021 7
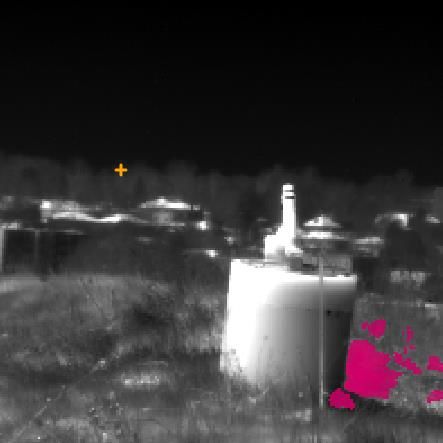
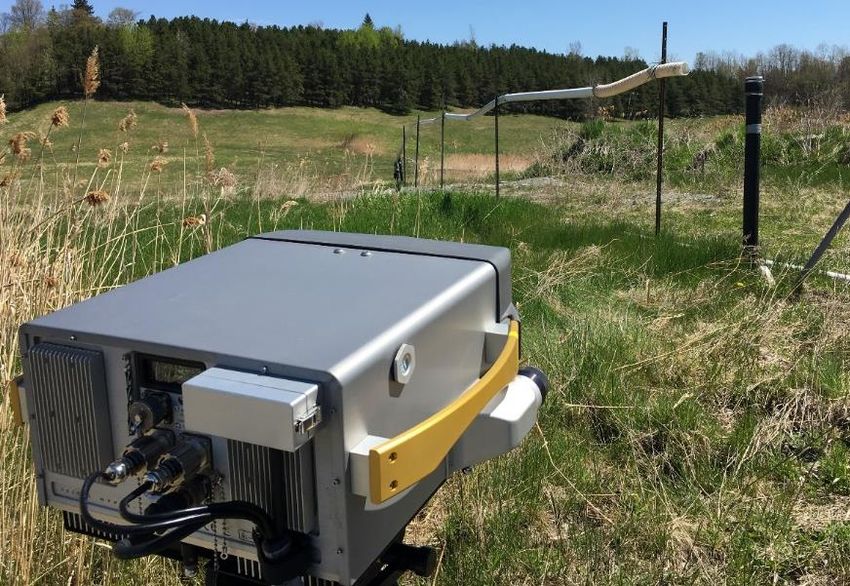
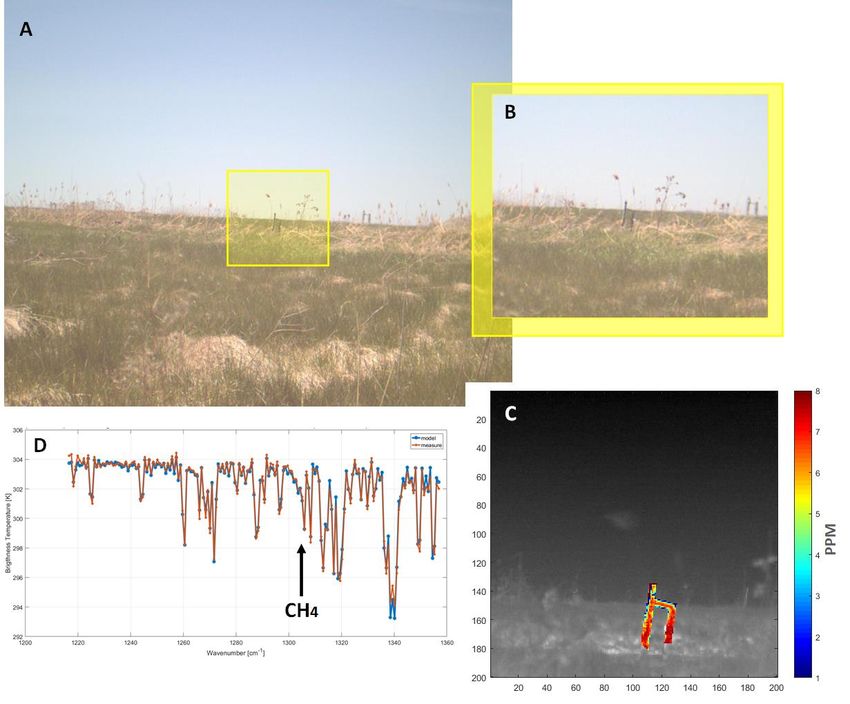
Figure 7: Right: Infrared measurement overlayed with the detected methane plume in blue. Left:
 Methane path length concentration image.

 Results From Diffuse Gas Emissions

 Diffuse methane emissions were measured in the landfill area. Efficient survey of large areas, on
 the order of hundreds of square meters, can be carried out from the same location. In this case,
 the surface of the pipe provides an excellent background against which we can determine the
 diffuse methane concentration between the camera and the pipe. As shown in Figure 8, the
 average methane concentration in the landfill area was found to be more than 3-4 times higher
 than the global mean ambient methane concentration (1.9 ppm) normally measured at ground
 level 5. As indicated in Figure 8 D, the low residuals between measurement and model gives us
 confidence in the retrieved methane concentration values. The results of a similar analysis
 performed on a different part of the site are presented on Figure 9. Methane concentrations are
 found to be little lower than those of the previous site but still higher than normal atmospheric
 value. The residuals are not as good as those of the previous site. This may be due to the
 presence of vegetation just in front of the pipe which affects the signal measured by the camera
 and thus may negatively impact the signal to noise ratio.

GeoConvention 2021 8
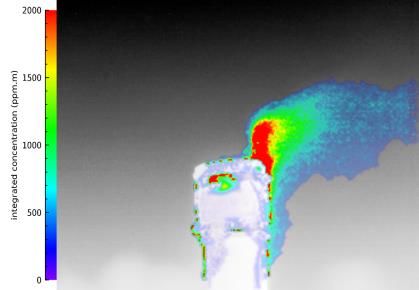
Figure 8: A: Visible image captured from the position of the Hyper-Cam showing the field and an
 exposed portion of the piping system 52m away. B: Closeup image of the pipe. C: IR image of
 the pipe overlayed with the methane concentration map. Each pixel is being processed
 independently of the others. D: Typical infrared spectrum of a pixel associated with methane
 diffuse emissions as measured with the Hyper-Cam-LW sensor (red curve) and the spectrum of
 the best fit model (blue curve). The rms residuals are of the order of 0.3 K. Black arrow points to
 the location of the most prominent spectral feature of methane.

GeoConvention 2021 9
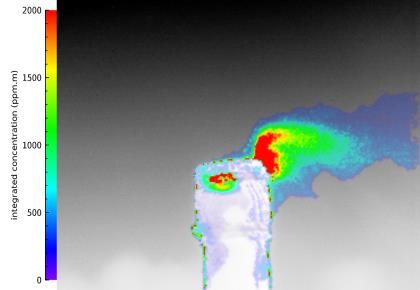
Figure 9: A: Visible image captured from the position of the Hyper-Cam showing the field and an
 exposed portion of the piping system 52m away. B: Closeup image of the pipe. C: IR image of
 the pipe overlayed with the methane concentration map. Each pixel is being processed
 independently of the others. D: Typical infrared spectrum of a pixel associated with methane
 diffuse emissions as measured with the Hyper-Cam-LW sensor (red curve) and the spectrum of
 the best fit model (blue curve). The rms residuals are of the order of 0.4 K. Black arrow points to
 the location of the most prominent spectral feature of methane.

 Conclusion
 We have demonstrated the usefulness of thermal infrared hyperspectral for landfill
 characterization of both fugitive and diffuse methane emissions. This approach allows survey of
 large areas without any prior installation of any particular setup as it relies on the strong infrared
 self-emission of methane in the LWIR. The temporal resolution combined with the selectivity
 provided by hyperspectral imaging allows efficient characterization of gas leak situations which
 can be useful to locate fugitive emissions in landfills. Standoff thermal infrared hyperspectral

GeoConvention 2021 10
imaging represents an interesting alternative to the conventional tools used for landfill
 characterization.

 Acknowledgements
 We would like to thank the city of Sherbrooke and Bruno Marin for their collaboration on this
 project, it is greatly appreciated.

 References
 1 Stocker, T.F., et. al., IPCC, 2013. The Physical Science Basis. Contribution of Working Group I to the Fifth
 Assessment Report of the Intergovernmental Panel on Climate Change, Cambridge University Press, Cambridge,
 United Kingdom and New York, NY, USA, 1535 pp, doi:10.1017/CBO9781107415324.

 2 Tremblay, P., et. al., Standoff gas identification and quantification from turbulent stack plumes with an imaging Fourier
 transform spectrometer; Proceedings of SPIE - The International Society for Optical Engineering. Vol. 7673, no.
 10.1117/12.850127, 2010.

 3 Savary, S., Tremblay, P., Villemaire, A., System and method to remotely measure the directional velocity map of
 gaseous emissions; U.S. Patent pending 61/332,260, 2010.

 4 Savary, S., Gagnon, J.-P., Gross, K., Tremblay, P., Chamberland, M., Farley, F., Standoff identification and
 quantification of flare emissions using infrared hyperspectral imaging; Proc. SPIE 8024, Advanced Environmental,
 Chemical, and Biological Sensing Technologies VIII, 80240T, 2011.

 5 NOAA Global Monitoring Laboratory Website page. See https://www.esrl.noaa.gov/gmd/ccgg/trends_ch4/ (accessed
 May 2021).

GeoConvention 2021 11
You can also read