FUEL EFFICIENCY BASED ON ECO DRIVING INFORMATION SYSTEMS
←
→
Page content transcription
If your browser does not render page correctly, please read the page content below
FUEL EFFICIENCY BASED ON ECO DRIVING
                    INFORMATION SYSTEMS

                              Dr. Philipp Gilka, Dr. Maria Staubach*

German Aerospace Center (DLR), Institute of Transport Research, *Institute of Transportation
Systems
Rutherfordstr. 2, 12489 Berlin, Germany
phone: +49-30-67055-286, fax: +49-30-67055-283
philipp.gilka@dlr.de
maria.staubach@dlr.de

Abstract
The European Commission (EC) has defined the objective to reduce carbon emission in transport by
at least 60% compared to the year 1990. Until 2020 the increase of CO2 emissions shall be limited to
8% [1]. Therefore the EC is funding research projects which are dealing with eco-
assistant/information systems such as the within the EU co-funded 7th Framework eCoMove project
(Cooperative Mobility Systems and Services for Energy Efficiency) eCoMove. Based on in-vehicle
but also cooperative systems such as dynamic eco-navigation, dynamic eco-guidance or other systems
that support eco driving, which addressing route choice, velocity profile and traffic control
information enable the driver to a more eco-friendly driving style which shall result in reduced fuel
consumption. . In order to reach the envisaged goal it is very important that the systems are accepted
by the driver and that driver comply with the system’s recommendations.
Different methods, such as field trials, driving simulator studies and microscopic network simulations
have been applied to verify and validate different applications with the main goal to assess the impacts
of eco driving support systems on potential reduction of fuel consumption and carbon emission.
The current paper provides an overview of the methodology used to validate the implemented tools
and the findings of the conducted studies.

Introduction
Advanced in-vehicle information based on cooperative systems shall enable the driver to better
comply with energy efficient driver behaviour.
Dynamic eco-navigation integrates i.e. the information from the traffic centre, from other vehicles,
and different other sources in routing and guidance functionalities. This application not only helps the
driver to find the least fuel consuming route but also dynamically adjust the route to changes in the
road network and traffic load, as well as guides the driver on the best lane for as low as possible fuel
consumption. Eco-driving support systems additionally provide dynamically suggestions to the driver
how to drive eco-friendly depending on driving traffic situation – location – road – environment by

                                                                                                      1
addressing the driver’ driving style and the driver’s motivation. Therefore the systems support the
drivers suggesting for example appropriate speeds, gears acceleration or deceleration manoeuvres.
The integrative approach of the eCoMove project consists of different sub-systems which assign pre-
trip, on-trip and post-trip information to the user [2]. All applications developed are targeting the
identified vehicle and traffic inefficiencies [3]. These inefficiencies, along with the use cases defined
for the applications, were addressed during a variety of studies. Three types of methods were used to
validate the application of eco driving support systems performance:
1. Real-world field trials
2. Driving simulator studies
3. Microscopic traffic network simulations
The great amount of data captured in these studies provides a good overview of the impacts of such
systems.
Methodology
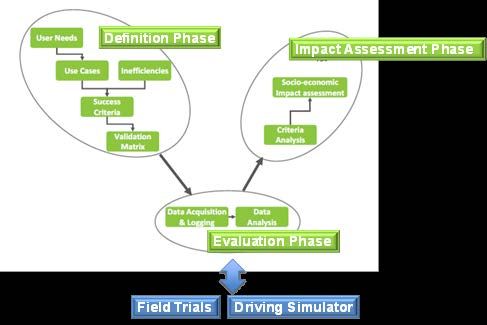
The validation methodology of the eCoMove project is based on FESTA evaluation guidelines [4]
developed in FP7 research project, which follow a coherent methodology structured in three main
phases, i.e., definition, evaluation and impact assessment [see Figure 1].
Figure 1 - Evaluation Methodology
FESTA proposes a stringent approach within the definition phase. The first major step of this
approach is the detailed formulation of the research questions which are mainly based on the set
2identified inefficiencies in terms of transport. Objectives and research questions may then affect
different impact categories i.e.:
1. Environment
2. Mobility
3. Driver Behaviour
a. Driver Performance
b. Safety
c. Acceptance
d. Compliance
Based on the projects objectives research questions have been defined and hypotheses with relevant
success criteria were derived as thresholds for the indicators [5]. Indicators and their adequate
measurement method allow then to answer the hypothesis and their respective research questions (see
Figure 2).
Research Performance
Objectives Hypotheses
Questions Indicator
Figure 2 - Definition Phase 1
Following this, scenarios use cases and test setups were designed to be able to answer the research
questions by acquiring data from the field, the simulator and network simulation.
With the definition of success criteria and the consideration of situational variables the test setups provide
a sufficient amount and quality of data to analyze and assess the single tools and overall system in detail.
Validation scenarios and test cases with a high potential for the reduction of fuel consumption (i.e.
scenarios in which inefficiencies are clearly present) are defined. A conducted literature review showed
that a considerable fuel reduction can be achieved in use cases involving: route choice, velocity profile
and traffic control. These three were considered in aggregated forms and therefore are named Scenario
Clusters in the eCoMove context. For a given validation scenario, there is a set of validation test cases that
assess the success criteria in the different validation categories. On a first attempt, each validation
scenario will determine the performance indicators and test method used for the measurement of each
indicator, the set-up of the test (e.g. test site, route, traffic conditions, etc.), the story board, the data to be
logged and the number of runs needed.
Each test case is then examined with different test setups in order to analyze different applications in
similar conditions. Each test setup defines different measurements eligible to derive performance
indicators required for each test case.
3Several test cases are clustered in validation scenarios that describe general conditions of the test cases.
According to the kind of support for the driver all validation scenarios are grouped into three Scenario
Clusters: PreTrip, OnTrip and PostTrip. The general structure proposed for each scenario cluster is
presented in the following Figure 3:
Scenario
Cluster
Validation
Scenarios
Use Case(s) Validation Applications
Description Objective
covered Category covered
Test Cases
Performance Summary of test
Description Hypothesys Succes Criteria Indicators. procedures
(Minimum set to (checklist)
be covered)
Test Procedure
Test Setups
Responsible Participant Software
Method Location
partners components used
Hardware Experimental
Route description Baseline Control factors
description setup
Situational Performance Sensors and data
Measurements
Variables Indicators loggers
Figure 3 - Definition process of validation scenarios
The scenarios were classified in 3 main clusters in order to have groups of applications with points in
common regarding the validation process.
Following this approach, these 3 clusters were classified:
Cluster 1: Pre-trip
Cluster 2: On-trip
Cluster 3: Post-trip
Finally, there have been more than 80 test setups defined which result in a large amount of measured
data that have been collected. These data were then used to calculate the performance indicators
adequately to the focused impact categories. The follow up action was a detailed statistical analysis of
the performance indicators. To illustrate the range of efficacy of the performance indicators, BoxPlots
have been applied. A comment window at the end of the table allows to state remarks and first pre-
assessments [Figure 4].
4Figure 4 Analysis Template
The detailed statistical analysis of the performance indicators provides a very good picture of the test
setup within the focused impact categories. But this picture is also limited to the system and
technology applied and the testing environment. However, it provides no overall result. Therefore the
main objective of the assessment strategy was to find a harmonized approach being able to compare
the different studies with its specific circumstances (as encountered in the tests) to finally avoid
misinterpretation of the results. A descriptive analysis by considering mean values, standard
deviations, medians as well as the effect sizes was conducted. The t-test showed then, if a significant
differences between the treatment and baseline trial could be detected.
Test Setup Design
Different trials have been designed to evaluate the potential impact of eco driving support systems on
fuel consumption and CO2 emissions. The following Table 1 presents the performance indicators and
their relevant unit that have been considered for data acquiring and analysis:
5Table 1: eCoMove Performance Indicators (subset)
ECOM-PI Description Unit
Environment 101 Fuel consumption reduction of passenger car %
102 CO2 reduction of passenger car %
103 Fuel consumption reduction of truck %
104 CO2 reduction of truck %
Although fuel consumption and CO2 are directly correlated The design of the test setup varied in the
test route characteristics to identify routes with the highest potential: i.e. urban, rural or mixed routes,
traffic lights, roundabouts but also the route length. Furthermore, the number of test participants
differed between the testing methods. A large difference was mainly between the driving simulator
studies and the field trials. The main reason for that was because of the costs and the fact that only
employees were allowed to drive with the companies’ trial vehicle.
Results
The impact assessment of the eco-information systems developed, verified and validated within the
eCoMove-project provides a statistical analysis of different study results with different sample sizes
and different effect sizes [6]. Since the overall validation approach was strictly applied by all test
setups the results of the single studies could be easily compared. No additional effort was necessary to
code and calculate the relevant values.
Within this validation category environment the most important performance indicator fuel
consumption (ECOM-PI-101) was analysed. The following figure gives an overview of the outcomes
from the different studies. Due to internal agreement between the partners the test setups have been
coded for privacy issues. In fact the detailed description of the results provides a very well overview
of the different trial situations and methods used.
The range of fuel consumption reduction for the car studies was between 4.5% and 25.1% while most
of the studies had mean reductions between 10% and 20%. Looking at the different test setups it
becomes obvious, that the fuel consumption reduction was higher on urban streets with many traffic
lights. As shown in the simulator studies one situation with a high fuel reduction potential (more than
20%), which was shown in two different driving simulator studies is a red traffic light which will
switch to green before the drivers arrive when they follow the speed reduction recommendation
beforehand.
6mean fuel changes %
mean fuel changes %
0,0
-2,0
-4,0 -2,4 -2,8
-6,0
-5,8
-8,0
-10,0
-12,0 -10,4
-14,0 -12,0
-13,3
-16,0
-15,3
-18,0
1- urban 2- mixed 3- rural 4- rural / 4- rural / 4 - urban / 5 - motorway
highway highway city urban
n=7 n=2 n=1 n=27 n=22
field simulator
Figure 5 mean fuel reductions in field and driving simulator studies for private cars (%)
Other situations with a very high fuel reduction potential are situations where the drivers have to slow
down because of speed limits, curves or stop signs. However, those situations have been tested only in
the simulator and asked about their subjective impressions many participants felt patronized by the
systems recommendations, especially haptic feedback pedal. As it can be seen, the fuel reduction on
rural roads or motorways was also relatively low. The reason for that was that the applied system does
primarily have an effect on urban roads with several traffic lights.
Several eCoMove applications require a certain penetration rate to take effect; these applications were
simulated in network simulations rather than demonstrated in reality. The summarized results of the
realized traffic network simulations were the basis for the comparison with the results of the field and
driving simulator studies.
The following applications were researched within the project:
- Traffic Signal Control (dynamic green waves, cooperative traffic lights, balanced priority)
- Network Usage (analyse the accuracy of actual, predicted and desired traffic states of the
traffic network i.e. flows, speeds and travel times, and analyse the effects of using traffic
strategies derived from these states
- Driving Behaviour (ecoInformation, ecoApproach, etc.)
- Route Guidance
- ecoMM (Motorway, On-Ramp-Meter)
7In their vast majority the simulation results confirmed the expectations especially concerning the
reduction of CO2 emissions ranging up to (and sometimes beyond) ten percent. Some notable side
effects were discovered, the major one being that the eCoMove applications Green Wave and
Approach Advice do not work together.
In detail, the eCoMove applications in the field of traffic signal control showed good results
concerning the reduction of CO2 emissions. The eCoMove applications for traffic management and
control showed an average reduction of emissions exceeding ten percent through better traffic
distribution. Also, eCoMove driving behaviour support was found to reduce CO2 emissions and in
this sense also fuel consumption. In parallel, the eCoMove route advice was seen to reduce CO2
emissions in the lower one digit percentage range.
In detail, the eCoMove applications in the field of traffic signal control showed good results
concerning the reduction of emissions.
Discussion
The comprehensive approach of emission reducing measures is very innovative and requires a variety
of methods to validate the outcome. eCoMove followed this requirement by applying three different
methods which realize validated results.
In most of the studies the application of eco driving support systems might be a good approach to
strengthen the driver’s awareness and the willingness to save fuel. Within the trial studies it became
apparent that it is highly dependent on the driving situations how much fuel could be saved. Situations
with the highest potential were often in urban surroundings (speed limit 50 – 70 km/h) at traffic lights.
Especially when approaching a red traffic light, which was about to switch to green, the information
through an eco-driving support system, which is capable of communication with the traffic light,
could lead to great fuel reductions close to or in some cases even above 20%, depending on the
recommended target velocity. Using these mechanisms unnecessary deceleration and acceleration and
therefore unnecessary stops could be reduced substantially. In other situations it is questionable in
which driving situations the drivers should be supported. There were some situations, e. g. curves,
stop signs or roundabouts where the drivers were a little bit more sceptical about the support. A better
quality check and approval of the information management within the on-board systems needs to be
implemented for further studies.
The results of the microscopic traffic network simulations also show beneficial effects of network
related applications on the reduction of CO2-emissions of the whole network. The range of the
emission reductions seemed to be in a similar range as the results of the field and driving simulator
studies.
8The conducted studies finally provide a very good picture of the potential benefit of cooperative ITS
systems to reduce fuel consumption and CO2 in transport.
Acknowledgements
This work is part of the eCoMove (Cooperative Mobility Systems and Services for Energy
Efficiency) Integrated Project co-funded under the 7th RTD Framework Programme,
Information Society and Media Directorate-General (FP7-ICT-2009-4) – grant agreement
n°247978. For more information please go to http://www.ecomove-project.eu
The authors would like to thank all project partners for their contribution to the success of the project
and especially those, who conducted all the test trials and provided their useful data for the impact
assessment of eCoMove.
References
[1] European Commission (2011). White paper: roadmap to a single European transport
Area – towards a competitive and resource efficient transport system. http://eurlex.
europa.eu/LexUriServ/LexUriServ.do?uri=COM:2011:0144:FIN:EN:PDF
[2] Deliverable D3.1 ecoSmartDriving Use Cases & System Requirements, eCoMove project,
available @ www.ecomove-project.eu
[3] Deliverable D 2.1 of the eCoMove project, available @ www.ecomove-project.eu
[4] FESTA Handbook, available @ http://www.fot-net.eu/download/festa_handbook_rev4.pdf /
http://wiki.fot-net.eu/index.php?title=FESTA_handbook_Introduction
[5] Isasi, L., Rodriguez, T., Larburu, M., Urquiza, A., Blanco, R., Mejuto P. (2011): Validation and
evaluation plan, Deliverable D6.2 eCoMove 2011
[6] Gilka, P. Staubach, M., Hoeltl, A., Kirchner, U. (2014): eCoMove Assessment Results, D6.4
eCoMove 2014
910
You can also read