Exploring the Relationship between Care Homes and Excess Deaths in the COVID-19 Pandemic: Evidence from Italy - IZA DP No. 13492 JULY 2020
←
→
Page content transcription
If your browser does not render page correctly, please read the page content below
DISCUSSION PAPER SERIES

IZA DP No. 13492

Exploring the Relationship between
Care Homes and Excess Deaths in the
COVID-19 Pandemic: Evidence from Italy

Caterina Alacevich
Nicolò Cavalli
Osea Giuntella
Raffaele Lagravinese
Francesco Moscone
Catia Nicodemo

JULY 2020
DISCUSSION PAPER SERIES

IZA DP No. 13492

Exploring the Relationship between
Care Homes and Excess Deaths in the
COVID-19 Pandemic: Evidence from Italy
Caterina Alacevich Raffaele Lagravinese
University of Oxford Università degli studi di Bari “A.Moro”
Nicolò Cavalli Francesco Moscone
Bocconi University, Nuffield College and University of Brunel London and Università
University of Oxford Ca’ Foscari di Venezia
Osea Giuntella Catia Nicodemo
University of Pittsburgh University of Oxford, CHSEO and IZA

JULY 2020

Any opinions expressed in this paper are those of the author(s) and not those of IZA. Research published in this series may
include views on policy, but IZA takes no institutional policy positions. The IZA research network is committed to the IZA
Guiding Principles of Research Integrity.
The IZA Institute of Labor Economics is an independent economic research institute that conducts research in labor economics
and offers evidence-based policy advice on labor market issues. Supported by the Deutsche Post Foundation, IZA runs the
world’s largest network of economists, whose research aims to provide answers to the global labor market challenges of our
time. Our key objective is to build bridges between academic research, policymakers and society.
IZA Discussion Papers often represent preliminary work and are circulated to encourage discussion. Citation of such a paper
should account for its provisional character. A revised version may be available directly from the author.

 ISSN: 2365-9793

 IZA – Institute of Labor Economics
Schaumburg-Lippe-Straße 5–9 Phone: +49-228-3894-0
53113 Bonn, Germany Email: publications@iza.org www.iza.org
IZA DP No. 13492 JULY 2020

 ABSTRACT
 Exploring the Relationship between
 Care Homes and Excess Deaths in the
 COVID-19 Pandemic: Evidence from Italy
 We explore the relationship between the spatial distributions of excess deaths and care
 home facilities during the COVID-19 outbreak in Italy. Using registry-based mortality data
 (January 1st- March 31st, 2015-2020) for Lombardy, one of the areas hit most severely,
 we estimate that municipalities with care homes present significantly higher excess death
 rates among the elderly (+41%). We find that this effect is not driven by the size of care
 homes and of the vulnerable population that they host. Rather, our results suggest that
 the excess deaths did not occur only within care homes and these facilities acted as one of
 the possible catalysts in the diffusion of COVID-19 in the whole elderly population of their
 surrounding territory.

 JEL Classification: I10, I18, I30
 Keywords: care homes, COVID-19, excess mortality

 Corresponding author:
 Caterina Alacevich
 University of Oxford
 Woodstock Rd
 Oxford OX2 6GG
 United Kingdom
 E-mail: caterina.alacevich@phc.ox.ac.uk
1 Introduction

Official COVID-19-related deaths reached 371,166 across the world by June 1st1. Excess
mortality estimates suggest significantly higher numbers (Faust and del Rio, 2020). The
majority of COVID-19 deaths occurred in long-term residential facilities for personal care and
health assistance (Wang, 2020).

This study estimates the concentration of excess mortality in municipalities with care homes
as local hotspots in the diffusion of the pandemic. We use registry-based daily mortality records
by municipality (comuni) from Lombardy (Italy), among the areas hardest-hit by the pandemic
worldwide. Our identification strategy relies on estimating differences in excess mortality
between municipalities with and without care homes, with respect to the previous five years'
average.

Italy was the first western country to experience a severe COVID-19 outbreak. Preliminary
results from an investigation of mortality in care homes of the National Institute of Health (ISS)
estimate 6,773 COVID-19 fatalities as of April 2020, representing 40% of Italy's total. Those
in Lombardy, in particular, registered a mortality rate of 6.7% against a national average of
3.3% (ISS, 2020). Excess deaths in Lombardy's care homes are at the center of media and
policy attention as well as judicial enquiries for a lack of clear rules on containment practices
such as the reception of patients with COVID-19-related symptoms, testing, availability of
protective gear, and contact with outside visitors.2

Our analyses show that the excess mortality of adults aged 70+ was significantly higher in
municipalities with at least one care home, reaching up to 18 additional daily excess deaths per
100,000 inhabitants by the end of March. On the contrary, we do not find a significant
relationship between the number of beds in care homes and excess mortality. Our findings
show that the result is not driven by the number of vulnerable people resident in care homes,
who are prone to higher mortality risk due to pre-conditions, but by the simple presence of care
homes. This suggests that care homes act as catalysts of contagion. To consider the locally
correlated nature of the pandemic, we estimate a spatial autoregressive model (SAR),

1
 https://covid19.who.int/
2
 https://www.ilpost.it/2020/04/17/regione-lombardia-rsa/

 2
confirming our results. Our work clarifies one of the potential channels behind the observed
association between demographic structure and COVID-19 fatalities (Dowd et al, 2020) and
suggests to consider the presence of care homes in the design of future containment measures
based on local isolation areas.

2 Data

We use death registry data for Lombardy (ISTAT, 2020), which provide daily deaths by age
between January 1st and March 31st, for the years 2015 to 2020, by municipality of residence.
The sample includes 131,040 observations from 1440 municipalities (95% of Lombardy). We
measure municipality-level excess mortality rates as the difference between (daily or total)
deaths per 100,000 individuals by age group between January 1st and March 31st 2020 and
the corresponding 2015-2019 average. Differencing total deaths with respect to previous years
allows us to account for the differential baseline mortality in municipalities with care homes3
(Vandoros, 2020). Another advantage over official COVID-19 deaths is that our measure does
not depend on how deaths are classified. We link this dataset with the location of residential
care homes (RSAs) and nursing homes by municipality.4

85.6% of COVID-19 deaths occurred among the over 70 (ISS, 2020). To account for
differential mortality risks between age groups, we consider separately the 70+, 50-69, and 0-
49. We control for the presence of a hospital, population share above age 70, share of women
by age group, an indicator for the first locked down municipalities, province, and time fixed
effects. Table A1 (Appendix) describes the variables.

Figure 1 illustrates the spatial distribution of care homes and excess mortality rates. Care homes
are present in 34.5% of the municipalities and distributed widely across the region. Excess
death rates present some geographical clustering.

3
 “Care homes” refer to all non-acute residential and nursing facilities that host patients for long-term care
needs.
4
 https://www.regione.lombardia.it/wps/portal/istituzionale/HP/DettaglioServizio/servizi-e-
informazioni/cittadini/salute-e-prevenzione/strutture-sanitarie-e-sociosanitarie/residenze-anziani

 3

3 Empirical Analysis and Results

To investigate the relationship between excess mortality and care homes, we use munipalities
as unit of analysis. In Figure 2, we plot excess daily death rates by age group in 2020 for
municipalities with and without a care home. Before the the first announced COVID-19 case
(February 21st), there was no significant difference. Since the second week of March,
municipalities with a care home exhibited significantly higher excess daily deaths for
individuals aged 70 + (panel 3). By the end of March, they reached up to 18 additional excess
deaths per 100,000 inhabitants. To consider the differential timing of the outbreak, in the fourth
panel we normalize time by the first day in which a municipality recorded a positive excess
death rate after the epidemic onset.

Next, we regress daily excess death rates on the presence of care homes by age group (age) as
follows:

 (1) ℎ , = + + + , + + .
 are days after January 1st-fixed effects, CareHome (0-1) indicates the presence of at least
one care home in municipality m, RedArea (0-1) marks the first complete lockdown for ten
municipalities5 (February 23rd). is a vector of municipality characteristics: presence of a
hospital, population (%) above age 70, women (%) in the age group, and province fixed effects.

 ℎ , is the difference between the daily death rate in m by age group in
2020 and its 2015-2019 average.

Table 1 reports the Results. For the 70+ (column 1), the coefficient of care homes is positive
and significant, with 4.7 excess daily deaths per 100,000 individuals (40% of the mean, 11.64).
For the other age groups (50-69 and 0-49), coefficients are positive but not significant.

Columns 4 and 5 report the estimates of a regression as in Equation 1 but with the number of
beds in care homes instead of their presence.6 The sample includes only municipalities with a
care home. Column 5 further excludes four cases with over 1000 beds, for robustness. The

5
 Bertonico, Casalpusterlengo, Castelgerundo, Castiglione d’Adda, Codogno, Fombio, Maleo, Somaglia, San
Fiorano, and Terranova dei Passerini.
6
 The model includes also hospital beds.

 4
coefficient for care home beds is not statistically significant.7 This suggests that the relationship
with excess deaths goes beyond the size of care homes and of the population that they host.

We confirm the results for people 70+ using total excess death rates as a dependent variable
(column 6). Next, we perform the Moran's I test for spatial correlation in residuals. The statistic
(column 6) is positive and significant, indicating spatial dependence: contiguous municipalities
tend to show similar total excess mortality rates.8 To account for this, we estimate a spatial
autoregressive model (SAR) (Baltagi et al. 2018) for total excess mortality rates. Column 7
reports the results. The spatial autocorrelation adjustment exhibits a statistically significant
coefficient of 0.12. When comparing the coefficient of Care Homes with the OLS model
(column 6), we find that the size declines only slightly (4.27 versus 4.10, a 3% decline). In
Appendix, we report also a difference-in-differences estimation that accounts for fixed
municipality characteristics that may correlate with excess deaths. This specification confirms
our results.

4 Discussion and conclusions

This paper provides evidence of substantially higher excess deaths among the elderly during
the COVID-19 pandemic in municipalities with care homes. The result is economically and
statistically significant also when accounting for spatial correlations.

Previous studies have indicated higher excess infections and deaths among care home residents
in the COVID-19 pandemic (Trabucchi and De Leo, 2020).

Our findings suggest that, rather than this relationship simply being driven by a higher density
of at-risk individuals, care homes catalysed COVID-19 deaths even beyond these residential
facilities. As such, our work clarifies the role of one potential mechanism behind the observed
association between demographic structure and COVID-19 fatalities (Dowd et al., 2020). Our
results suggest also that future containment policies based on municipality-specific isolations
should take into account the presence of care homes. This study has a few limitations. First,
we do not have data on official COVID-19 deaths occurred in care homes, and we rely on the
analysis of excess deaths exploiting municipality-level variation across areas with and without

7
 Using beds per capita does not alter the finding.
8
 The Moran I test is based on the contiguity matrix. We also used other weight matrices. Results are similar and
available upon request.

 5
home care facilities and with respect to the previous trend. Second, we do not have information
on medical pre-conditions which are related with the lethality of COVID-19. Third, we do not
have information on the safety practices adopted by each home care in response to the
pandemic. Although our results may not be generalized to the rest of Italy, care homes may
have played a role also in other regions (at least in the initial phase of the pandemic) as emerged
from the ISS investigation (ISS, 2020). Subject to the availability of data that are currently
lacking, future research may account for specific policy choices adopted during outbreaks,
(Lombardy’s neighbouring region, Veneto, experienced a similar outbreak in terms of initial
numbers and timing but recorded only 1.3% deaths), the prevalence of medical pre-conditions
related to the lethality of COVID-19, and information on each care home's mortality and safety
practices.

 6
References

Baltagi, B.H., Moscone, F., Santos, R., 2018. Spatial health econometrics. In: Baltagi, B.H.,
Moscone, F. (Eds.), Health Econometrics, Contributions to Economic Analysis. Emerald
Publishing. B.

Dowd, J. B., Andriano, L., Brazel, D. M., Rotondi, V., Block, P., Ding, X., Liu, Y. and Mills,
M. C., 2020. Demographic science aids in understanding the spread and fatality rates of
COVID-19. Proceedings of the National Academy of Sciences, 117(18), 9696-9698.

Faust, J.S. and del Rio, C., 2020. Assessment of deaths from COVID-19 and from seasonal
influenza. JAMA Internal Medicine.

Gabriele, S., & Tediosi, F., 2014. Intergovernmental relations and Long Term Care reforms:
Lessons from the Italian case. Health policy, 116(1), 61-70.

ISTAT, 2020. Decessi del 2020. dataset analitico con i decessi giornalieri. Data retrieved
on May 4, 2020, https://www.istat.it/it/archivio/242055.

ISS, 2020. Survey nazionale sul contagio COVID-19 nelle strutture residenziali e
sociosanitarie, Istituto Superiore di Sanità. Epidemia COVID-19, Aggiornamento nazionale:
14 aprile 2020.

Trabucchi, M. and De Leo, D., 2020. Nursing homes or besieged castles: COVID-19 in
northern Italy. The Lancet Psychiatry, 7(5), pp.387-388.

Vandoros, S. 2020, 'Excess Mortality during the Covid-19 pandemic: Early evidence from
England and Wales', Social Science & Medicine.

Wang H, Li T, Barbarino P, et al. Dementia care during COVID-19, 2020. Lancet (London,
England), Apr; 395(10231):1190-1191.

 7
Figure 1: Care homes and excess mortality rates in Lombardy’s municipalities

Panel A: Care Homes

 8
Panel B: Excess Mortality

Own elaborations based on Lombardy region, Ministry of Health, and ISTAT data, 2020.

 9
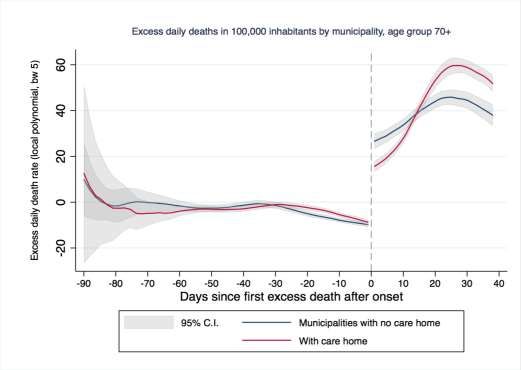
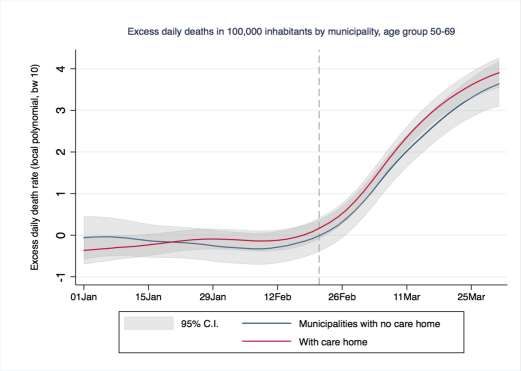
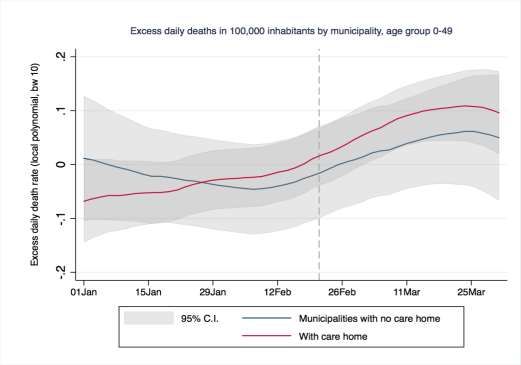
Figure 2: Excess daily death rates in 2020 in municipalities with and without care homes
 Panel 1

 Panel 2

 10
Panel 3

 Panel 4

Own elaborations based on ISTAT, Lombardy, and Ministry of Health data (2020). Panel 4 normalises the number
of days before and after the first excess death recorded in a municipality (day 0), after the pandemic onset.

 Table 1: Regression estimations of excess mortality in 2020 (1 January - 31 March)

 11
OLS SAR

Outcome: Daily excess death rate Total excess death rate

 (1) (2) (3) (4) (5) (6) (7)

Age group 70+ 50-69 0-49 70+ 70+ 70+ 70+

Care home present 4.578*** 0.301* 0.0103 4.27*** 4.100***

 (0.871) (0.164) (0.038) 0.801 (0.810)

Care home beds -0.002 -0.006*

 (0.002) (0.003)

Spatial Weight Matrix 0.120***
 (0.044)

Observations 131,040 131,040 131,040 9,009 8,645 1440 1440

R-squared 0.034 0.004 0.001 0.200 0.196 0.031 0.031

Mean dep. var. 11.64 0.797 0.005 10.19 10.23 10.59 10.59

Std dev. 127.8 31.25 6.834 47.23 47.91 15.78 15.78

Moran I (residuals) 3211.20***
 (0.000)
 667.56***
Wald Test (0.000)

Outcome, columns 1-5: daily deaths per 100,000 inhabitants in 2020 minus 2015-2019 average. Additional
controls: days, province FE; % population 70+, % women in age group, first “red area” municipalities. SE
clustered at municipality level. Outcome in columns 6-7: total excess death rate. *** p
Appendix (not for publication)

 A) Difference-in-Differences

 We estimate a difference-in-differences (DiD) model to investigate the dynamic of COVID-
 19-related excess deaths in relation to the presence of care home facilities, according to the
 following specification:

(2) ℎ , = + + ∑13
 =1( ) + + , + ,

 , , and are municipality, days after January 1st, and week fixed effects. Week w
 indicates the week after January 1st, 2020; CareHome is a dummy variable for the presence of
 at least one care home in municipality m, and RedArea indicates the first isolation measure9.

 The dependent variable, ℎ . is computed as the difference between the
 share of daily deaths on the relative age-group population in 2020 (age) and an average of the
 five previous years’ daily death rate. The coefficients of interest ( ) correspond to the
 interaction of the presence of a care home with each week. This specification allows us to
 include municipality-specific fixed effects, which account for all the time-invariant
 municipality-specific characteristics that may directly or indirectly correlate with death rates
 and may thus generate an omitted variable bias in OLS-based results.
 We plot the Week x CareHome coefficients relative to the 70+ age group in Figure 3A (full
 results are available upon request). Week 8 (vertical dash line) corresponds with the onset of
 the crisis (February 21st). The figure shows that, before the onset of the health emergency
 (week 8), there was no significant difference in excess daily death rates for municipalities with
 a care home and those without. The results indicate that, after the 11th week of the year, which
 began on March 11th, municipalities with a care home registered significantly higher rates of
 excess mortality.

 9
 See Equation 1

 13
Figure 3A: Excess death rate in care homes, DiD coefficients

Additional regressors: a dummy variable for the period after the onset (Feb 21st 2020), a “red area”-dummy
variable for the first ten municipalities on lockdown since February 23rd, days after Jan 1st FE, and week FE.
Standard errors are clustered at the municipality level.

 14
Table 1A. Descriptive statistics
 Variables Obs. Mean St.dev. Min Max Source

 Δ Excess daily deaths (‘00,000) age 70+ 131,040 1.163 12.78 -250 769.23 ISTAT,
 2020

 Δ Excess daily deaths (‘00,000) age 50-69 131,040 0.079 3.12 -95.23 500 ISTAT,
 2020

 Δ Excess daily deaths (‘00,000) age 0-49 131,040 0.0004 0.683 -57.14 138.88 ISTAT,
 2020

 Δ Excess deaths, total (‘00,000) age 70+ 1440 10.59 15.78 -75 148.71 ISTAT,
 2020

 Number of care homes 490 1.40 2.80 1 60 Ministry of
 Health

 Number of hospitals 92 1.33 2.32 1 23 MInistry of
 Health

 Municipality has at least one care home 1440 34.51% 0.475 0 1 Lombardy
 region

 15
Municipality has at least one hospital 1440 6.39% 0.24 0 1 Ministry of
 Health

Number of care home beds by municipality 99 347 940 25 9005 Lombardy
 region;
 Ministry of
 Health

Number of care home beds by municipality (excl. those 95 210.35 164.8 25 831 Lombardy
with >1000) region;
 Ministry of
 Health

Number of hospital beds 116 255.56 753.84 0 7877 Ministry of
 Health

“Red area” (lockdown in first ten municipalities, Feb 131,040 0.26% 0.05 0 1 Ministry of
23rd) Health

Share of women 70+ 1440 0.568 0.032 0.348 0.714 ISTAT,
 2020

Share of women 50-69 1440 0.494 0.024 0.25 0.582 ISTAT,
 2020

Share of women 0-49 1440 0.484 0.020 0.30 0.66 ISTAT,
 2020

Share of population 70+ 1440 0.085 0.019 0.021 0.20 ISTAT,
 2020

 16
You can also read