Supplement of Characterization of carbonaceous aerosols in Singapore: insight from black carbon fragments and trace metal ions detected by a soot ...
←
→
Page content transcription
If your browser does not render page correctly, please read the page content below
Supplement of Atmos. Chem. Phys., 20, 5977–5993, 2020
https://doi.org/10.5194/acp-20-5977-2020-supplement
© Author(s) 2020. This work is distributed under
the Creative Commons Attribution 4.0 License.

Supplement of
Characterization of carbonaceous aerosols in Singapore: insight from black
carbon fragments and trace metal ions detected by a soot particle aerosol
mass spectrometer
Laura-Hélèna Rivellini et al.

Correspondence to: Alex King Yin Lee (ceelkya@nus.edu.sg)

The copyright of individual parts of the supplement might differ from the CC BY 4.0 License.
Text S1: Effects of applying CDCE for rBC an OA on the PMF results

In this work, a constant collection efficiency (CE) of 0.6 was applied to determine refractory black
carbon (rBC) mass concentrations (Willis et al., 2014). To evaluate the potential impacts of applying
chemical dependent-collection efficiency (CDCE) correction for rBC and organic aerosol (OA) on the
PMF results, we first determined the CDCE of rBC by comparing the BC concentrations (denoted as
BCAE33) measured by an aethalometer (AE33, Magee Scientific) and the EC mass concentrations
measured by a semi-continuous OC/EC analyser (Sunset Laboratory). Comparisons between mass
concentrations of our CE-corrected rBC (rBCCE=0.6) with BCAE33 and EC give good Pearson coefficients
of 0.96 and 0.71 and slopes of 0.83 and 1.10, respectively (Figure S3c and d). The histogram of CDCE
determined for rBC using the two co-located instruments are reported in Figure S2b and c. The
logarithmic distributions are centred on ~0.52 (±0.18) for aethalometer-based CDCE (CDCEAE33) and
0.69 (±0.34) for OC/EC-based CDCE (CDCEECOC). Three additional PMF analysis were performed by
applying CDCE for rBC and/or OA, while other PMF setting remains unchanged. The metal ion signals
were corrected to nitrate equivalent mass concentrations by assuming their RIE values equal to 1.

 • Laser-off OA corrected by CDCE that were calculated based on the approach described by
 Middlebrook et al., (2012) (CDCEMid)
 • Laser-on CDCEMid-corrected OA and CDCEAE33-corrected Cn+
 • Laser-on CDCEMid-corrected OA and CDCEAE33-corrected Cn+ and metal ions

Comparisons between the CDCE-corrected results and the corresponding base cases reported in the
main text (i.e., laser-off OA, laser-on OA + Cn+ and laser-on OA + Cn+ + metals) are shown in Table
S4. Note that all PMF runs lead to five-factor solution (i.e., HOA, O-HOA, COA, LO-OOA and MO-
OOA). Below is the brief summary of some major changes:

 • OA fragments as PMF input: The time series of OA factors determined with CDCEMid applied
 are similar to those without correction (i.e., Pearson coefficients > 0.91). Applying CDCEMid
 correction result in 19-27% changes in the mass concentrations of each factor.

 • OA, rBC and metals as PMF input: These modifications of PMF input do not make significant
 impacts on the relative contribution of each factor to the total OA and rBC. Except for the HOA
 factor, its contribution to the total rBC mass decreased from 44% to 33%. The C1+/C3+ ratios
 for MO-OOA are much more sensitive to CDCE corrections (i.e., increased from. 0.29-0.54 to
 1.57-1.67) compared to other PMF factors. Even without applying CDCE correction, the
 C1+/C3+ ratios for MO-OOA varied between 0.29 and 0.54. Due to such large variations between
 cases, in addition to COA, no C1+/C3+ ratios were reported for MO-OOA in the main text.

 2
• The CDCE corrections can affect the contributions of the five metals from each PMF factor to
 their total signals as shown in Table 1. The changes in the contributions of sodium and nickel
 from the LO-OOA and HOA factors to their total signals are relatively large compared to other
 metals and OA factors. It is important to emphasise that a few key observations remain
 unchanged: (1) K+ and Rb+ are strongly associated with MO-OOA, (2) V+ is mainly associated
 with LO-OOA, and (3) Na+ is associated with a few OA factors that are related to combustion
 emissions (i.e., LO-OOA, O-HOA, and HOA).

Overall, applying CDCE corrections for OA, rBC and metals do not result in substantial changes in our
interpretations for most of the key observations. The discussion and conclusion developed based on the
distribution of metals to different OA factors remains unchanged. Therefore, the original PMF results
are used as a base case in our discussion in the main text. Table 1 shows the possible ranges of different
parameters based on the results obtained from the CDCE-corrected PMF analysis. Table S4 summarizes
the results of pre- and post-CDCE-corrected PMF analysis (Pre-CDCE: PMF solution obtained by the
CDCE-corrected input matrices, Post-CDCE: PMF solution corrected by CDCE).

 3
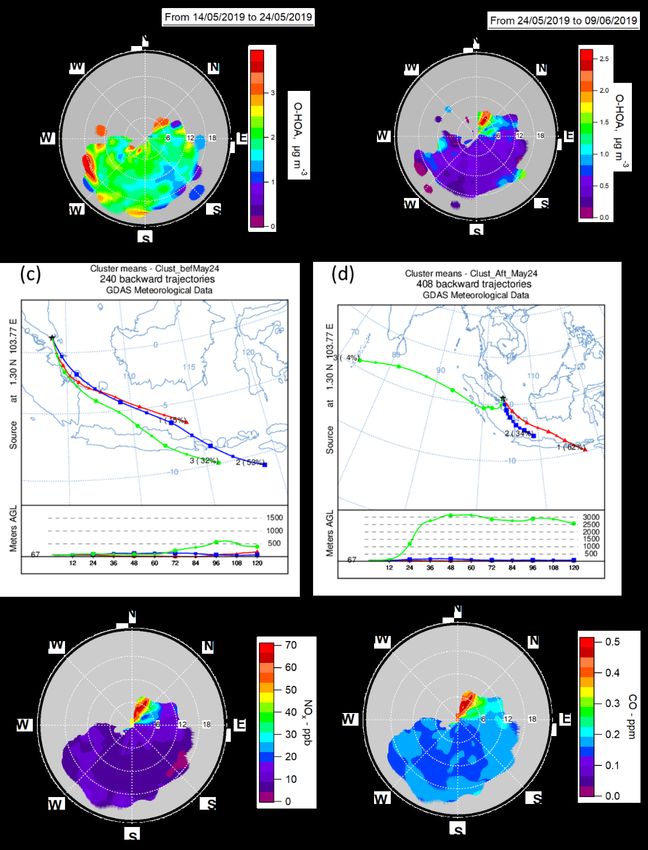
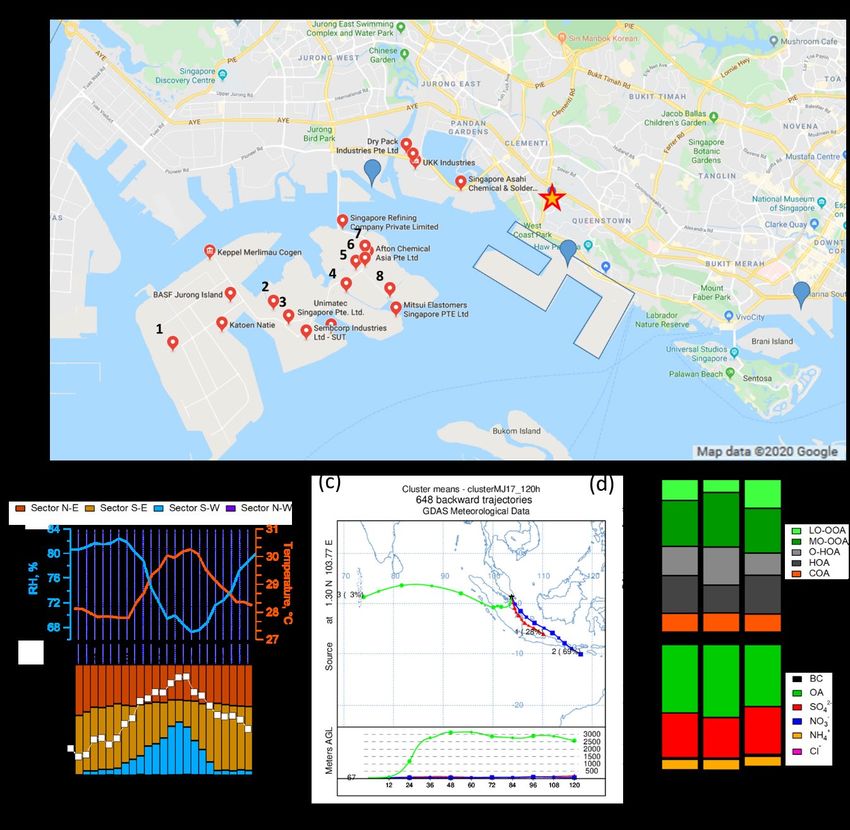
Figure S1: (a) Map overview of the measurement location (indicated by a star). The industrial areas
(Tuas industrial estate and Jurong Island) are located in the southwest sector of the sampling site. The
red pins and numbers indicate the following industries: (1) Evonik Methionine SEA, (2) ExxonMobil
Chemical Plant, (3) Eastman Chemical, (4) Petrochemical Corporation of Singapore, (5) Linde Gas
Singapore Pte Ltd, (6) SembCorp Industries Ltd, (7) Nouryon Surface Chemistry Pte Ltd, and (8) Shell
Chemicals Seraya Pte Ltd. The blue pins and outlined areas represent the shipping ports. (b) Diurnal
cycles of average RH (%), temperature (oC), wind frequency per sector (N-E: 0-90°; S-E: 90-160°; S-
W: 160-270°; N-W: 270-0°) and mean wind speed (m s-1). (c) 3-cluster solution of air mass back-
trajectories over the entire sampling period. (d) The average chemical compositions of PM1 and OA for
each back-trajectory cluster.

 4
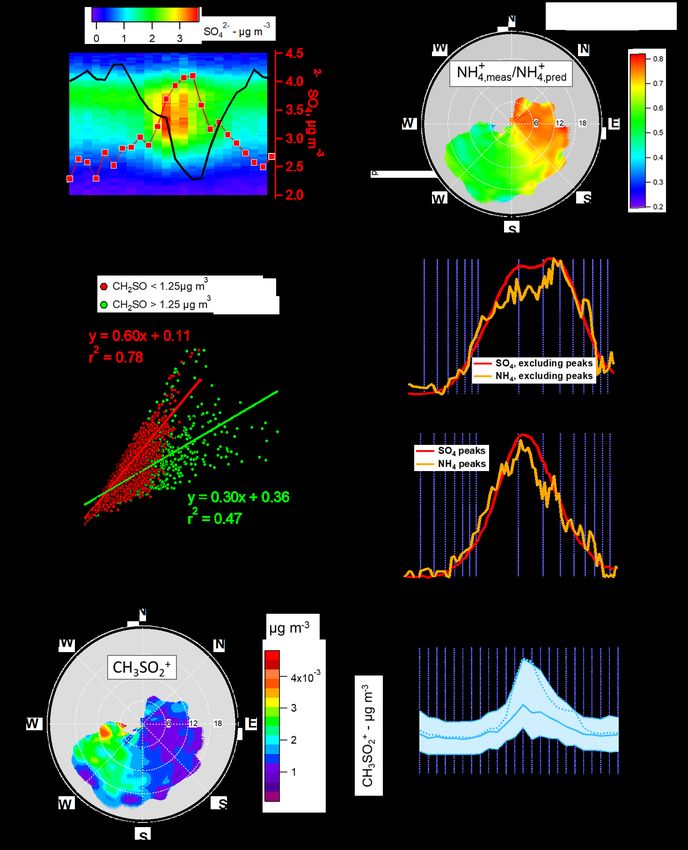
Figure S2: (a) Time series of composition-dependent collection efficiency (CDCEMid) determined over
the entire campaign. Cumulative frequency of (b) aethalometer-based CDCE and (c) OC/EC-based
CDCE, and their respective lognormal fitting determined over the entire campaign (with the fitting
 ln( ⁄ 0) 2
parameters corresponding to the following equation: = 0 + A exp �− � � �).
 ℎ

 5
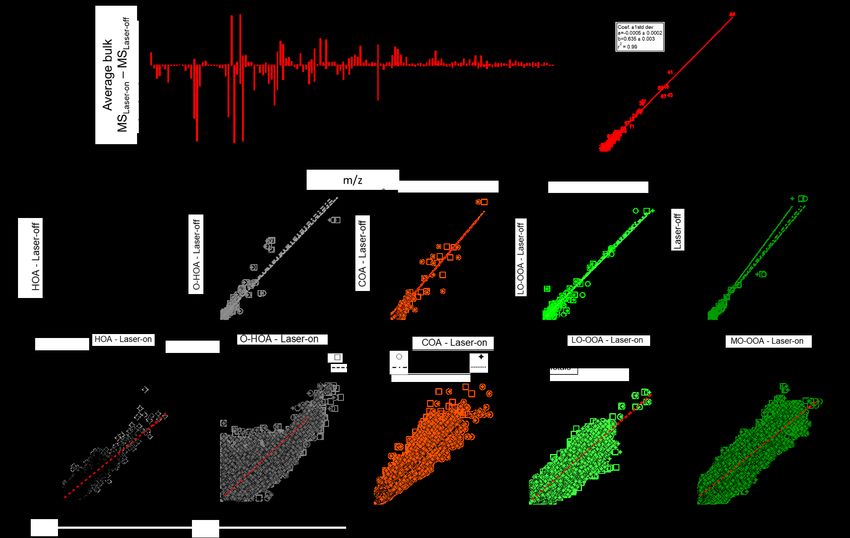
Figure S3: Scatter plots of (a) the hourly-averaged SO42- mass concentration measured by the SP-AMS
 and MARGA, (b) and the hourly-averaged OA and OM (estimated from OC concentration using a 2.2
5 conversion factor) mass concentrations measured by the SP-AMS and OC/EC analyser, respectively.
 Comparisons of 10-min averaged rBC mass concentrations measured by the SP-AMS with (c) BC and
 (d) EC mass concentrations measured by the aethalometer and OC/EC analyser, respectively.

 6
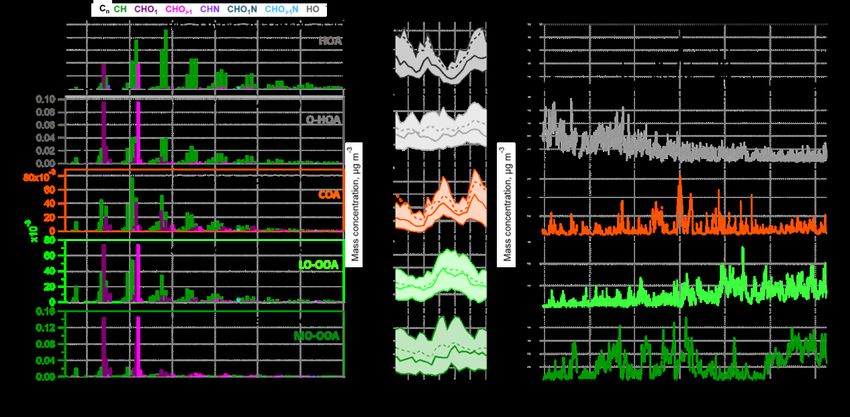
5 Figure S4: Mass spectra, diurnal variations (median - plain line, mean – dotted line, 25th and 75th centiles
 - shaded area) and time series of PMF factors obtained from the laser-on measurements. (a-c) OA only,
 (d-f) OA and rBC fragments (Cn+: C1+-C9+), and (g-i) OA, Cn+ and metal ions were used as the PMF
 inputs.

 7
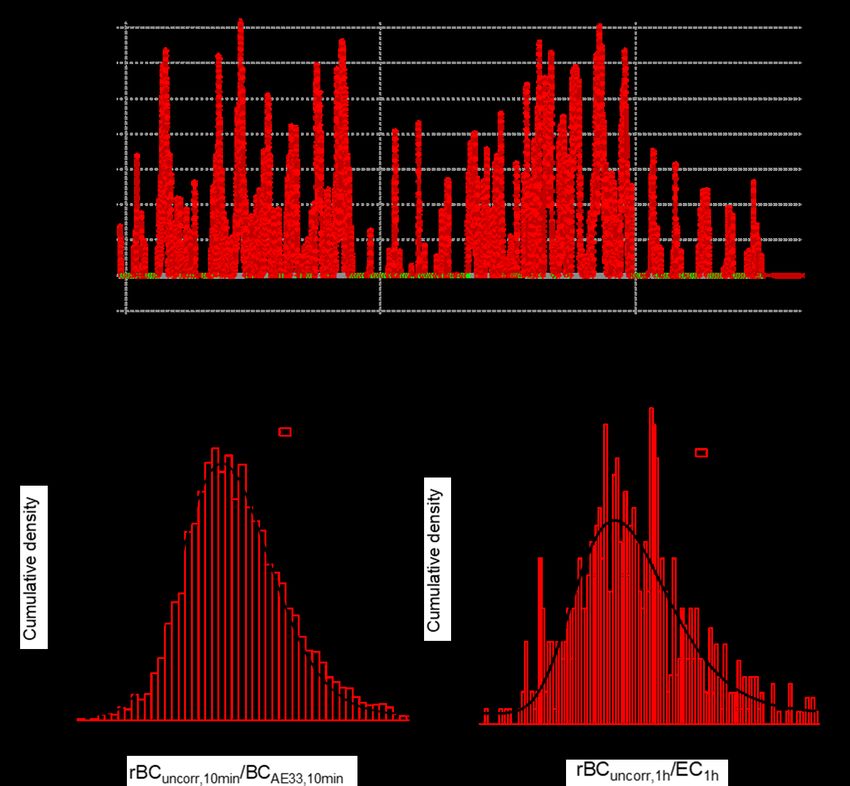
Figure S5: (a) Mass spectral difference (left) and scatter plot (right) of the averaged total organics between laser-off and laser-on (including Cn+) measurements.
Comparisons of (b) mass spectra and (c) time series of individual OA component obtained from the PMF analysis of laser-off and laser-on measurements (OA
only, OA + Cn+, OA + Cn+ + metal as PMF inputs).

 8
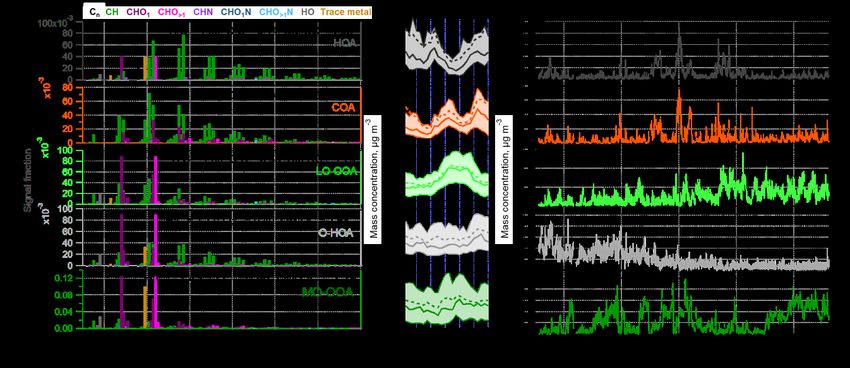
Figure S6: (a) Diurnal cycles of SO42- size distribution, SO42- mass concentrations and measured to
 predicted NH4+ ratios. (b) NWR graph of measured to predicted NH4+ ratios, (c) Comparison between
 measured and predicted NH4+ for data associated to CH2SO+ mass concentrations > 1.25 µg m-3 (red)
5 and < 1.25 µg m-3 (green). (d) Size distributions of SO42- and NH4+ for data associated to SO42- mass
 concentrations < 7 µg m-3 (top) and > 7 µg m-3 (bottom). (e) NWR graph and (f) diurnal cycle of
 CH3SO2+ fragment in µg m-3 (median - plain line, mean – dotted line, 25th and 75th centiles - shaded
 area).

 9
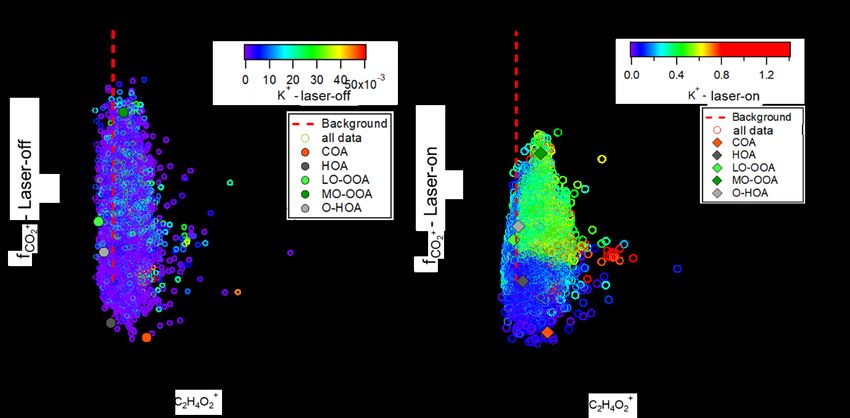
Figure S7: NWR graph of O-HOA (a) before and (b) after May 24th 2017. Results of cluster analysis of
 120 h back-trajectories obtained (c) before and (d) after May 24th 2017. NWR graph of (e) NOx and (f)
5 CO during the whole sampling period.

 10
Figure S8: Diurnal cycles of (a) N:C (laser-off mode), (b) NOx, (c) CO, (d) COA, (e) HOA, and (f) O3
 over the campaign. The plain and dotted lines represent the medians and averages values, respectively.
 The shaded regions represent the 25th and 75th percentiles. Note that data between May 25th to 28th were
5 excluded for HOA and COA due to the strong unknown emission during the nighttime.

 Figure S9: Elemental ratios of ambient data and PMF factors (coloured symbols) determined by the
10 improved-ambient elemental ratio analysis based on the method outlined in Canagaratna et al., (2015).

 11
Figure S10: Contributions of each OA factor to the N-containing fragment groups (Kasthuriarachchi et
5 al., (2020)).

 Figure S11: (a) Size distributions of (a) m/z 12 (C1+), m/z 36 (C3+), and OA measured by the laser-on
 mode. (b) Size distributions of lowC (i.e., sum of C1+, C2+ and C3+), OA, SO42-, NO3-, m/z 39 (surrogate
10 for K+), and m/z 60 measured by the laser-on mode. Similar size distribution of m/z 60 and m/z 39 (K+)
 are observed.

 12
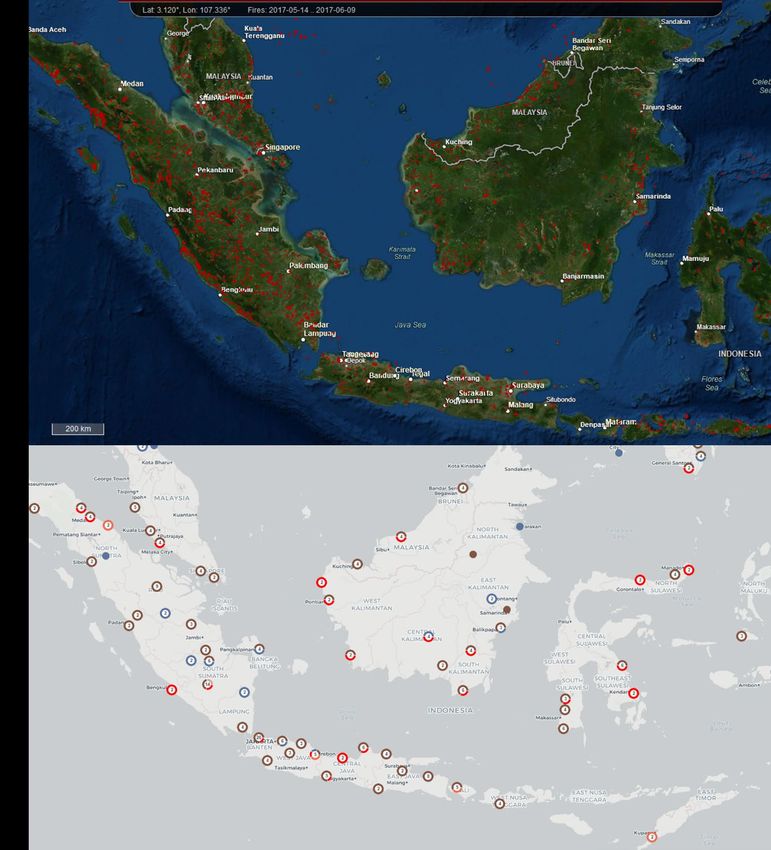
Figure S12: (a) Map of fire events identified by the Modis Active fire products over the whole campaign
 (https://firms.modaps.eosdis.nasa.gov/, © 2013 ESRI, i-cubed, GeoEye). (b) Locations of coal power
5 plants in the surrounding countries (e.g., Malaysia and Indonesia). The power plant statuses are
 indicated by different colour: red – in construction, brown – operating, salmon – permitted, and blue –
 shelved (https://endcoal.org.tracker/, data: Global Energy Monitor, ©OpenStreetMap, ©CARTO).

 13
Figure S13: (a) Box plots of fC2H4O2+ (5th, 25th, 50th, 75th and 95th percentiles). The average is indicated
 by the marker (open circle). Scatter plots of (b) MO-OOA vs. K+ signals obtained by the laser-on mode,
 (c) K+ signals vs. m/z C2H4O2+ signals obtained by the laser-on mode, and (d) K+ signals vs. m/z
5 C2H4O2+ signals obtained by the laser-off mode.

 14
Figure S14: Scatter plots of fCO2+ vs. fC2H4O2+, The symbols are colored by potassium (K+) ion intensities
 based on (a) the laser-off mode, and (b) the laser-on mode measurements (Dash red line – 0.3%
 background value, and plain black lines define the space with and without significant biomass burning
5 influence (i.e., inside and outside the triangular region, respectively, Cubison et al., (2011)).

 15
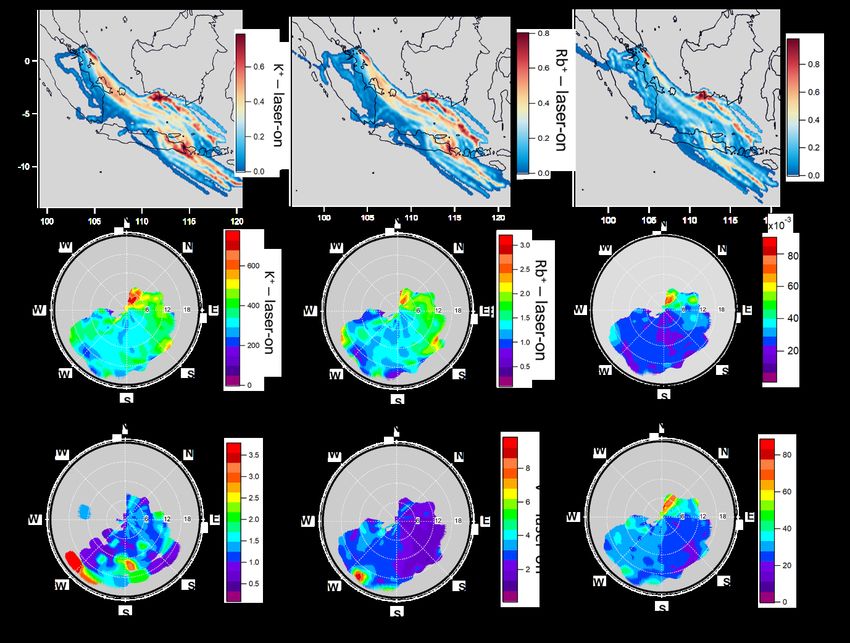
Figure S15: PSCF graphs of (a) K+, (b) Rb+ and (c) m/z C2H4O2+ signals. NWR plots of (d) K+, (e) Rb+,
 (f) m/z C2H4O2+, (g) Ni+, (h) V+, and (i) Na+, measured by the laser-on mode of SP-AMS measurements
 during the whole campaign.

5

 16
Table S1: List of industrial plants and power stations located in Jurong Island (i.e., the industrial zone
in the southwest direction of the sampling site).

 Industry Activity Products Sources
 LANXESS Chemical plant Inorganic pigments, organic leather http://lanxess.sg/
 chemicals, chrome tanning salts, ion
 exchange resins, reverse osmosis
 membrane products, antimicrobial
 active ingredients, preservatives and
 disinfectants, etc.
 Afton Chemical plant Manufactures petroleum additives, https://www.aftonchemical.co
 Chemical including driveline, engine oil, fuel m/
 and industrial additives
 BASF Chemical plant Solvents, amines, resins, glues, https://www.basf.com/sg/en.ht
 electronic-grade chemicals, industrial ml
 gases, basic petrochemicals,
 inorganic chemicals, thermoplastics,
 foams and urethanes
 BP plc Petroleum https://www.bp.com/en/global
 Company /corporate/what-we-do/bp-
 worldwide/bp-in-
 singapore.html
 Celanese Chemical plant Acetic acid, vinyl acetate ethylene https://www.chemicals-
 polymers technology.com/projects/celan
 ese/
 Evonik Chemical plant Feed additives, lubricant additives, https://aps.evonik.com/region/
 hydrogen peroxide, precipitated and seaanz/en/company/seaanz/sin
 fumed silica, acrylic resins, gapore/
 monomers, moulding compounds and
 high-performance polymers
 ExxonMobil Refinery and Engine and heavy-duty vehicles oils https://www.exxonmobil.com.
 chemical plant (e.g., low-sulphur diesel, jet fuel) and sg/Company/Overview/Who-
 industrial/specialty lubricants we-are/Singapore-Chemical-
 Plant
 DuPont de Chemical plant Nylon resin cubes for the automotive, https://www.dupont.com.sg/
 Nemours Inc. electronics and appliance industries
 Mitsui Chemical plant Methyl styrene
 Chemicals https://www.azbil.com/case/aa
 Mitsui Chemical plant High-performance elastomers c/app_004/app_004a.html
 Elastomer
 Chevron Energy and Oils, lubricants additives https://www.chevron.com/wor
 Oronite chemical plant ldwide/singapore
 Petrochemical Petrochemical Ethylene, propylene, acetylene,
 Complex of plant butadiene, 1-butene, MTBE, benzene,
 Singapore toluene and xylene
 https://www.spc.com.sg/
 Singapore Petrochemical Oils, lubricant additives
 Petroleum plant
 Company Ltd
 Shell Petrochemical Ethylene oxide, styrene monomers, https://www.shell.com.sg/abo
 plant propylene oxide, polyols ut-us/projects-and-sites/shell-
 jurong-island.html

 17
Stepan Chemical plant Polymers, surfactants https://www.stepan.com/why-
Company stepan/manufacturing_strength
 s.aspx
The Polyolefin Chemical plant Plastics, polyethylene, polymers and https://www.tpc.com.sg/
Company polymer additives
Chevron Chemical plant High Density Polyethylene http://www.cpchem.com/en-
Philips us/company/loc/Pages/Jurong-
 Island.aspx
Sumitomo Chemical plant Absorbent Polymers https://www.sumitomo-
Chemical chem.com.sg/regional_presenc
 e/singapore/
Pulau Seraya Power station Oil, Natural gas, combined heat and https://ytlpowerseraya.com.sg/
Power station power
PacificLight Power station Natural gas https://www.pacificlight.com.s
 g/
Tembusu Power station Biomass Clean Coal energy https://www.tuaspower.com.s
Multi-Utilities production g/tembusu-multi-utilities-
Complex complex/
Sembcorp Power station Natural gas https://www.sembcorp.com/en
Cogen /
Keppel Power station Oil, natural gas and combined heat http://www.kepinfra.com/en/c
Merlimau and power, coal gasification for ontent.aspx?sid=4259
Cogen feedstock production

 18
Table S2: Averages and standard deviations of metal ions measured by the laser-on mode of SP-AMS
 for the entire period of the campaign. Limits of detection (LOD) were determined using the particle-
 free air (i.e., ambient air passed through an inlet filter).
5
 Signal (Hz) K+ Na+ Rb+ V+ Ni+
 LOD 36.09 22.21 0.82 0.33 0.66
 Mean 335.82 31.62 1.29 2.28 0.48
 Standard deviation 210.63 24.87 1.05 2.38 0.61

 Table S3: Correlation coefficients (r) and slopes of linear regression between PMF factors determined
10 by the laser-off and laser-on mode. Three additional PMF scenarios were conducted for the laser-on
 mode measurements (i.e., including (1) OA only, (2) OA and Cn+, and (3) OA, Cn+, and metals ions in
 the PMF input matrix).

 HOA COA O-HOA LO-OOA MO-OOA
 PMF factors
 MS TS MS TS MS TS MS TS MS TS
 Slope 0.98 0.44 1.12 0.50 0.91 0.61 1.05 0.54 1.13 0.62
 OA

 R 0.95 0.95 0.98 0.94 0.95 0.85 0.97 0.94 0.99 0.92
 Slope 0.99 0.46 1.11 0.41 0.94 0.59 1.01 0.53 1.17 0.58
 OA +
 Cn+

 R 0.91 0.92 0.95 0.92 0.95 0.80 0.98 0.92 0.99 0.91
 Slope 1.06 0.45 1.11 0.40 0.97 0.58 0.99 0.50 1.30 0.58
 metal
 OA +
 Cn++

 R 0.93 0.91 0.95 0.94 0.95 0.78 0.99 0.93 0.99 0.91

 19
Table S4: Comparisons of the PMF results obtained from different CDCE correction approach (Pre-CDCE: PMF solution obtained by the CDCE-corrected
input matrices, Post-CDCE: PMF solution corrected by CDCE). The post-CDCE solutions represent the corresponding base cases reported in the main text,
Figure 3, and Figure S4.

 PMF factors LO-OOA MO-OOA COA O-HOA HOA
 Laser status OFF ON OFF ON OFF ON OFF ON OFF ON
 + Cn++ + Cn++ + Cn++ + Cn++ + Cn++
 Type of PMF OA + Cn+ OA + Cn+ OA + Cn+ OA + Cn+ OA + Cn+
 metal metal metal metal metal
 Contribution to total OA mass (%)
 Post-CDCE 10.4 12.6 13.1 32.1 24.5 26.7 11.7 14.6 15.4 26.4 22.2 22.0 19.4 23.7 22.8
 Pre-CDCE 12.4 12.3 12.1 30.8 28.5 29.6 12.6 16.3 17.8 21.0 20.6 19.7 23.2 22.2 21.4
 Contribution to total rBC mass (%)
 Post-CDCE NA 29.2 30.1 NA 6.2 6.4 NA 1.3 1.4 NA 20.1 20.7 NA 43.1 44.4
 Pre-CDCE NA 29.9 31.5 NA 7.4 8.8 NA 1.8 2.3 NA 26.5 24.4 NA 34.4 33.0
 C1+/C3+
 Post-CDCE NA 0.81 0.79 NA 0.54 0.29 NA NA NA NA 1.00 1.00 NA 0.66 0.65
 Pre-CDCE NA 0.88 0.85 NA 1.76 1.57 NA NA NA NA 0.90 0.89 NA 0.63 0.62
 Time series - correlation coefficient (r)
 Post- vs. Pre-CDCE 0.98 0.97 0.91 0.99 0.99 0.99 0.98 0.97 0.96 0.89 0.93 0.94 0.99 0.97 0.97
 Time series – slope
 Post- vs. Pre-CDCE 1.17 1.06 1.06 0.96 0.99 1.09 1.07 0.86 0.83 0.81 1.05 1.11 1.27 1.04 1.10
 Normalized mass spectra - correlation coefficient (r)
 Post- vs. Pre-CDCE 1.00 0.95 0.94 1.00 1.00 0.99 1.00 0.93 0.92 1.00 0.99 0.99 0.97 0.99 0.99

 20
References

 Canagaratna, M. R., Jimenez, J. L., Kroll, J. H., Chen, Q., Kessler, S. H., Massoli, P., Hildebrandt Ruiz,
 L., Fortner, E., Williams, L. R., Wilson, K. R., Surratt, J. D., Donahue, N. M., Jayne, J. T. and Worsnop,
 D. R.: Elemental ratio measurements of organic compounds using aerosol mass spectrometry:
5 characterization, improved calibration, and implications, Atmos Chem Phys, 15(1), 253–272,
 doi:10.5194/acp-15-253-2015, 2015.

 Cubison, M. J., Ortega, A. M., Hayes, P. L., Farmer, D. K., Day, D., Lechner, M. J., Brune, W. H.,
 Apel, E., Diskin, G. S., Fisher, J. A., Fuelberg, H. E., Hecobian, A., Knapp, D. J., Mikoviny, T., Riemer,
 D., Sachse, G. W., Sessions, W., Weber, R. J., Weinheimer, A. J., Wisthaler, A. and Jimenez, J. L.:
10 Effects of aging on organic aerosol from open biomass burning smoke in aircraft and laboratory studies,
 Atmos Chem Phys, 11(23), 12049–12064, doi:10.5194/acp-11-12049-2011, 2011.

 Kasthuriarachchi, N. Y., Rivellini, L.-H., Adam, M. G. and Lee, A. K. Y.: Strongly absorptive primary
 and secondary brown carbon in an urban, under review, Environ Sci Technol, 2020.

 Middlebrook, A. M., Bahreini, R., Jimenez, J. L. and Canagaratna, M. R.: Evaluation of Composition-
15 Dependent Collection Efficiencies for the Aerodyne Aerosol Mass Spectrometer using Field Data,
 Aerosol Sci. Technol., 46(3), 258–271, doi:10.1080/02786826.2011.620041, 2012.

 Willis, M. D., Lee, A. K. Y., Onasch, T. B., Fortner, E. C., Williams, L. R., Lambe, A. T., Worsnop, D.
 R. and Abbatt, J. P. D.: Collection efficiency of the soot-particle aerosol mass spectrometer (SP-AMS)
 for internally mixed particulate black carbon, Atmos Meas Tech, 7(12), 4507–4516, doi:10.5194/amt-
20 7-4507-2014, 2014.

 21
You can also read