FT-IR Spectroscopy Attenuated Total Reflectance (ATR)
←
→
Page content transcription
If your browser does not render page correctly, please read the page content below
F T- I R S P E C T R O S C O P Y

                                                                                                                                                        T E C H N I C A L
FT-IR Spectroscopy
Attenuated Total Reflectance (ATR)

                                                                                                                                                        N O T E
                                                    Sample in contact
                                                   with evanescent wave

                                                                           To Detector

                     Infrared                    ATR
                      Beam                      Crystal

Introduction                          many cases some form of sample          Key Features
Mid-Infrared (IR) spectroscopy        preparation is required in order
                                                                                 Faster sampling
is an extremely reliable and          to obtain a good quality spectrum.
                                      Traditionally IR spectrometers             Improving sample-to-sample
well recognized fingerprinting                                                   reproducibility
method. Many substances can           have been used to analyze solids,
be characterized, identified and      liquids and gases by means of              Minimizing user-to-user spectral
                                      transmitting the infrared radia-           variation
also quantified.
                                      tion directly through the sample.          Higher quality spectral databases
One of the strengths of IR spec-      Where the sample is in a liquid            for more precise material verification
troscopy is its ability as an ana-                                               and identification
                                      or solid form the intensity of the
lytical technique to obtain spectra   spectral features is determined by
from a very wide range of solids,     the thickness of the sample and
liquids and gases. However, in        typically this sample thickness

w w w. p e r k i n e l m e r. c o m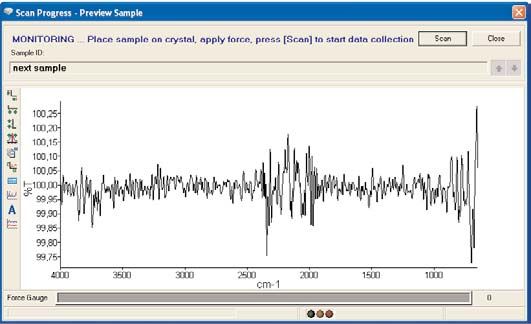
cannot be more than a few tens of thoroughly with about 350 mg of thickness or pathlength. A constant
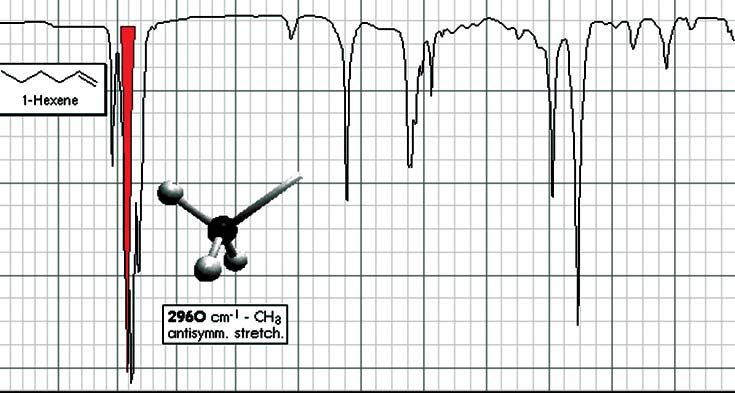
microns. Figure 1 displays a typical ground KBr. The mixture is now pathlength is highly desirable when
IR transmission spectrum. transferred to a die that has a barrel performing quantitative analyses.
diameter of 13 mm (Figure 2). This is
The technique of Attenuated Total Overall, sample preparation is easier
then placed in a suitable press and
Reflectance (ATR) has in recent for liquid transmission studies
pressed (evacuation is optional) at
years revolutionized solid and when compared to solid transmis-
around 12,000 psi for one to two
liquid sample analyses because sion sampling but both suffer from
minutes. Re-crystallization of the
it combats the most challenging inevitable reproducibility issues
KBr results in a clear glassy disk
aspects of infrared analyses, given the complexity of the sample
about 1 mm thick. This disk is now
namely sample preparation and preparation methods. In addition,
ready to be analyzed by transmission.
spectral reproducibility. preparation can be very messy and
time consuming and is further com-
Issues surrounding plicated by difficulties in getting
traditional transmission sample to matrix ratios correct and
homogenous throughout the sample.
sample preparation
The materials involved are fragile and
The two most common forms of hydroscopic and the quality of meas-
sample preparation for solids both urements can be adversely affected if
Evacuable KBr Die
involve grinding the material to a handled or stored incorrectly. The
fine powder and dispersing it in a Figure 2. Potassium bromide 13 mm die.
technique of Attenuated Total
matrix. The ground material can be Reflectance addresses these issues.
dispersed in a liquid to form a mull.
The most commonly used liquid is
Principles of ATR
mineral oil (nujol). Typically no
more than 20 mg of solid is ground An attenuated total reflection
and then one or two drops of nujol accessory operates by measuring
are used to create a paste which is the changes that occur in a totally
then spread between two Mid-Infra- internally reflected infrared beam
red transparent windows e.g. NaCl, when the beam comes into contact
KBr, CaF2. The sample is now ready Figure 3. Sealed (l) and demountable (r) with a sample (indicated in Figure 4).
liquid cells. An infrared beam is directed onto
to be placed in the spectrometer for
analysis by transmission. an optically dense crystal with a
Liquids are traditionally analyzed
high refractive index at a certain
Potassium bromide (KBr) is prob- as thin films in cells (Figure 3), a cell
angle. This internal reflectance
ably the most widely used matrix consists of two IR transparent win-
creates an evanescent wave that
material. Between 1 and 3 mg of dows. A Teflon® spacer is generally
extends beyond the surface of the
ground material needs to be mixed used to produce a film of the desired
crystal into the sample held in con-
tact with the crystal. It can be easier
to think of this evanescent wave as
a bubble of infrared that sits on the
surface of the crystal. This evanes-
cent wave protrudes only a few mic-
rons (0.5 µ - 5 µ) beyond the crystal
surface and into the sample. Conse-
quently, there must be good contact
between the sample and the crystal
surface. In regions of the infrared
spectrum where the sample absorbs
energy, the evanescent wave will be
attenuated or altered. The attenuated
Figure 1. A Mid-Infrared spectrum of Hexene. energy from each evanescent wave
2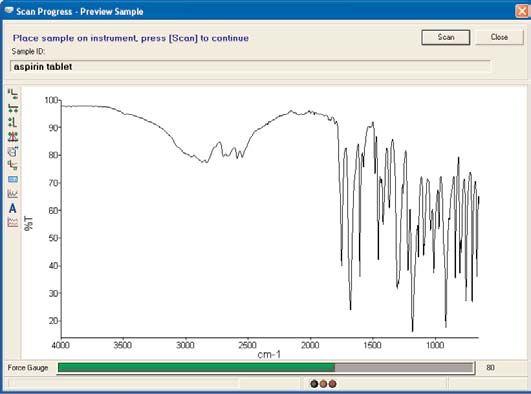
is passed back to the IR beam, which       deformable materials, and also with              Germanium has a much better work-
then exits the opposite end of the         fine powders but many solids give                ing pH range and can be used to
crystal and is passed to the detector      very weak spectra because the con-               analyze weak acids and alkalis.
in the IR spectrometer. The system         tact is confined to small areas. The             Germanium has by far the highest
then generates an infrared spectrum.       effects of poor contact are greatest             refractive index of all the ATR
                                           at shorter wavelengths where the                 materials available which means
For the technique to be successful,
                                           depth of penetration is lowest.                  that the effective depth of pene-
the following two requirements must
                                                                                            tration is approximately 1 micron.
be met:                                    The issue of solid sample/crystal
                                                                                            For most samples this will result
                                           contact has been overcome to a great
• The sample must be in direct                                                              in a weak spectrum being produced,
                                           extent by the introduction of ATR
  contact with the ATR crystal,                                                             however, this is an advantage when
                                           accessories with very small crystals,
  because the evanescent wave or                                                            analyzing highly absorbing materi-
                                           typically about 2 mm across. The
  bubble only extends beyond the                                                            als; carbon black filled rubbers are
                                           most frequently used small crystal
  crystal 0.5 µ - 5 µ.                                                                      typically analyzed using Germanium
                                           ATR material is diamond because it
• The refractive index of the crys-                                                         ATR accessories.
                                           has the best durability and chemical
  tal must be significantly greater        inertness. These small area ATR crys-            Diamond is by far the best ATR crys-
  than that of the sample or else          tal top-plates generally provide only a          tal material because of its robustness
  internal reflectance will not oc-        single reflection but this is sufficient,        and durability. The original purchase
  cur – the light will be transmitted      given the very low noise levels of               cost is obviously higher than that of
  rather than internally reflected in      PerkinElmer’s modern FT-IR spec-                 other crystal materials available, but
  the crystal. Typically, ATR crystals     trometers. Much higher pressure with             over the instrument’s lifetime re-
  have refractive index values be-         limited force can now be generated               placement costs should be minimal.
  tween 2.38 and 4.01 at 2000 cm-1.        onto these small areas. A much                   The same cannot be said of Zinc
  It is safe to assume that the majority   smaller area of contact is now re-               Selenide or Germanium, both of
  of solids and liquids have much          quired in comparison to the HATR                 which can scratch and break with
  lower refractive indices.                units. As a result, spectra can be               improper use.
                                           obtained from a wide variety of
ATR accessories                                                                             As with all FT-IR measurements, an
                                           solid materials including minerals.
                                                                                            infrared background is collected, in
The traditional ATR design in which
                                                                                            this case, from the clean ATR crystal.
a thin sample was clamped against          Crystal materials                                The crystals are usually cleaned
the vertical face of the crystal has       and cleaning                                     by using a solvent soaked piece of
been now been replaced by a hori-
                                           There are a number of crystal mate-              tissue. Typically water, methanol or
zontal design. In horizontal ATR
                                           rials available for ATR. Zinc Selenide           isopropanol are used to clean ATR
(HATR) units, the crystal is a paral-
                                           (ZnSe) and Germanium are by far                  crystals. The ATR crystal must be
lel-sided plate, typically about 5 cm
                                           the most common used for HATR                    checked for contamination and carry
by 1 cm, with the upper surface ex-
                                           sampling. Zinc Selenide is a rela-               over before sample presentation,
posed (Figure 4). The number of
                                           tively low cost ATR crystal material             this is true for all liquids and solids.
reflections at each surface of the
                                           and is ideal for analyzing liquids
crystal is usually between five and
                                           and non-abrasive pastes
ten, depending on the length and
                                           and gels but it is not
thickness of the crystal and the angle                                                                      Sample in contact
                                           particularly robust with
of incidence.                                                                                            with evanescent wave
                                           a working pH range of
When measuring solids by ATR, it           5-9. ZnSe scratches quite
is essential to ensure good optical        easily and so care must
                                                                                                                        To Detector
contact between the sample and the         be taken when cleaning
crystal. The accessories have devices      the crystal. It is recom-               Infrared           ATR
                                                                                    Beam             Crystal
that clamp the sample to the crystal       mended that lint free
surface and apply pressure. This           tissue is used.             Figure 4. A multiple reflection ATR system.
works well with elastomers and other

                                                                                              w w w. p e r k i n e l m e r. c o m     3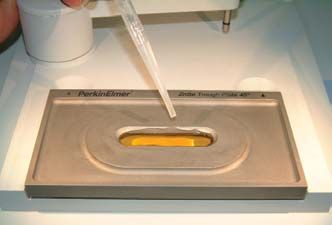
Analyzing liquids                            After the crystal area has been                 The strongest bands here extend
After the crystal has been cleaned           cleaned and the background col-                 beyond 20% T with relatively little
and an infrared background has               lected, the solid material is placed            force applied; the force gauge is
been collected, the liquid is simply         onto the small crystal area (Figure 6).         registering 80 N. A lot more pres-
poured onto the crystal (Figure 5).          Experience has shown that ideal                 sure would need to be applied when
The whole crystal must be covered if         results from powder samples have                analyzing high density polymers and
performing a quantitative or qualita-        been achieved by placing just                   coatings on metal surfaces. Once the
tive analysis. The crystal is recessed       enough sample to cover the crystal              user is satisfied with the spectrum
into the metal plate to retain the           area. The sample height should not              shown in this ‘Preview Mode’, the
sample. Pastes and other semi-solid          be more than a few millimeters.                 data is then collected in the normal
samples are readily measured by                                                              manner. The force should not be
                                             Once the solid has been placed on the
spreading them on the crystal. Hori-                                                         adjusted when co-adding the final
                                             crystal area, the pressure arm should
zontal ATR units are often used for                                                          spectrum. Unlike transmission
                                             be positioned over the crystal/sample
quantitative work in preference to                                                           measurements, ATR sampling does
                                             area. When using the Spectrum 100
transmission cells because they are                                                          not produce totally absorbing
                                             Series’ Universal ATR accessory,
easier to clean and maintain.                                                                spectral bands because the effective
                                             the pressure arm locks into a precise
                                                                                             path-length is controlled by the
                                             position above the diamond crystal
                                                                                             crystal properties thereby minimiz-
                                             (Figure 7). Force is applied to the
                                                                                             ing sample re-preparation time.
                                             sample, pushing it onto the dia-
                                             mond surface.                                   After the spectrum has been col-
                                                                                             lected, which should typically take
                                                                                             no more than 32 seconds, the user
                                                                                             must return to the ‘Preview Mode’.
                                                                                             This mode is now used to check
                                                                                             that the crystal area is clean before
                                                                                             placing the next sample on the cry-
Figure 5. Using a pipette to add a liquid                                                    stal. A 100% T line with no spectral
sample to a ZnSe HATR trough plate.
                                                                                             features (Figure 9) should be seen if
                                                                                             the crystal is clean, if spectral fea-
Analyzing solids                                                                             tures are seen, the crystal should
Solids are generally best analyzed                                                           be cleaned again using a solvent
                                             Figure 7. Applying pressure to a solid sample
on the single reflection ATR acces-          on the Universal diamond ATR top-plate.         soaked tissue. The next sample can
sories; diamond being the preferred                                                          be placed on the crystal area once
choice for most applications because                                                         the 100% T line has been displayed
                                             PerkinElmer’s revolutionary                     and the sampling steps are repeated.
of its robustness and durability.
                                             Spectrum™ FT-IR software utilizes
                                             a ‘Preview Mode’ which allows the
                                                                                             Conclusion
                                             quality of the spectrum to be
                                             monitored in real-time while fine               ATR is an IR sampling technique that
                                             tuning the exerted force. It is good            provides excellent quality data in
                                             practice to apply pressure until the            conjunction with the best possible
                                             strongest spectral bands have an                reproducibility of any IR sampling
                                             intensity which extends beyond                  technique. It has revolutionized IR
                                             70% T, namely from a baseline at                solid and liquid sampling through:
                                             100% T down to 70% T. Good
                                                                                             • Faster sampling
                                             sample/crystal interface contact has
                                             been achieved once this rule has                • Improving sample-to-sample
                                             been satisfied. This is very easy to              reproducibility
                                             achieve with soft samples and fine              • Minimizing user to user spectral
Figure 6. Placing a powder sample onto the
Universal diamond ATR top-plate.             powders, this is shown in Figure 8.               variation

4
Most importantly, the improved spec-
tral acquisition and reproducibility
associated with this technique leads
to better quality database building for
more precise material verification
and identification. ATR is clearly
an extremely robust and reliable
technique for quantitative studies
involving liquids.
Figure 8. ‘Preview Mode’ screenshot taken from PerkinElmer’s Spectrum
v6 FT-IR software.
Figure 9: ‘Preview Mode’ displaying a 100%T line, namely a spectrum
of a clean diamond ATR crystal.
PerkinElmer Life and
Analytical Sciences
710 Bridgeport Avenue
Shelton, CT 06484-4794 USA
Phone: (800) 762-4000 or
(+1) 203-925-4602
www.perkinelmer.com
For a complete listing of our global offices, visit www.perkinelmer.com/lasoffices
©2005 PerkinElmer, Inc. All rights reserved. The PerkinElmer logo and design are registered trademarks of PerkinElmer, Inc. Spectrum is a trademark and PerkinElmer is a registered
trademark of PerkinElmer, Inc. or its subsidiaries, in the United States and other countries. Teflon is a registered trademark of E.I. du Pont de Nemours and Company. All other trademarks
not owned by PerkinElmer, Inc. or its subsidiaries that are depicted herein are the property of their respective owners. PerkinElmer reserves the right to change this document at any time
without notice and disclaims liability for editorial, pictorial or typographical errors.
007024B_01 Printed in USAYou can also read