Summary of 'Report on Stage Z' - NextNav
←
→
Page content transcription
If your browser does not render page correctly, please read the page content below
Summary of
‘Report on Stage Z’

PRODUCTION:                            PROGRAM MANAGER:
911 Location Test Bed                  Alliance for Telecommunications
on behalf of CTIA and the FCC          Industry Standards

911 LOCATION TEST BED ADMINISTRATOR:   RELEASE DATE:
Further Enterprise Solutions           July 23rd, 2018

      Read the full report here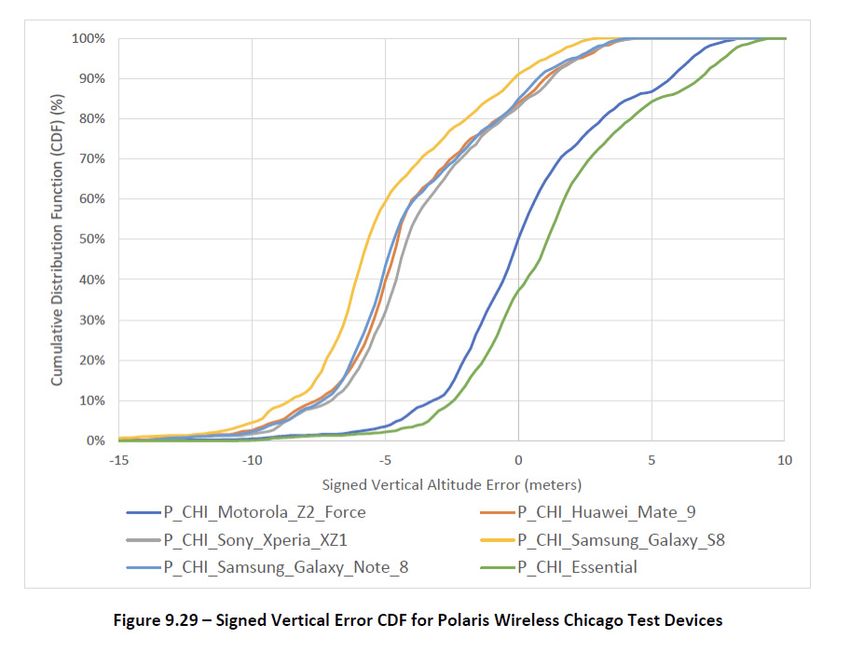
Executive Summary

This Stage Z Test Report describes the independently administered and transparent
test bed process established to develop and validate a proposed Z-axis (vertical)
metric for indoor wireless 911 calls, as required by the Federal Communications
Commission’s (FCC’s) 911 Location Accuracy Fourth Report & Order. The objective of
the Z-axis test campaign described in this report, known as Stage Z, was to provide
a rigorous, transparent process to evaluate the accuracy and overall assessment of
Z-axis technology based on standard testing methodologies.

     Note: Since the time of this Test Bed Report, the FCC has issued a Sixth Report
     and Order on 911 Location Accuracy, in proceeding 07-114, requiring wireless
     carriers to deliver a z-axis location in the Top 25 CMAs with accuracy of 3m for
     80% of calls by April 2021 and in the Top 50 CMAs by April 2023. Further, NextNav’s
     Pinnacle technology has been adopted by AT&T for use with the FirstNet Public
     Safety Broadband Network, and Pinnacle technology has been deployed in
     4,400 cities and towns across 105 CMAs, covering over 90% of buildings in the
     U.S. that exceed three stories.

The Test Bed LLC publicly solicited technology vendors to participate in Stage Z, and
two Z-axis technology vendors, NextNav and Polaris Wireless, volunteered, formally
applied, and participated in Stage Z to test technologies that rely on barometric
pressure sensor information from mobile wireless handsets to determine an estimated
altitude of an indoor wireless 911 call.

The Stage Z testing was specifically conducted in accordance with ATIS standards and
testing parameters, which account for unique factors beyond those that affect x/y
(horizontal) technologies. Stage Z testing was also conducted among a wide variety
of buildings types and environments, including high-rise residential and commercial
buildings in dense urban, urban, suburban, and in some cases rural areas. For each
selected building several test points were identified that represent different barometric
pressure environments within a building, and generally span the different areas within
a building from which a wireless 911 call might be initiated.

NextNav 2020 © Summary of ‘Report on Stage Z’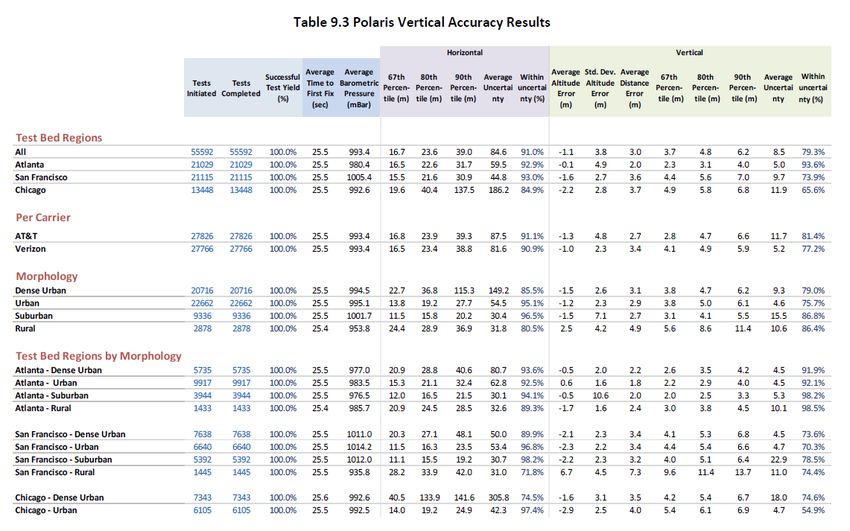
In addition to the participation of the technology vendors during the actual testing,
there are stakeholders and involved parties concerned with Z-axis technologies and
performance. The CTIA Z-axis Working Group is a collaboration of industry leaders
from across many related disciplines, including wireless carriers, technology OEMs,
sensor and handset manufacturers, service providers related to E9-1-1, and public
safety representatives.

The Z-axis Working Group met on multiple occasions to provide guidance to the
Test Bed, LLC on the testing and evaluation of Z-axis technologies. For example, the
Z-axis Working Group held an all-day meeting on September 8th, 2015 to discuss the
performance of barometric pressure sensor devices, including accuracy, trends and
the state of technology. Although this document is a work product of Test Bed, LLC, the
Z-axis Working Group has reviewed and provided input that has been incorporated
throughout.

Z-Axis Test Organization

The Test Bed provides independent indoor performance results of deployed and
emerging wireless 9-1-1 location information technologies. Test Bed, LLC has selected
FES as the independent “Administrator-Executor” of the Test Bed. It also selected
ATIS as the Test Bed’s independent Program manager. ATIS provided guidelines on
test building and test point selection and oversaw implementation of the Test Bed by
the Administrator-Executor. In addition, Test Bed, LLC receives guidance from the TAC,
which includes representatives of the nationwide wireless service providers, as well as
the Association of Public-Safety Communications Officials International (APCO) and
the National Emergency Number Association (NENA).

NextNav 2020 © Summary of ‘Report on Stage Z’
The organization structure of the Test Bed is described in the following diagram:

As outlined in this Figure 6.1, there were multiple stakeholders involved with the Test
Bed, LLC’s organization and process, consistent with the CSRIC IV recommendations.
The Test Bed, LLC’s Steering Committee and TAC provided guidance on operational
and technical issues, respectively. Both committees included representatives of the
nationwide wireless providers, as well as APCO and NENA. The Test Bed, LLC oversaw
the efforts of the Administrator/Executor, ATIS, and the test service provider, FES, who
performed the actual testing. ATIS’ committees developed the test methodologies
utilized by the test service provider.

Z-axis Location Test Procedures

“Representative testing” is the cornerstone of the test methodology that governs
testing in the Test Bed. After extensive study and deliberation with ATIS ESIF ESM,
consensus was achieved in adopting the San Francisco and Atlanta regions as providing
sufficient test representation of the broad conditions prevailing in both the Western
and Eastern United States. In both of these regions test boundaries, or polygons, that

NextNav 2020 © Summary of ‘Report on Stage Z’
contain samples of the four distinct morphologies, dense urban, urban, suburban, and
rural, which are described concisely in Section 7.3, were defined and included in ATIS-
0500031.v002. (Note that these polygons are reproduced later in this report in Section
8.3 in figures that describe the buildings used in testing within those polygons.)

The following guidelines (recommended by ATIS ESIF ESM and found in ATIS-0500031.
v002, ATIS-0500030) were required for executing Stage Z test scenarios and
methodology:

     1. Three (3) test regions: San Francisco, CA (SFO); Atlanta, GA (ATL); and Chicago, IL (CHI).†

     2. SFO and ATL: Up to twenty (20) candidate buildings selected and surveyed per test region
        across all 4 morphologies, according to the requirements in ATIS-0500031.v002.

     3. CHI: Up to ten (10) candidate buildings selected and surveyed across only dense urban
        and urban morphologies, per the guidance in ATIS-0500030 for inclusion of a colder
        climate in z-axis testing of barometric pressure-based technologies. (Selected within 5
        miles of downtown Chicago, see Figure 8.1).

     4. A range of test points in each of the test buildings, including in two high-rise buildings per
        region (sealed and unsealed if possible) where additional test points are selected as much
        as possible evenly distributed throughout the vertical axis of the building.

     5. A total of approximately 120 test points in each of the San Francisco and Atlanta test
        regions and 75 test points in Chicago.

     6. Up to six (6) test devices per testing participant. Thirty (30) test calls from each of the six (6)
        test devices divided into five (5) groups of six (6) test calls at each visit to a test point. Total
        rounds of testing per building were five, executed occasionally in a round-robin manner
        and frequently in a more random fashion.

     7. Test handsets included a variety of models and manufacturing dates. The intent was to
        ensure variability between on-device barometric sensor manufacturers and unit age
        which would more closely represent the general public handset make up. However, only
        relatively new handsets, released more recently than mid-2016, were tested because older
        devices’ limitations could not support the vendors’ test apps. (Accordingly, performance

†
    NextNav did not participate in the Chicago market tests in 2018 because its network was still in
deployment. NextNav coverage now includes 105 FCC Cellular Market Areas (CMAs).

NextNav 2020 © Summary of ‘Report on Stage Z’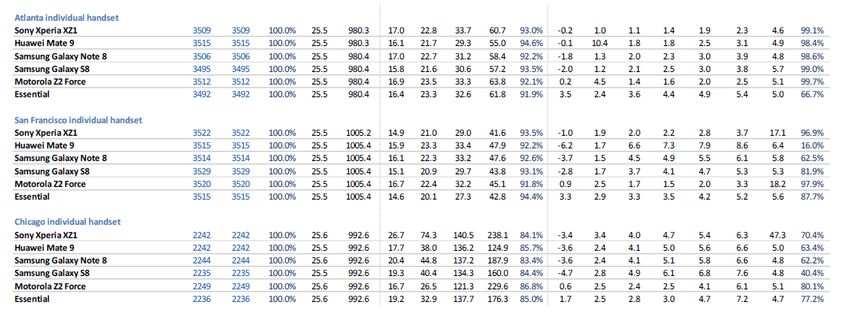
on older or less capable handsets cannot be inferred from the current testing.)

  8. A scientific grade barometric pressure sensor unit was used alongside the test handsets
     for informational purpose to capture changes in ambient pressure due to activities in test
     surroundings and to serve as a cross check in test point ID logging. Measurements were
     recorded in 1-minute intervals and provided as hectopascal (i.e., millibar).

  9. When possible, testing was scheduled with variability in weather conditions and
     randomization of atmospheric conditions. Daily atmospheric conditions were recorded
     from nearby weather stations using National Wireless Service standard data. Three
     geographically dispersed locations surrounding the test building were selected for each
     test region.

  10. In at least one building, test devices were left with the barometric reference unit on-site to
      perform an extended 24-hour observation test.

  11. Exterior doors and windows were normally closed at test point locations, except for certain
      predefined test points where testing was performed with the windows both closed and
      open. Room doors were closed to hallways when possible.

  12. GPS was enabled on test-handsets.

  13. Test handsets did not need to be power cycled at end of each 6-call test cycle and prior to
     moving to each subsequent test point for Stage Z. This is because the barometric pressure
     reading is not likely to be interdependent as was the case with x/y readings from device-
     based hybrid in other stages of testing.

  14. No placement of pre-test configuration verification calls prior to actual testing at any
      of the test points was allowed. Such calls, when needed, were placed as separate as
      possible (horizontally and/or vertically) from the test points.

FES procured access rights from property managers and completed testing of the
Z-axis location technologies in various building types in the test bed regions and
morphologies specified.

NextNav 2020 © Summary of ‘Report on Stage Z’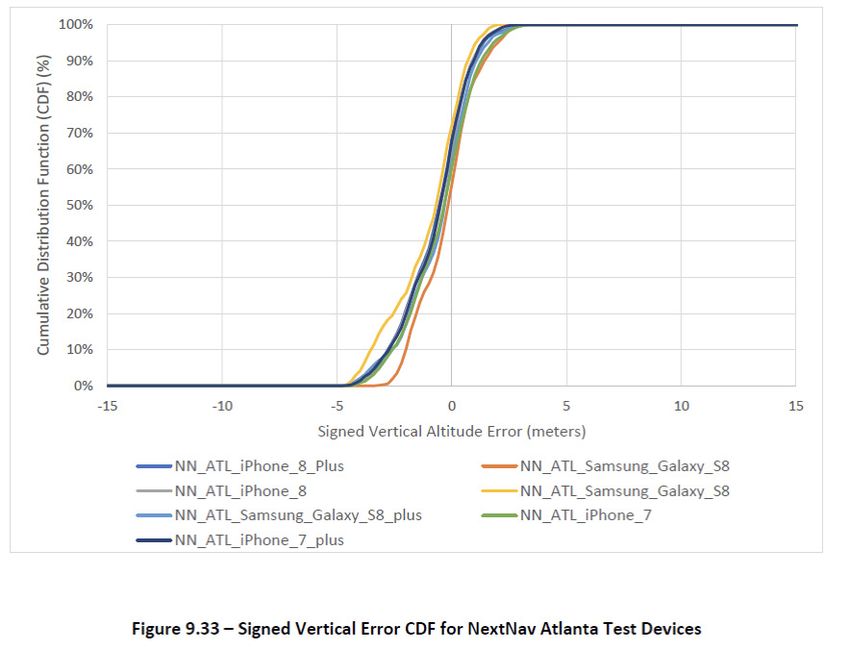
Handsets and Software
The handsets used in testing were the same production-ready handsets sold by
wireless carriers and available to the general public. The handsets did not contain any
hardware modification that would favor these handsets over any commercially available
handsets. By agreement between the Test Bed, LLC and the Z-axis technology vendors
only relatively new handsets, released more recently than mid-2016, were tested. Test
results, therefore, cannot be extrapolated to older, less capable handsets.
The handsets required test applications from each technology vendor participant
to be installed to utilize their platforms. These applications performed, among other
functions, the critical function of handset sensor bias calibration, which was mostly
performed in the background using nonstandard vendor-specific methods. (More
details provided in Section 8.5.)
Note: Since this test report was published, NextNav software has been installed
and used by commercial applications currently available in the market.
Handset configurations were specified by each test participant (network preference,
location accuracy settings, device timeouts and privacy controls). Test handsets were
purchased from commercial sources by the test administrator and were a mix of new
and somewhat older units. (More details provided in Section 8.5.) No handling of the
test handset by a technology vendor was permitted.
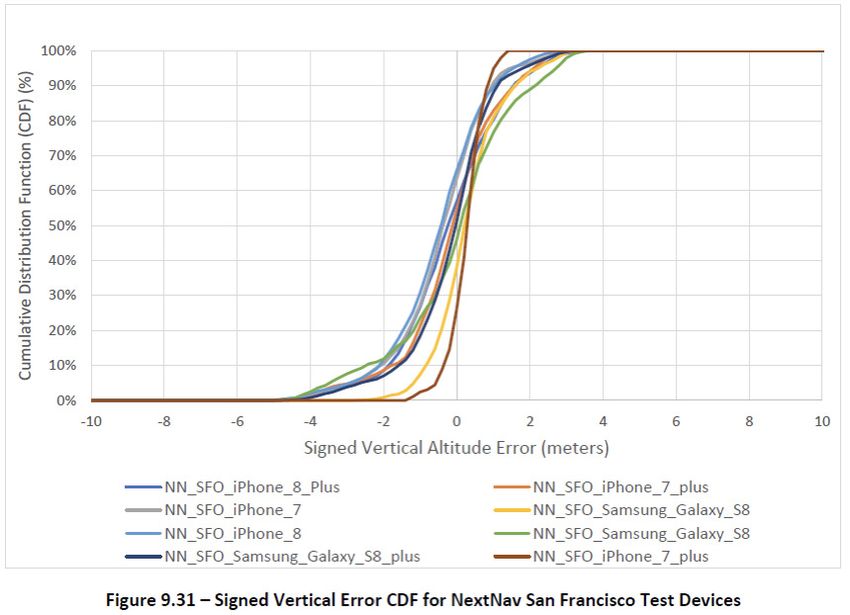
Z-axis Location Accuracy Summary
This section includes the top-level summary results for both technology vendors (NextNav and Polaris
Wireless) combined and broken out by morphology.
NextNav 2020 © Summary of ‘Report on Stage Z’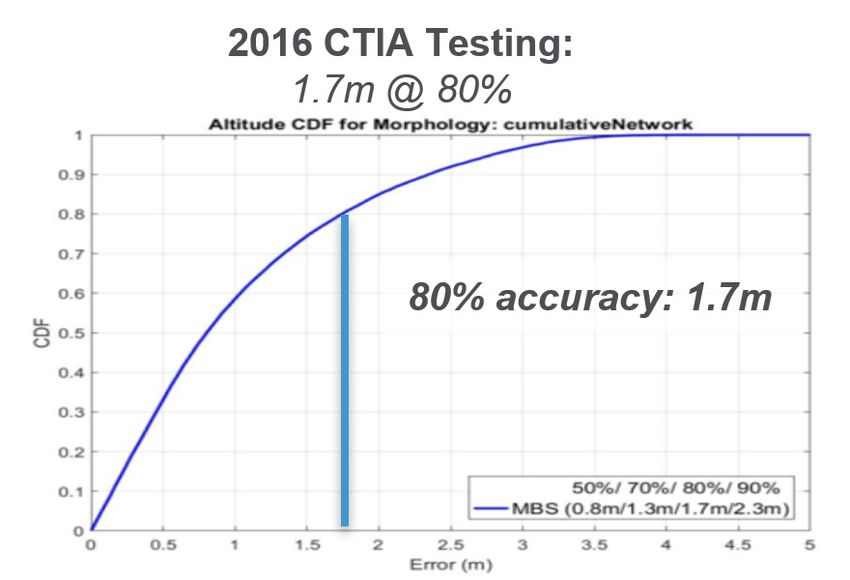
Aggregated vertical accuracy CDF across all test data

                                  1.0

                                  0.9

                                  0.8
        Cumulative Distribution

                                  0.7

                                  0.6

                                  0.5

                                  0.4

                                  0.3

                                  0.2

                                  0.1

                                   0
                                        0      1        2           3      4            5     6          7           8   9   10

                                                                          Calculated Accuracy

                                                      All NextNav         All Polaris       All Polaris (no Rural)

                                                   NextNav vertical accuray CDF per morphology

                                  1.0

                                  0.9

                                  0.8
       Cumulative Distribution

                                  0.7

                                  0.6

                                  0.5

                                  0.4

                                  0.3

                                  0.2

                                  0.1

                                   0
                                        0      1        2           3      4            5     6          7           8   9   10

                                                                          Calculated Accuracy

                                                            Dense urban          Urban         Suburban

NextNav 2020 © Summary of ‘Report on Stage Z’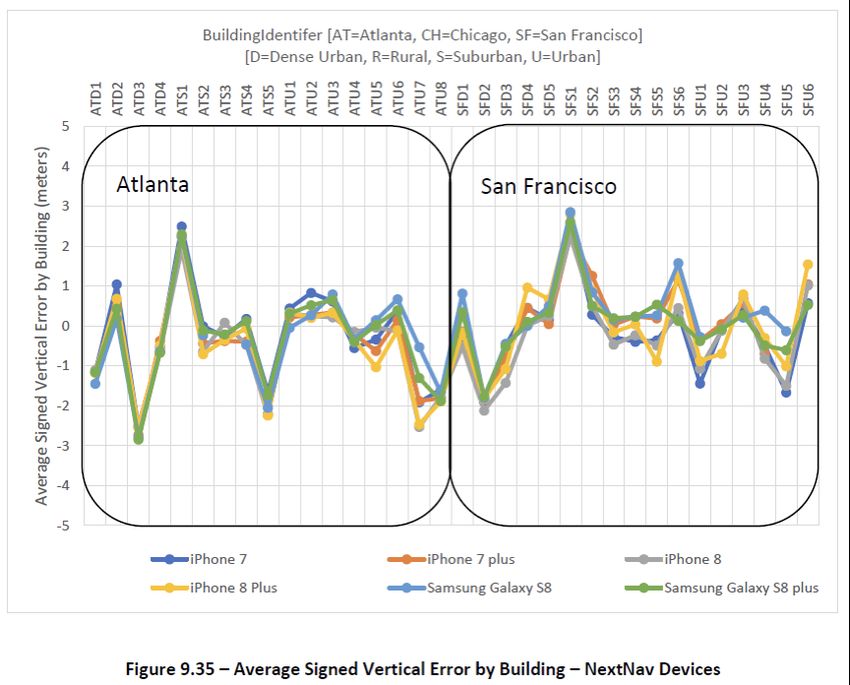
NextNav Z-Axis Location Accuracy
This section includes the summary results for NextNav broken out by morphology, city and handset.
NextNav vertical accuray results
Horizontal Vertical
Tests Tests Success- Avg Time Avg Bar- 67th 80th 90th Avg Within Avg Std.Dev. Avg Dis- 67th 80th 90th Avg Within
Initiated Com- ful Test to First ometric Percen- Percen- Percen- Uncer- Uncer- Altitude Altitude tance Percen- Percen- Percen- Uncer- Uncer-
pleted Yield (%) Fix (sec) Pressure tile (m) tile (m) tile (m) tainty tainty Error Error Error tile (m) tile (m) tile (m) tainty tainty
(mbar) (%) (m) (m) (m) (%)
Tests Bed Regions
All 38485 38485 100.0% 25.0 996.9 29.2 40.4 59.1 57.1 75.7% -0.4 1.0 1.1 1.3 1.8 2.5 3.4 96.5%
Atlanta 19419 19419 100.0% 25.0 980.0 29.9 42.3 60.5 62.9 75.8% -0.6 1.0 1.2 1.5 2.0 2.7 3.4 95.9%
San Francisco 19066 19066 100.0% 25.0 1012.1 28.7 38.8 57.7 51.2 75.6% -0.1 0.9 1.0 1.1 1.6 2.3 3.4 97.0%
Per Carrier
AT&T 18829 18829 100.0% 25.0 996.7 29.9 41.5 59.9 64.3 78.9% -0.4 1.0 1.1 1.3 1.8 2.5 3.4 96.2%
Verizon 19656 19656 100.0% 25.0 997.1 28.6 39.5 58.5 50.2 72.6% -0.3 0.9 1.1 1.3 1.8 2.5 3.4 96.7%
Morphology
Dense Urban 13413 13413 100.0% 25.0 995.8 40.5 57.4 82.7 74.8 69.3% -1.0 1.2 1.4 1.6 2.5 3.3 3.4 90.6%
Urban 15920 15920 100.0% 25.0 995.8 25.7 34.8 48.7 51.7 79.5% -0.2 0.7 0.9 1.1 1.5 1.9 3.4 99.5%
Suburban 9152 9152 100.0% 25.0 1002.5 21.1 28.4 39.1 40.5 78.3% 0.3 0.9 1.0 1.3 2.0 2.5 3.4 99.7%
Test Bed Regions by Morphology
Atlanta - Dense Urban 5753 5753 100.0% 25.0 977.0 39.2 57.2 86.9 101.5 74.7% -1.5 1.2 1.7 2.3 3.0 3.5 3.4 87.4%
Atlanta - Urban 9913 9913 100.0% 25.0 983.5 27.7 39.2 52.1 50.6 78.0% -0.2 0.7 0.9 1.1 1.5 1.9 3.4 99.3%
Atlanta - Suburban 3753 3753 100.0% 25.0 976.3 21.4 31.4 45.6 36.1 71.5% -0.2 0.9 1.2 1.7 2.1 2.5 3.4 99.9%
San Francisco - Dense Urban 7660 7660 100.0% 25.0 1011.0 41.0 57.5 80.9 54.7 65.2% -0.6 1.1 1.2 1.2 1.8 3.0 3.4 93.0%
San Francisco - Urban 6007 6007 100.0% 25.0 1014.2 22.9 29.2 38.4 53.6 82.0% -0.2 0.7 0.9 1.0 1.4 1.8 3.4 99.9%
San Francisco - Suburban 5399 5399 100.0% 25.0 1012.0 20.5 27.1 35.0 43.5 83.1% 0.6 0.9 1.0 1.1 1.7 2.5 3.4 99.6%
NextNav vertical accuray results by handset
Horizontal Vertical
Tests Tests Success- Avg Time Avg Bar- 67th 80th 90th Avg Within Avg Std.Dev. Avg Dis- 67th 80th 90th Avg Within
Initiated Com- ful Test to First ometric Percen- Percen- Percen- Uncer- Uncer- Altitude Altitude tance Percen- Percen- Percen- Uncer- Uncer-
pleted Yield (%) Fix (sec) Pressure tile (m) tile (m) tile (m) tainty tainty Error Error Error tile (m) tile (m) tile (m) tainty tainty
(mbar) (%) (m) (m) (m) (%)
Tests Bed Regions
All 38485 38485 100.0% 25.0 996.9 29.2 40.4 59.1 57.1 75.7% -0.4 1.0 1.1 1.3 1.8 2.5 3.4 96.5%
Atlanta 19419 19419 100.0% 25.0 980.0 29.9 42.3 60.5 62.9 75.8% -0.6 1.0 1.2 1.5 2.0 2.7 3.4 95.9%
San Francisco 19066 19066 100.0% 25.0 1012.1 28.7 38.8 57.7 51.2 75.6% -0.1 0.9 1.0 1.1 1.6 2.3 3.4 97.0%
Handset
Each individual handset model
Samsung Galaxy S8 5986 5986 100.0% 25.0 996.2 22.4 32.7 49.0 27.0 60.6% -0.2 1.0 1.1 1.3 1.9 2.7 3.4 95.7%
Samsung Galaxy S8 plus 6536 6536 100.0% 25.0 997.1 24.8 36.3 55.2 24.7 53.6% -0.3 1.0 1.0 1.1 1.7 2.4 3.4 96.2%
Iphone 7 6562 6562 100.0% 25.0 997.1 29.8 39.8 61.1 62.1 82.0% -0.4 0.9 1.1 1.3 1.8 2.5 3.4 97.1%
Iphone 7 plus 6299 6299 100.0% 25.0 996.9 32.3 43.8 62.8 93.7 89.6% -0.3 1.0 1.1 1.2 1.8 2.5 3.4 96.1%
Iphone 8 6544 6544 100.0% 25.0 997.1 33.2 44.3 64.5 70.0 85.4% -0.5 0.9 1.1 1.3 1.8 2.5 3.4 96.8%
Iphone 8 plus 6558 6558 100.0% 25.0 997.1 30.2 41.9 59.8 63.7 82.0% -0.4 1.0 1.2 1.4 1.9 2.6 3.4 96.8%
Atlanta individual handsets
Samsung Galaxy S8 3088 3088 100.0% 25.0 980.2 21.4 30.9 50.0 32.9 66.1% -0.6 1.0 1.2 1.5 2.0 2.7 3.4 94.5%
Samsung Galaxy S8 plus 3248 3248 100.0% 25.0 980.1 25.9 40.5 59.5 28.2 53.5% -0.5 1.0 1.2 1.4 1.9 2.7 3.4 94.7%
Iphone 7 3274 3274 100.0% 25.0 980.0 30.0 40.7 58.3 64.9 80.4% -0.4 1.0 1.2 1.5 2.0 2.7 3.4 97.1%
Iphone 7 plus 3265 3265 100.0% 25.0 980.0 32.0 43.2 59.0 111.4 91.5% -0.6 1.0 1.2 1.5 2.0 2.7 3.4 95.6%
Iphone 8 3270 3270 100.0% 25.0 980.0 35.3 48.9 70.0 70.5 82.3% -0.6 1.0 1.2 1.5 2.0 2.7 3.4 96.9%
Iphone 8 plus 3274 3274 100.0% 25.0 980.0 32.1 45.4 61.7 67.8 80.2% -0.7 1.0 1.2 1.5 2.1 2.7 3.4 96.4%
San Francisco individual handsets
Samsung Galaxy S8 2898 2898 100.0% 25.0 1011.7 24.6 35.2 48.7 20.8 54.7% 0.2 1.0 1.1 1.2 1.8 2.7 3.4 96.9%
Samsung Galaxy S8 plus 3288 3288 100.0% 25.0 1012.2 23.4 33.1 50.4 21.2 53.7% -0.1 0.9 0.9 0.9 1.3 2.1 3.4 97.7%
Iphone 7 3288 3288 100.0% 25.0 1012.2 29.2 39.3 65.5 59.4 83.5% -0.4 0.9 1.0 1.1 1.5 2.3 3.4 97.0%
Iphone 7 plus 3034 3034 100.0% 25.0 1012.3 32.7 45.2 67.4 74.7 87.6% 0.0 0.9 1.0 1.0 1.5 2.3 3.4 96.7%
Iphone 8 3274 3274 100.0% 25.0 1012.2 31.0 40.9 57.4 69.6 88.6% -0.4 0.9 1.0 1.2 1.7 2.2 3.4 96.7%
Iphone 8 plus 3284 3284 100.0% 25.0 1012.2 28.8 37.9 56.7 59.6 83.8% -0.1 0.9 1.1 1.3 1.7 2.4 3.4 97.2%
NextNav 2020 © Summary of ‘Report on Stage Z’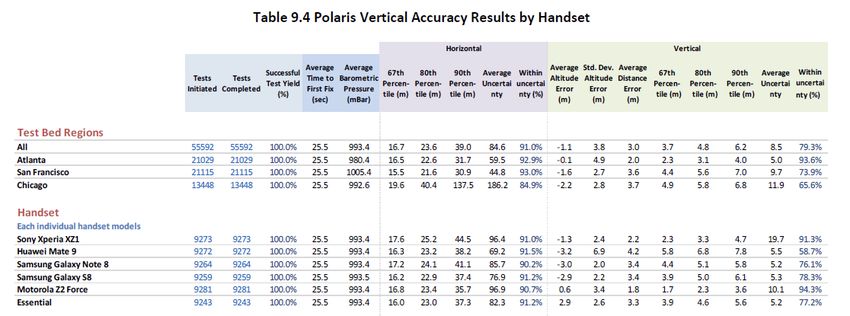
NextNav 2020 © Summary of ‘Report on Stage Z’
NextNav 2020 © Summary of ‘Report on Stage Z’
Appendix I: NextNav historical accuracy results

In addition to the CTIA testbed results summarized above, NextNav has demonstrated
high accuracy of its Pinnacle vertical location solution for many years prior. Below are
the results of two previous test results from reports produced in 2016 and 2013, with
indicators of how those results compare against FCC accuracy requirements.

NextNav 2020 © Summary of ‘Report on Stage Z’
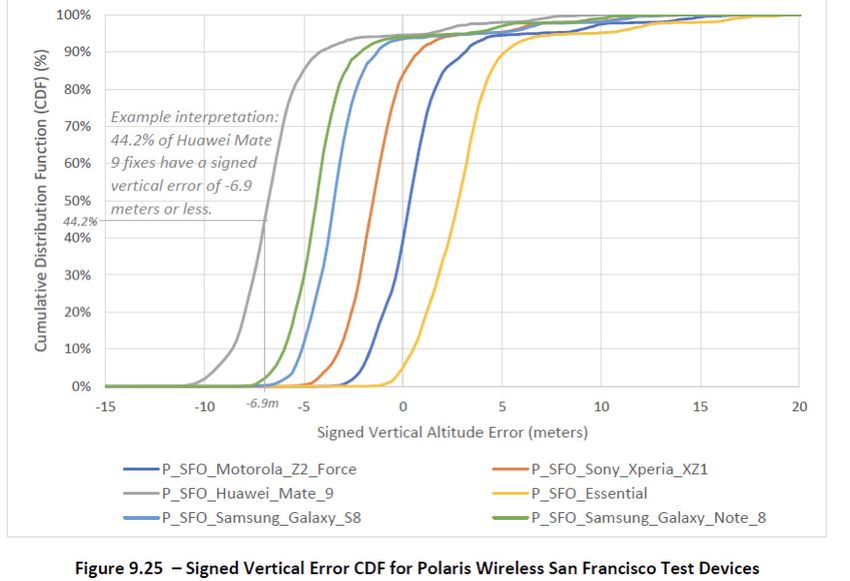
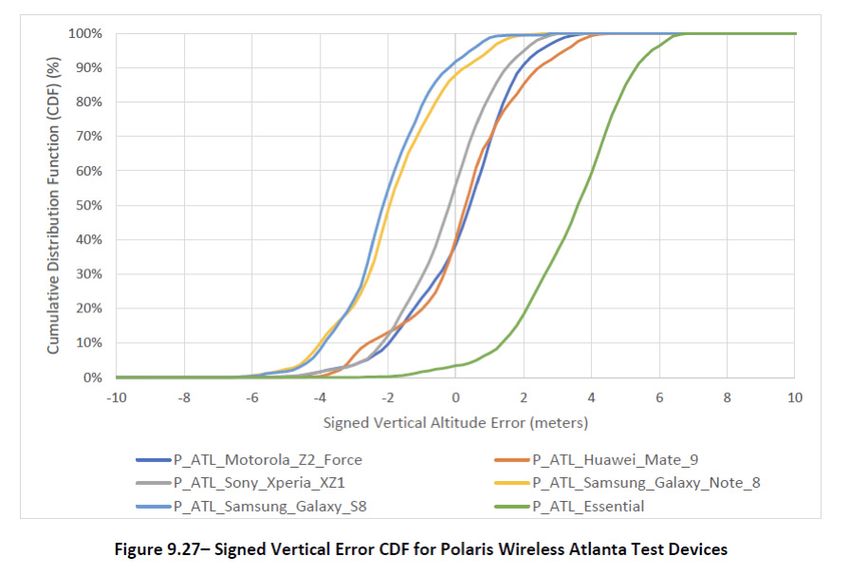
Appendix II: Polaris Wireless and Google

In addition to the NextNav Pinnacle service, the CTIA test bed also tested an OS-based
vertical location from Google and a multi-source vertical location from Polaris Wireless
as part of its “Stage Z” regimen.

The results for Polaris Wireless were publicly released. Following direct intervention by
Google with CTIA and the FCC, only a summary of the results were released for public
scrutiny. Some data from the Google tests were later included in third-party FCC filings,
however, providing insight into performance quality against competing solutions and
FCC requirements.

For context, below is a brief summary and a selection of data from both Google and
Polaris Wireless. The data from Polaris wireless is drawn directly from the CTIA report;
the data for Google is drawn from a T-Mobile filing with the FCC.

Google

Google’s testing in Stage Za was conducted in a commercially deployed configuration,
but at the time of testing it was not able to demonstrate full compliance with the FCC’s
vertical location accuracy benchmark.

T-Mobile estimates that vertical location obtained through Google’s ELS and Apple’s
HELO systems produce vertical locations of ±3 meters for about 55% of 911 calls, which
falls short of the FCC requirement of ±3m 80% of the time.

Yet even this estimate is speculative. T-Mobile created that number based on Google’s
testing in Stage Za (in which more than half of calls achieved a vertical location estimate
within ±3 meters), combined with an estimate that 50% of calls from iOS devices can
meet the vertical location benchmark—although iOS performance has not yet been
verified in the test bed—and weighted by the relative percentages of Android and iOS
devices on T-Mobile’s network.

NextNav 2020 © Summary of ‘Report on Stage Z’
Polaris Wireless

The Polaris Wireless Hybrid Location Engine (HLE) Z-axis hybrid is a software-based
solution that utilizes data from the handset including handset GPS, raw GPS, Barometer,
ECID, and WiFi. These measurements are collected in the Polaris Wireless location
Server where these sources are combined, and proprietary algorithms are applied to
generate a hybrid Z-location estimate.

Polaris Wireless originally proposed that its complete hybrid solution be put under test.
It also intended to collect test and calibration data within test buildings in each Test
Region in advance of the Z-axis test bed campaign. The TAC asked Polaris Wireless
not to enter potential test buildings in advance of the test since doing so would not be
representative of the process that can be scaled to the remainder of the country and
therefore would not render a fair assessment of the technology. Given this restriction,
Polaris Wireless opted not to include the 3D WiFi component of their hybrid location
solution and tested only the barometric component.

Polaris Wireless asserts that its barometric-based Z-axis capability was initially
commercially available in the market through an over-the-top application for iOS and
Android devices and was demonstrated to the FCC in 2014. Nevertheless, the Polaris
Wireless solution under Stage Z testing currently is not available on consumer handsets
and therefore required a software application, which was installed on the test handsets
by FES field technicians and configured for testing using Polaris Wireless specifications.

The Polaris Wireless z-axis solution includes the ability for an application to run in
the background of the device with the purpose of measuring device and barometric
sensor bias over time – continuous opportunistic (background) calibration. Device and
sensor bias are key sources of location error, and the Polaris Wireless software includes
proprietary algorithms to calibrate and compensate for these sensor biases, which may
improve accuracy performance. Polaris Wireless chose to disable this feature for Stage
Z testing based on their interpretation of available procedures and guidance from the
Test Bed’s TAC and Program Manager. (The Test Bed provided the same procedure to
both NextNav and Polaris). As such, Polaris Wireless results in the current test campaign

NextNav 2020 © Summary of ‘Report on Stage Z’
may underestimate the performance results that might be achieved using an effective
continuous (background) calibration algorithm for each individual mobile device.

NextNav 2020 © Summary of ‘Report on Stage Z’
NextNav 2020 © Summary of ‘Report on Stage Z’
NextNav 2020 © Summary of ‘Report on Stage Z’
You can also read