Outdoor Learning Hubs - A Scottish Attainment Challenge Innovation Fund Project Mike Harvey, Katrina Rankine, Rona Jensen Report 12 Dec 2017 ...
←
→
Page content transcription
If your browser does not render page correctly, please read the page content below
Outdoor Learning Hubs
A Scottish Attainment Challenge Innovation Fund Project
     Mike Harvey, Katrina Rankine, Rona Jensen     Report   12 Dec 2017

FINAL REPORT -MIKE HARVEY KATRINA RANKINE RONA JENSEN                     1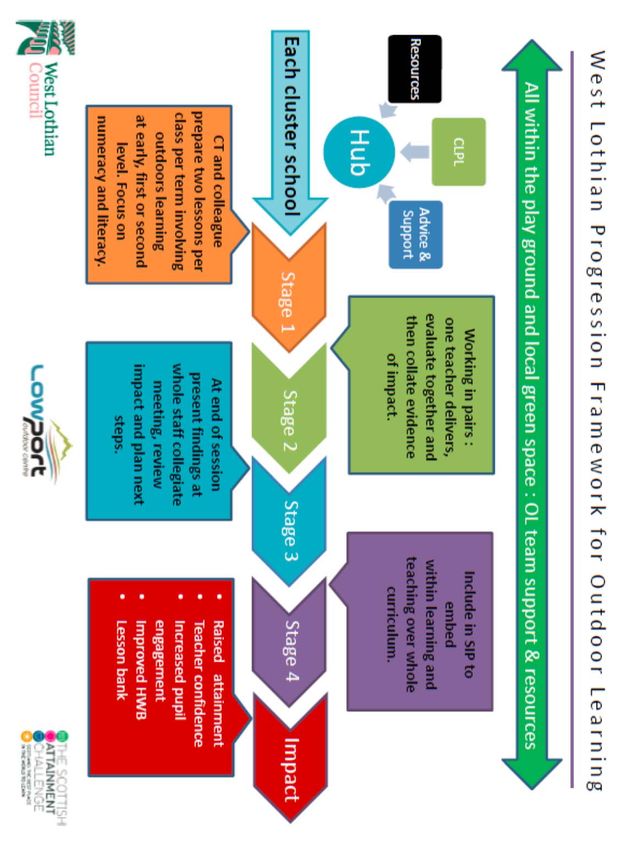
Acknowledgements

This project could not have been completed without a great deal of help and input from the
following people:

West Lothian Council

Fiona MacPhail, Fiona Stewart & Kim Kerr, Riverside Primary School
Allison Kennedy & Craig Potter, Knightsidge Primary School
Susan Mackenzie & Carolyn Brearley, Harrysmuir Primary School
Fiona Wales, Deans Primary School

Paul Stark, active schools and community sports manager, who provided resources and access to
information without which this project could not have been completed.

Michael Davis, from the Performance Management Team, was great in steering us through the
CEM data and producing much of the excellent analysis in the research section of this report.

Low Port Outdoor Center
A big thankyou to all of the outdoor team who covered for myself and Rona while we were away
working on this project. Also the domestic and admin team who helped deal with all the extra work
we created.

I would also like to express my thanks to John Lewis, the center manager at Low Port, for his work
on the original funding proposal and for pushing us to do “more”…all the time!

Lastly, the project team of Katrina Rankine (Principle Teacher) & Rona Jensen (Low Port Centre
Instructor), two excellent professionals who managed to make a difficult and sometimes stressful
project enjoyable.

If you have any questions about this report please contact:

Mike Harvey (Project Leader)
Low Port Outdoor Center,
1 Blackness road,
Linlithgow,
West Lothian EH49 7HZ

Tel. 01506 284402
Mike.Harvey@westlothian.gov.uk

FINAL REPORT -MIKE HARVEY KATRINA RANKINE RONA JENSEN                                                2
Introduction
Summary
The aim of this project was to raise attainment in literacy and numeracy through “Outdoor Learning
Hubs” formed around two primary school clusters within Livingston in West Lothian. The two
clusters were Inveralmond and Deans in Livingston.
This project was funded by Education Scotland as part of the Scottish Attainment Challenge to
reduce the poverty related equity gap within Scottish education.
The staff (1.5 FTE outdoor instructors & 0.5 FTE principal teacher) focused on an
Outdoor Learning and a predominately numeracy based research project that went
across both school clusters and involved two control schools, a total of 120 P5 children,
over the school year 2016-2017.
A separate project involved working with all the schools within the clusters (13 schools
and 325 children) to spread the literacy and numeracy programs developed during the
project in a sustainable manner to the school teaching staff. A CLPL programme for
teachers was also delivered as part of the project.
A significant increase in the value added data for Mental Arithmetic (MA) and
General Maths (GM) was displayed by the study group against both the control group
and the whole of the West Lothian P5 cohort. An average increase of 6 months for
Mental Arithmetic and 2 months for General Maths.
A health and wellbeing questionnaire study on the children’s attitudes to learning also
showed a 20% increase over the year while the control group decreased by 3% over
the same time period.
These results were unexpected and, we think, noteworthy in that for a 12 week programme (2hrs
per week) the children gained on average 6 months of Mental Arithmetic and 2 months of General
Maths against a similar cohort of children within the control schools.
Outdoor Learning taking place in West Lothian
FINAL REPORT -MIKE HARVEY KATRINA RANKINE RONA JENSEN 3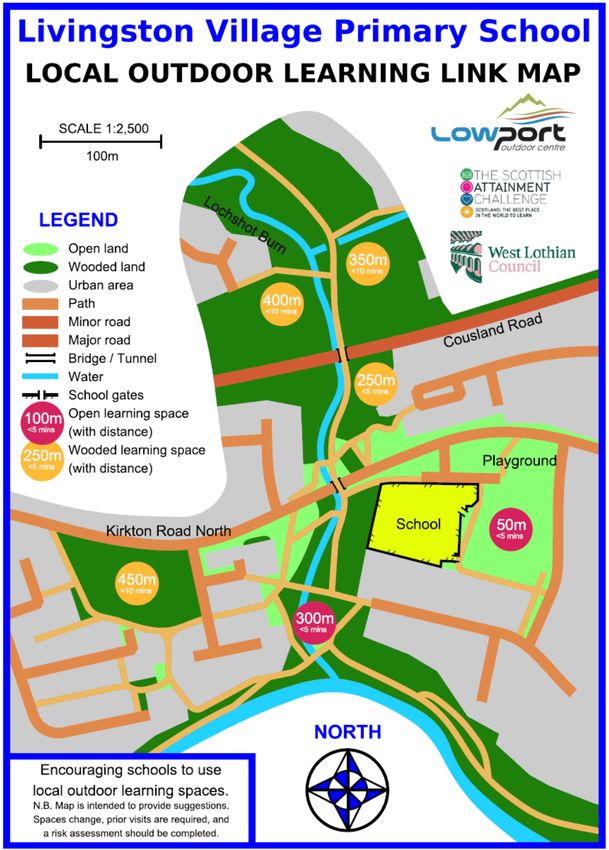
Methodology
Numeracy
We used CEM (Centre for Educational Management) data to identify areas requiring improvement
within the numeracy curriculum of the chosen P5 study schools.
Having identified the areas we wished to target for improvement, we designed a programme of
outdoor numeracy and literacy activities. As this study would run through the winter months of
January to April we wanted activities that would keep the children active.
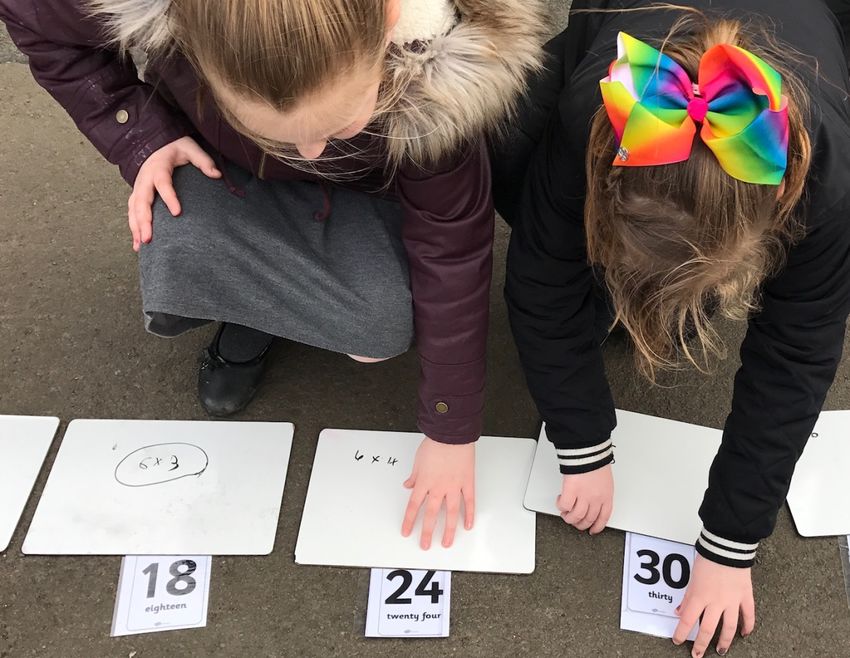
Therefore each activity involved active playground games, maths or literacy challenges and
orienteering of various types and difficulties.
Just to be clear, we use the word orienteering loosely. We took and adapted the orienteering
process of finding controls with a map and changed it to finding “challenges” in small groups. We
did this by setting up “challenges” at each control to involve a wide variety of mathematics and
literacy challenges i.e. mild, spicy or hot mathematics linked word problems and for literacy we
had storytelling, VCOP and ambitious vocabulary activities.
Nearly all of this work took place in the playground and to a lesser extent the local green spaces.
Where the Outdoor Learning took place
FINAL REPORT -MIKE HARVEY KATRINA RANKINE RONA JENSEN 4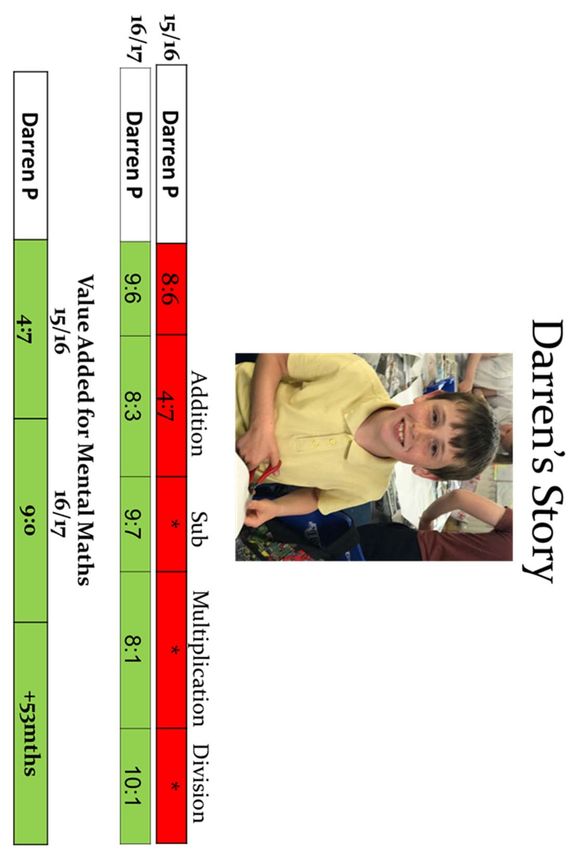
We used correctly scaled and detailed maps that were professionally produced to a high standard
(Appendix 3). All of the schools in the cluster were also provided with simplified safe travel maps
that identified all the local green space suitable for outdoor learning (Appendix 4).
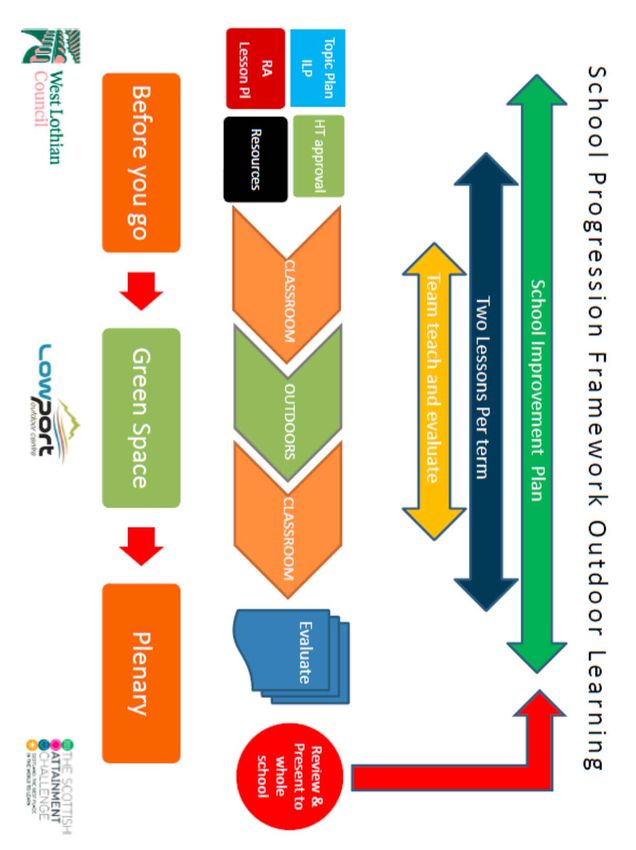
Both numeracy and literacy sessions were structured as illustrated in the diagram below. We tried
to involve as much feedback as possible on strategies to solve problems during the sessions and
afterwards in the classroom. The class teacher was closely involved in the activities, the plenary
sessions and encouraged to continue with the sessions both in class and in the playground.
Outdoor learning Session Structure
The other activities which followed on from the main study but did not precede the testing of the
children were a “Brilliant Residential” at the Low Port Outdoor center. This focused on both
curricular subjects in both numeracy and literacy and aspects of the John Muir Award. It was also
great fun.
FINAL REPORT -MIKE HARVEY KATRINA RANKINE RONA JENSEN 5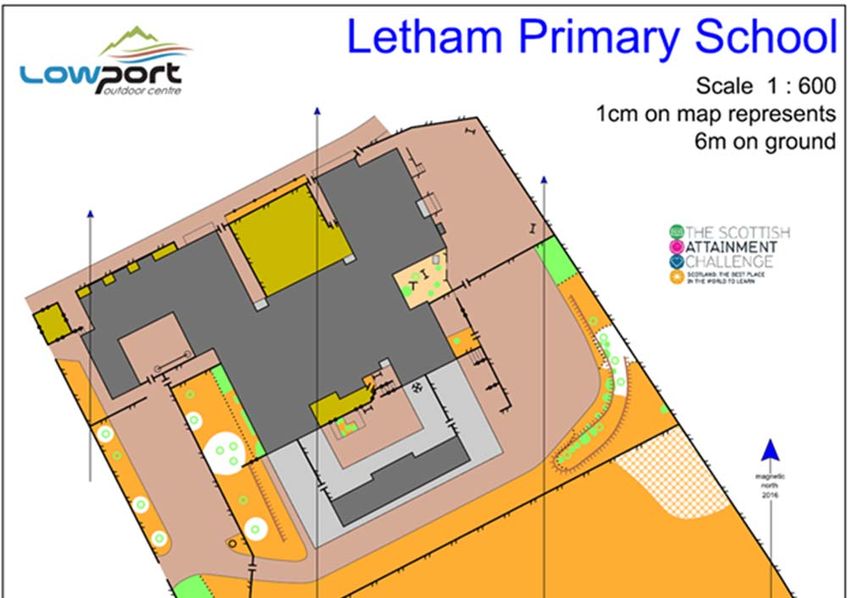
Research
Deprivation Analysis
Education Services utilise the Scottish Index of Multiple Deprivation (SIMD) in many ways to
compare various indicators of performance across different levels of deprivation. A key aim of the
Raising Attainment strategy is to close the attainment gap between the most and least advantaged
as deprivation is seen as a barrier to attaining, both locally and nationally.

We used this information to identify schools and classes both to work in and act as a control group:

Outdoor Learning – P5 classes in Knightsridge Primary School & Riverside Primary School
Control Groups – Two P5 classes within local clusters with a similar SIMD rank
West Lothian –     All pupils at P5 stage in West Lothian schools

                      Quintile 1     Quintile 2     Quintile 3       Quintile 4       Quintile 5
Outdoor Learning      66.67%         17.54%         15.79%           0.00%            0.00%
Control Group         47.50%         35.00%         10.00%           1.25%            5.00%
West Lothian          18.23%         26.23%         17.39%           17.92%           19.83%

                                        SIMD Analysis
                      Outdoor Learning Group      Control Group        West Lothian
             70.00%
             60.00%
             50.00%
             40.00%
             30.00%
             20.00%
             10.00%
              0.00%
                        Quintile 1   Quintile 2   Quintile 3     Quintile 4   Quintile 5

The above information shows the deprivation profile of the groups involved in the Outdoor
Learning project and the wider West Lothian P5 population.

FINAL REPORT -MIKE HARVEY KATRINA RANKINE RONA JENSEN                                                  6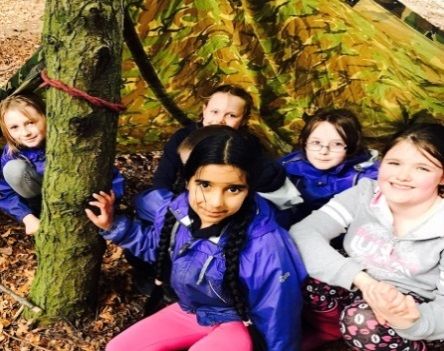
Adaptive Testing

Adaptive Testing is used throughout West Lothian Primary Schools as a diagnostic tool to identify
areas of strengths and weakness in a pupils’ learning. This information can be used to assess the
impact of the outdoor learning work.

The focus of this work has been in numeracy, there are two adaptive tests that focus on this part of
the curriculum – one test of Mental Arithmetic (MA) and one test of General Maths (GM).

                                 Average Age Equivalency
                          Outdoor Learning          Control Group     West Lothian
                 9.80                                                         9.61
                                             9.59
                 9.60
                              9.35                                     9.34
                 9.40
                                                               9.18
                 9.20                9.02
                 9.00
                 8.80
                 8.60
                                     MA                                GM

The above graph shows the average age equivalency score of the identified groups, pupils should
be close to or above their chronological age at the time of the test to be identified as being on-track.

                                     Average Value Added
                          Outdoor Learning          Control Group     West Lothian
                 1.50         1.28
                                                               1.04
                 1.00                        0.86                      0.86   0.81
                                     0.75

                 0.50

                 0.00
                                     MA                                GM

The above graph shows the average value added of the identified groups, value added is the
difference between age equivalency scores in 2015/16 and 2016/17. As there is usually around one
calendar year between the tests we would expect value added results to be around one year.

FINAL REPORT -MIKE HARVEY KATRINA RANKINE RONA JENSEN                                                      7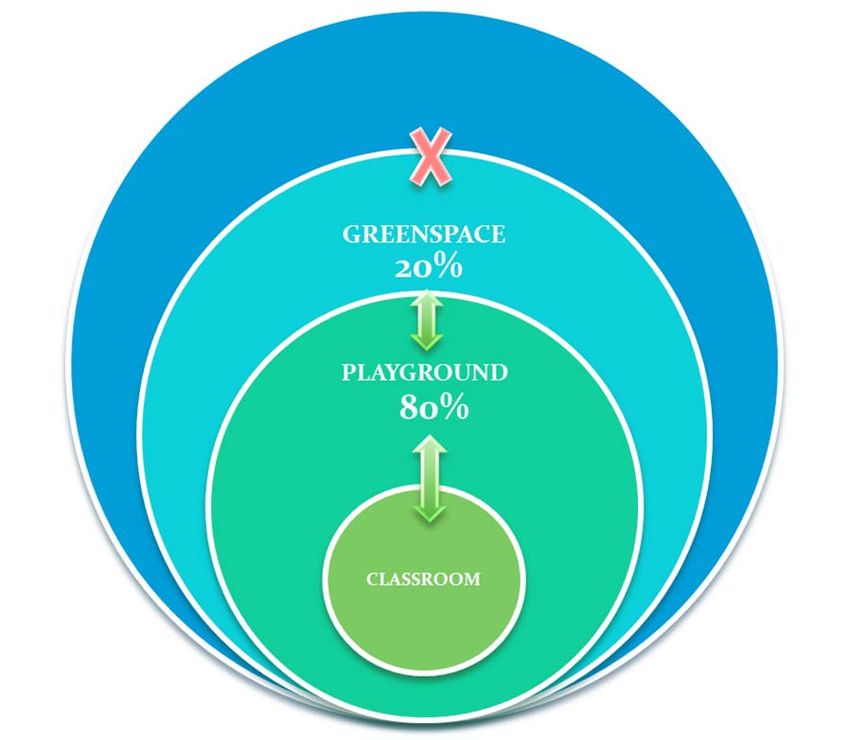
Percentage of Pupils adding 1 year or
                                      more
                          Outdoor Learning    Control Group    West Lothian
                80.00%
                              59.65%
                60.00%                                   45.61%
                                    37.04%38.82%               34.57%35.39%
                40.00%
                20.00%
                 0.00%
                                       MA                        GM

                         Percentage of Pupils adding 0.65 of a
                                    year or more
                          Outdoor Learning    Control Group    West Lothian
                80.00%        70.18%                     68.42%
                                          57.14%               60.49%58.47%
                60.00%              50.62%
                40.00%
                20.00%
                 0.00%
                                       MA                        GM

The above two graphs show the percentage of pupils making good progress in Mental Arithmetic
and General Maths between adaptive tests in 15/16 and 16/17. The first graph measures pupils
adding 1 year or more to their age equivalency. The second graph measures pupils adding 0.65 of a
year to their age equivalency.

As well as overall performance in Mental Arithmetic and General Maths the adaptive testing can be
used to drill down further into the component parts of the testing.

Analysis of this can be seen below (this measures % of pupils whose age equivalency is within 0.3
of a year or better from chronological age):

                     MA                Addition      Subtraction      Multiplication   Division
Outdoor Learning     49.12%            52.63%        59.65%           45.61%           50.88%
Control Group        35.80%            48.15%        40.74%           39.51%           44.44%
West Lothian         54.51%            56.78%        51.13%           54.87%           53.89%

                     GM                Number 1      Number 2         Data             MSS
Outdoor Learning     43.86%            36.84%        56.14%           31.58%           50.88%
Control Group        39.51%            34.57%        50.62%           48.15%           48.15%
West Lothian         53.67%            50.96%        57.76%           55.14%           54.78%

FINAL REPORT -MIKE HARVEY KATRINA RANKINE RONA JENSEN                                               8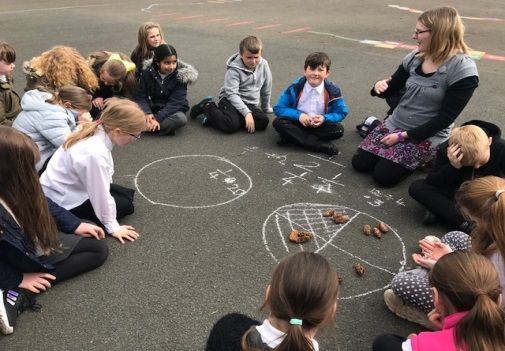
This is shown below graphically as the % of pupils who's age equivalency is within 0.3 of a
year or better than chronological age

                        Analysis by Numerical Area
 70.00%                                        59.65%
 60.00%                      52.63%                                                50.88%
           49.12%                     48.15%                     45.61%
 50.00%                                                                                     44.44%
                                                        40.74%            39.51%
 40.00%             35.80%
 30.00%
 20.00%
 10.00%
  0.00%
                MA              Addition        Subtraction      Multiplication      Division

                              Outdoor Learning Group       Control Group

                        Analysis by Numerical Area
 60.00%                                        56.14%
                                                        50.62%            48.15%   50.88%48.15%
 50.00%    43.86%
                    39.51%   36.84%34.57%
 40.00%                                                          31.58%
 30.00%
 20.00%
 10.00%
  0.00%
                GM             Number 1          Number 2            Data              MSS

                              Outdoor Learning Group       Control Group

FINAL REPORT -MIKE HARVEY KATRINA RANKINE RONA JENSEN                                                9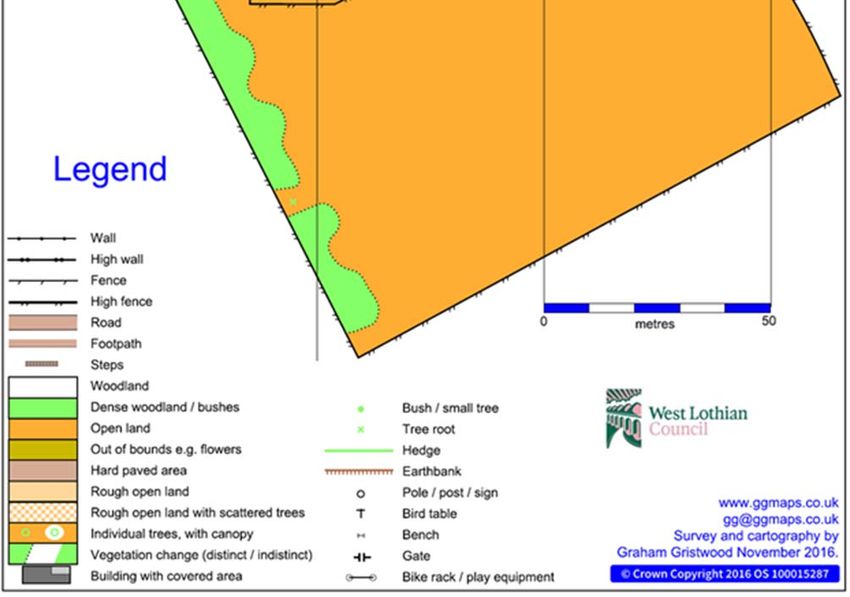
Health and Wellbeing
We used a simple questionnaire to ask the children eight questions about how they were getting on
at school and what they were learning (see below). This was administered to the study schools and
the control schools at the start and end of the project. We selected four of the questions that were
linked to the children’s achievement, learning and activity levels for analysis.

FINAL REPORT -MIKE HARVEY KATRINA RANKINE RONA JENSEN                                                  10
HWB Questionnaire results

FINAL REPORT -MIKE HARVEY KATRINA RANKINE RONA JENSEN   11
Teacher Questionnaire results (See Appendix 5)

Before the project began we were interested in finding out how much Outdoor Learning was taking
place within the 13 primary schools in the clusters we would work with. We conducted a survey of
the teaching staff to see what the attitudes to outdoor learning were and how often this was
happening in the primary schools.

The main findings are summarized below:-

Graph 1
This indicates the majority of teaching staff consider Outdoor Learning to be “very effective” at
engaging learners and “extremely effective” at improving health and well-being. It was also
considered to be “moderately effective” at improving attainment in numeracy and literacy.

Graph 2
This shows that between 40-50% of teachers “Sometimes” consider Outdoor Learning when
planning literacy and numeracy outcomes.

Graph 3
In an average week, between 60% and 69% of teachers do no outdoor teaching of either numeracy
or literacy respectively.
Between 24% to 34% of teachers did approximately one hour of Literacy and Numeracy
respectively in an average week.

Graph 4
53% of teachers, on average, do between 1-5 lessons per term outdoors (Playground, Greenspace
etc.)

Graph 5
Within the last 3 years just over 57% of the teachers responding to this survey had attended CLPL
in Outdoor Learning.

FINAL REPORT -MIKE HARVEY KATRINA RANKINE RONA JENSEN                                               12
Conclusion and Discussion
This project over a short period of time, 12 weeks for 2 hours a week, appears to have had a
positive impact on the MA, GM and the health and wellbeing of the primary school pupils we
worked with compared to control schools and the general West Lothian school population in P5.

The project and school staffs were certain the project would have an impact on the pupils, all of
whom enjoyed this Outdoor Learning challenge approach to numeracy and literacy. However, the
scale of the increase in numeracy and the number of pupils that showed a large increase in Value
Added for MA and GM was unexpected.

If you are unfamiliar with adaptive testing, Value Added is the difference between the expected
result (established by baseline testing) and the actual performance under test conditions. It has
many influences and is subject to a number of random errors but generally it is useful for
evaluating changes, or as in our case, interventions across school populations from similar socio-
economic backgrounds.

Bearing this in mind, what appears to have occurred during this project is the top performing
children stayed in the same relative position, as did the very poorest, before and after the project. In
other words these children, with a few exceptions, performed much as expected.

It was in the middle and lower quota of the student grouping that the gains took place. These
children made substantial gains between the test periods and gave us the result illustrated by the
two graphs on page 6.

It was the scale of this gain, half a year, averaged across the whole study group that surprised the
project team.

These results were particularly illustrated in the case of Darren P, a P5 pupil who took part in the
outdoor numeracy programme (see Appendix 6). The scores are for 15/16 and 16/17 and show that
he made value added gains of almost 53 months. This equates to a 4 ½ year gain in MA over a 12
week intervention and although this was one of the largest gains, it was not unusual within the
study.

We should also like to note that one area we did not cover during the project was data handling.
After discussions with the local education officers responsible for numeracy we decided against
including this topic. The result of this was that our study group performed worse than the control
group (See Appendix 7)

However, we know it would be wrong to attribute these gains and figures solely to our project due
to the complex and often linked variables which can influence attainment. A longer study, over a
number of years, would be required to identify accurately any underlying pattern and specific
effects. But given the undeniably positive nature of these results it would definitely be worth
pursuing.

The health and wellbeing evaluation was conducted through surveys in November 2016 and again
in June 2017; the final evaluation being after the children had taken part in both John Muir Award
activities and a Brilliant Residential experience at the Low Port Outdoor Centre.

FINAL REPORT -MIKE HARVEY KATRINA RANKINE RONA JENSEN                                                      13
Again this showed a positive result, a 20% improvement over the school year. Again we were
slightly surprised at the small drop in HWB (3%) within the control school groups.

We cannot comment on the control school results other than to say the school staff reported the
children taking part in the main study wholeheartedly enjoyed the Outdoor Learning, the way we
presented schoolwork as challenges, the John Muir Award and the Brilliant Residential experience.

A more formal representation of why we think this worked is detailed in our theory of change
adapted from Griffith A, Burns M (2015) Outstanding Teaching, Teaching Backwards. Crown
House.

                                 Theory of Change

This theory involves five elements, all of which we used, but the one that kept coming up time and
time again, was engagement.

At almost every opportunity we took the children out into the green spaces around the school and
the local community. These were places they knew and had an emotional connection with; they
would often explain how they played in these areas or visited it with family members.

Perhaps the simple emotional connection with these local places together with the challenge
element we introduced resulted in this educational engagement. We certainly think this happened

FINAL REPORT -MIKE HARVEY KATRINA RANKINE RONA JENSEN                                                14
and the school staff made encouraging comments to this effect during the project. But one thing
was certain; these children enthusiastically embraced their own learning.
The only other expectations we placed on the pupils was that effort was important, they would be
working autonomously in small groups and that feedback would be provided quickly. We also
emphasized simple numerical problem solving strategies and the use of drawings with chalk or
whiteboards to explain this further, if it was required.
Each session was finished with a plenary that allowed the children to discuss their strategies and
hear how other children had tackled the numerical “challenges”.
We also encouraged the class teachers to continue with similar challenges and numeracy games
between the outdoor sessions.
Much of this work was conducted with the teacher helping and actively taking part. All of these
sessions were based around minimal resources, the majority of which could be found within school.
Yet while we did this outdoor learning throughout the entire winter, week in and week out, we did
not see another class outdoors in any of the schools we worked with. It was only towards the end of
March that we began to see this happening. These were few in number and predominately early
years or nursery classes. This anecdotal observation falls in line with our survey results in
Appendix 6.
However despite this, we felt the teacher survey results were encouraging. To see that 48% of the
teachers felt that Outdoor learning was Very Effective at engaging pupils and also 35% felt it was
Extremely Effective at improving HWB.
We agree with this result and it reinforces the role of Outdoor Learning as an effective tool for
engaging pupils and raising attainment, as this study cautiously suggests.
Recommendations
1. Conduct an extended longer term or longitudinal study into the effect of outdoor learning on
raising attainment in numeracy and literacy using the model discussed above or a similar
one.
2. Trial, on a wider basis, of the Outdoor learning Hub model and the West Lothian
Progression Framework developed as part of this study (Appendix 1 & 2) as a simple tried
and tested method of developing Outdoor Learning across a whole school and cluster.
Ideally this would from part of a strategic plan to develop Outdoor Learning within the local
authority.
3. Use the Leuven Scale or a similar instrument to measure the engagement of pupils with
Outdoor Learning as opposed to traditional classroom teaching of numeracy or literacy.
Again this would form part of a wider or longer term study.
4. Metacognitive strategies, which we tried to apply, could be developed more explicitly into
an Outdoor Learning model or framework with different age and stage applications.
FINAL REPORT -MIKE HARVEY KATRINA RANKINE RONA JENSEN 15Appendix 1 FINAL REPORT -MIKE HARVEY KATRINA RANKINE RONA JENSEN 16
Appendix 2

FINAL REPORT -MIKE HARVEY KATRINA RANKINE RONA JENSEN   17
Appendix 3

FINAL REPORT -MIKE HARVEY KATRINA RANKINE RONA JENSEN   18
Appendix 4

FINAL REPORT -MIKE HARVEY KATRINA RANKINE RONA JENSEN   19
Appendix 5 Teacher Survey results

Graph 1

FINAL REPORT -MIKE HARVEY KATRINA RANKINE RONA JENSEN   20
Graph 2

                             How often teachers consider Outdoor learning
                                when planning Literacy and Numeracy
                                             outcomes?

                         60.00%
                         50.00%
  % of the time

                         40.00%
                         30.00%
                         20.00%
                         10.00%
                         0.00%
                                   NEVER     RARELY    SOMETIMES     VERY OFTEN      ALWAYS
                        Literacy   11.29%    29.03%      41.94%         9.68%         8.06%
                        Numeracy   9.52%     20.63%      49.21%        12.70%         7.94%

Graph 3

                              What proportion of your time in an average
                             week is dedicated to teaching either Literacy
                                       or Numeracy outdoors?

                         80.00%
                         70.00%
  % of time dedicated

                         60.00%
                         50.00%
                         40.00%
                         30.00%
                         20.00%
                         10.00%
                         0.00%
                                            APPROX 1   APPROX 2-3   APPROX 4-5    MORE THAN
                                   NONE–
                                              HR–        HRS–         HRS–          5HRS–
                        Literacy   69.49%    23.73%      6.78%        0.00%         0.00%
                        Numeracy   61.29%    33.87%      4.84%        0.00%         0.00%

FINAL REPORT -MIKE HARVEY KATRINA RANKINE RONA JENSEN                                         21
Graph 4
How many lessons per term, on average, do
you teach outdoors?(playground, local green
spaces etc)
60.00%
Average % of lessons
50.00%
40.00%
30.00%
20.00%
10.00%
0.00%
More than
None 1-5 5-10 10-15 Responses
15
Series1 12.50% 53.13% 12.50% 7.81% 6.25% 7.81%
Graph 5
When did you last attended Outdoor Learning
CLPL?
35.00%
% attending training
30.00%
25.00%
20.00%
15.00%
10.00%
5.00%
0.00%
within the within the more than
within the
Never last 3 last 5 5 years other
last year
years years ago
Attended Training 25.00% 26.56% 31.00% 6.25% 4.60% 6.26%
FINAL REPORT -MIKE HARVEY KATRINA RANKINE RONA JENSEN 22Appendix 6 FINAL REPORT -MIKE HARVEY KATRINA RANKINE RONA JENSEN 23
Appendix 7

FINAL REPORT -MIKE HARVEY KATRINA RANKINE RONA JENSEN   24
You can also read