2019 HALF YEAR RESULTS PRESENTATION - 11 September 2019 - Capital & Regional

Page created by Howard Chang
 
CONTINUE READING
2019 HALF YEAR RESULTS PRESENTATION - 11 September 2019 - Capital & Regional
2019 HALF YEAR
RESULTS PRESENTATION
     11 September 2019
2019 HALF YEAR RESULTS PRESENTATION - 11 September 2019 - Capital & Regional
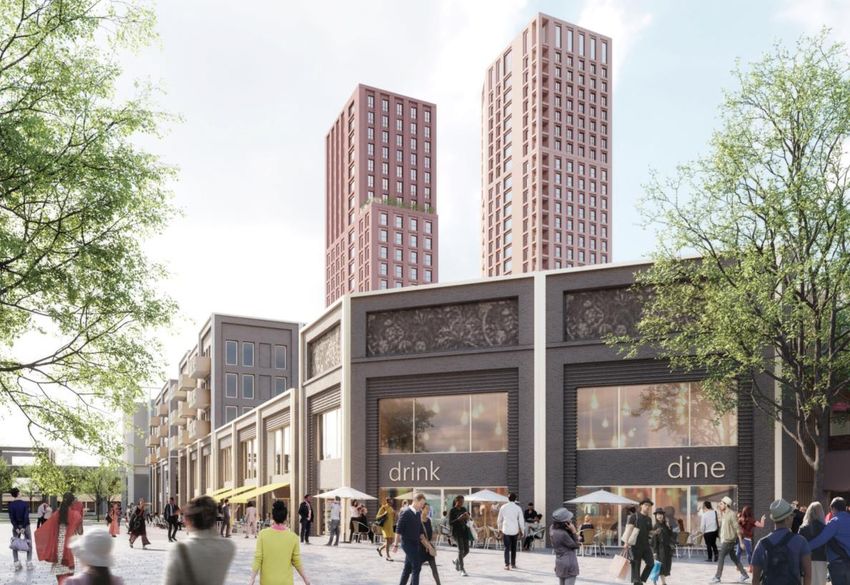
RESULTS AND MARKET OVERVIEW

Lawrence Hutchings
Chief Executive
2019 HALF YEAR RESULTS PRESENTATION - 11 September 2019 - Capital & Regional
EXECUTIVE SUMMARY

     H1 2019 – resilient operational performance

     Strategy delivering strong relative results

     Market backdrop – structural challenges continue

     Continued focus on balance sheet

     Announcement of possible partial offer in cash and subscription for
      new shares

3      capreg.com
2019 HALF YEAR RESULTS PRESENTATION - 11 September 2019 - Capital & Regional
H1 2019 OVERVIEW
Controlling the controllables
   Footfall significantly outperformed                                                 Leasing
    the national index                         37.2m shopper                            spreads                                 High
                                                 visits in H1
                                                                                     +6.9% to ERV                            occupancy
                                               outperforming
   Continuing occupier demand                                                         +31.2% to                               96.8%
                                               index by 1.8%
    reflected in high occupancy                                                        passing1

   44 new lettings and renewals
                                                                                        EPRA NAV
                                               Adjusted Profit                                                                      NRI
                                                                                        per share
   Positive letting activity helping to                -4.5%                                                                      -3.1%
                                                                                           52p
    offset impact of CVAs
                                           1


                                               For lettings and renewals (excluding development deals) with a term of five years or longer and which did
    Investment and repositioning               not include a turnover element or service charge restriction.

       £5.9m capex in period

4    capreg.com
2019 HALF YEAR RESULTS PRESENTATION - 11 September 2019 - Capital & Regional
H1 2019 FINANCIAL RESULTS

Stuart Wetherly
Group Finance Director
2019 HALF YEAR RESULTS PRESENTATION - 11 September 2019 - Capital & Regional
FINANCIAL RESULTS
Focus on income delivers resilient results
                                                                              H1 2019                                        H1 2018                              Change
Profitability
Net Rental Income                                                              £25.2m                                         £26.0m                                -3.1%
Adjusted         Profit1                                                       £14.8m                                         £15.5m                                -4.5%
Adjusted Earnings per share                                                     2.04p                                          2.15p                                -5.1%
                                                                          30 June 2019                              30 December 2018                              Change
Net Asset Value
EPRA NAV                                                                      £377.2m                                        £431.7m                       -£54.5m (-12.6%)
NAV per share                                                                     51p                                            60p                           -9p (-15.0%)
EPRA NAV per share                                                                52p                                            59p                           -7p (-11.9%)
Group Debt
Net debt to property value                                                       52%                                            48%                                +4 pps
Average maturity                                                             5.9 years                                      6.3 years                            -0.4 years
Cost of debt2                                                                   3.26%                                         3.27%                               -0.01pps
1   Adjusted Profit incorporates profits from operating activities and excludes revaluation of properties and financial instruments, gains or losses on disposal, exceptional items and other defined terms.
2   Assuming RCF fully drawn.

6           capreg.com
2019 HALF YEAR RESULTS PRESENTATION - 11 September 2019 - Capital & Regional
CVAs AND INSOLVENCIES
Continued occupier restructuring headwinds
    H1 2019 National Retail Failures                C&R wholly-owned portfolio
                                                           (H1 2019)
         Retailers                   Total Stores     Retailers   Units impacted

              8                        1,444             4             13
Source: Centre for Retail Research

     Four CVA’s - Debenhams, Arcadia, Monsoon/Accesorize and Select - have impacted 13 units in
      H1 2019
     Total expected impact of all of the 2019 CVA’s and administrations experienced to date is £1.3m,
      of which the majority (£1.1m) will be borne in the second half of the year – or £2.3m on an
      annualised basis.
     H1 2019 was also impacted by £0.9m from full period impact of 2018 CVAs and administrations

7         capreg.com
2019 HALF YEAR RESULTS PRESENTATION - 11 September 2019 - Capital & Regional
ADJUSTED PROFIT
Robust performance in challenging market

    Amounts in £m                                  H1 2019   H1 2018
    Net rental income
     Wholly-owned assets                              25.2      26.0
     Kingfisher, Redditch                                -       0.1
    Net interest                                     (9.4)     (9.4)
    Snozone profit                                     1.0       1.0
    Central operating costs net of external fees     (2.0)     (2.2)
    Tax                                                  -         -
    Adjusted Profit                                   14.8      15.5
                                                    -4.5%

    Adjusted Earnings per Share                     2.04p      2.15p
                                                    -5.1%

8         capreg.com
VALUATIONS
Geographic weighting mitigating investment market headwinds

Property at independent     30 June       30 December     Headline
                                                          Valuation
valuation                     2019           2018          Change           REGIONAL
                                                                              10%
                            £m    NIY %     £m    NIY %
London
Ilford                     82.4   5.54%    86.2   5.69%
                                                              -3.0%
Walthamstow               127.0   4.85%   124.6   5.01%               SOUTH EAST                          LONDON
                                                            -£13.3m
Wood Green                226.4   5.28%   238.3   5.12%                  35%                                55%

South East
Hemel Hempstead            41.7   7.74%    44.9   7.35%
                                                              -9.8%
Luton                     173.0   7.25%   195.4   7.01%
                                                            -£30.5m
Maidstone                  64.1   8.00%    69.0   7.74%
Regional
                                                             -14.5%
Blackburn                  82.7   8.42%    96.8   7.70%     -£14.1m           Valuation at 30 June 2019
                                                              -6.8%
Portfolio                 797.3   6.34%   855.2   6.23%
                                                            -£57.9m

9        capreg.com
GROUP DEBT
Long-term diversified debt structure

                                                                                                         Average             Duration with
                                                  Debt             Cash          Net debt           interest rate1   Fixed     extensions
                                                    £m                £m                 £m                    %        %           Years
Four Mall assets                                265.0             (10.0)             255.0                  3.33      100             7.1
Luton                                           107.5              (6.7)             100.8                  3.14      100             4.5
Hemel Hempstead                                   26.9             (0.8)               26.1                 3.42      100             3.6
Ilford                                            39.0             (1.7)               37.3                 2.76      100             4.7
RCF/(Group Cash)                                       -           (6.1)               (6.1)                3.81        -             2.6

Total                                           438.4             (25.3)             413.1                  3.26       94             5.9

1 Assuming    loans fully drawn.
2   The Group’s Revolving Credit Facility of £15 million was undrawn and fully available at 30 June 2019.

10         capreg.com
COVENANT HEADROOM
Managing headroom in uncertain markets

                                                         Current LTV          LTV              LTV                Headroom to covenant as %
                                           Debt                                                                     of June 2019 valuation:
               Facility                                      as at          cash trap         default
                                            £m
                                                         30 June 2019       covenant         covenant              Cash trap            Default

Four Mall Assets                           265.0              53%              65%              70%                   18.5%             24.3%

Luton1                                     103.0              60%               n/a1           80%1                     n/a             25.6%

Ilford                                     39.0               47%              60%              70%                   21.1%             32.4%

Hemel Hempstead2                           26.9              43%2               n/a             60%                     n/a             27.7%

1   Luton debt pro-forma reflecting terms agreed post 30 June 2019. £4.5m of cash within the structure applied to loan. Cash trap covenant waived
    and default covenant increased to 80% until 30 September 2020 (revert to 65% and 70% respectively thereafter).
2   Hemel Hempstead LTV reflects amended agreement with new £7m development facility completed on 13 March 2019. Covenant assessed on
    current loan to projected Gross Development Value of scheme with leisure development. Default covenant shown as no cash trap.

11        capreg.com
DELIVERING STRATEGY

Lawrence Hutchings
Chief Executive
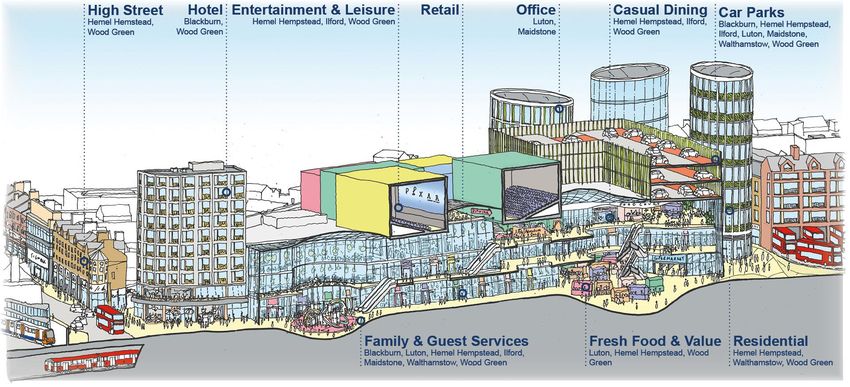
THE PILLARS OF OUR STRATEGY

     Redefine –           Reposition –            Refocus –         Enhance –
     community shopping   assets and retail mix   management team   shareholder value
     centres

13      capreg.com
FOCUS ON REPOSITIONING
Three steps to repositioning

                  1                   2                 3
          OPERATIONS &             LEASING        DEVELOPMENT
           MARKETING                              & INVESTMENT

        • ATTRACT              • ADAPT RETAIL    • ADD DENSITY
          CUSTOMERS              FOOTPRINT       • MIXED USE
        • DRIVE FOOTFALL       • INCOME             • RESIDENTIAL
        • RETAILER               GENERATION &       • OFFICES
          PERFORMANCE            GROWTH             • OTHER
                               • REMERCHANDISE   • MAXIMISE VALUE

14   capreg.com
OPERATIONAL KPIs
Community masterplan-led strategy delivering resilient underlying fundamentals

H1 2019 operational KPIs
                                                                                    1
Footfall                   37.2m     -1.8%

                                                                                 OPERATIONS & MARKETING
Footfall to benchmark               +1.8%

Frequency of
                               1.2 per week
visits

Click and collect                    +19%

Occupancy                  96.8%   -0.2 pps

15   capreg.com
WALTHAMSTOW FIRE
Re-opening plan
 • Fire broke out on Monday 22 July 2019 and brought under control the same day
 • c.75% of the centre’s stores are now reopen and trading
 • The Group is fully insured for both reinstatement and loss of income.                                   1

                                                                                                        OPERATIONS & MARKETING
                                                                                  Extent of fire

                                                                                  Phase 1 – Reopened
                                                                                  from 26/07/19
                                                                                  Phase 2 – Reopened
                                                                                  from 01/08/19

                                                                                  Phase 3 – Reopened
                                                                                  from 04/09/19

                                                                                  Phase 4 – Reopening
                                                                                  3-9 months

16   capreg.com
LEASING KPIs
Non-discretionary retailers less impacted by structural changes

 H1 2019 leasing KPIs
                                                                                                     50
                                                                                                           Leasing Transactions - Volumes & Values
                                                                                                                                                           4.0                    2

                                                                            Number of Transactions

                                                                                                                                                                 Headline Rent
                                                                                                     40                                                    3.0
 New lettings                                    21             £1.6m                                30
                                                                                                                                                           2.0
                                                                                                     20
                                                                                                     10                                                    1.0
 Renewals settled                                23             £1.5m                                  0                                                   -
                                                                                                            H1   H2   H1   H2   H1   H2   H1
                                                                                                           2016 2016 2017 2107 2018 2018 2019
 Total                                           44             £3.1m
                                                                                                               Lettings & Renewals     Headline Rent (£m)

                                                                                                                                                                                 LEASING
 Premium to previous rent 1                                  +31.2%
                                                                                                                     Leasing Spreads to ERV
                                                                                                       10.0%

                                                                                      Premium to ERV
 Premium to             ERV 1                                   +6.9%                                  8.0%
                                                                                                       6.0%
                                                                                                       4.0%
 WALE                                                     7.2 years                                    2.0%
1    For lettings and renewals (excluding development deals) with a term                               0.0%
     of five years or longer and which did not include a turnover element                                        H1      FY     H1     FY     H1     FY         H1
     or service charge restriction.                                                                             2016    2016   2017   2017   2018   2018       2019

17         capreg.com
TENANT BASE
A diversified tenant mix
Top 10 retailers by contracted rent

Alliance Boots Ltd.
                                                                   % of rent

                                                                     3.36
                                                                               Stores

                                                                                 6
                                                                                         2
AS Watson                                                            3.31       17

Debenhams                                                            3.23        3

TK Maxx                                                              2.98        4

Primark                                                              2.95        3

H&M                                                                  2.60        4

                                                                                        LEASING
Wilko                                                                2.39        5

Sports World                                                         2.57        8

JD Sports                                                            2.00        7

New Look                                                             1.96        6

TOTAL                                                               27.35       63
                                      over 400 different tenants

18      capreg.com
REMERCHANDISING PROGRESS
Disciplined leasing and occupier repositioning tailored to community demands

     Change of use over 30 months to 30 Jun 2019

     Department Stores
                                                                  Key changes over half year
                                                                     Express Food      Fashion
                                                                                                  2
                Fashion                                              Leisure
          Casual Dining
          Express Food                                               Non-retail
                 Leisure
          Supermarkets
       Health & Beauty
 Services - Professional

                                                                                                 LEASING
    Services - Personal
          Home & Gifts
         Variety Stores
              Non Retail
                           -1.0   -0.5      0.0       0.5   1.0

                                     Headline Rent (£m)

19     capreg.com
REMERCHANDISING PROGRESS
Continued progress to diversify income and align to community needs
              Scheme: Luton
              Action: Letting of 13,000 sqft final
              office floor to the local authority on 15
                                                          Scheme: Hemel Hempstead
                                                          Action: Converting vacant 1st floor to 14,000
                                                          sqft destination leading gym offer with Pure
                                                                                                             2
              year lease                                  Gym
              Asset /Community Impacts:                   Asset /Community Impacts:
               Increased income diversity and use         New and diversified use and income stream
               Brings worker footfall directly to         Enhances town centre leisure provisions –
                 centre                                     footfall driver
               Significant income quantum                 Highly accretive remerchandising of off-pitch
                                                            location

                                                                                                            LEASING
              Scheme: Luton                                  Scheme: Hemel Hempstead
              Action: Delivered 8 year lease                 Action: Creation of a new shopper
              renewal and full refit for Tesco               crèche, opening October 2019
              Asset /Community Impacts:                      Asset /Community Impacts:
               Enhances food store offer – a key             Enhances family offer for our key
                community asset                                 community group
               Secures long-term material income             Encourages dwell time and footfall.
                stream from quality covenant

20   capreg.com
CAPITAL CREATION – WALTHAMSTOW RESIDENTIAL
Advanced progress in delivery partner selection for landmark development

  Comprehensive
   marketing programme
                                                                                3
   conducted over H1
   2019

                                                                           DEVELOPMENT & INVESTMENT
  Strong interest BTS
   and BTR specialists
  Offers materially
   ahead of book value
  Partner appointment
   before year end
  Expect receipt by mid-
   2020, subject to
   planning

21   capreg.com
CAPITAL RECYCLING – WOOD GREEN
Town centre locations generating material value beyond core offer

                                                                         3
  0.4 acre vacant
   former petrol station
   site

                                                                    DEVELOPMENT & INVESTMENT
  Contracts
   conditionally
   exchanged with Aitch
   Group at £5 million

  Completion and
   proceeds anticipated
   during Q4 2019

22   capreg.com
CAPEX PIPELINE – DELIVERING OUR STRATEGY
Wide-ranging accretive opportunities tailored to community masterplan delivery
                            Key Committed Projects (£m)

  £5.9 million capex
   deployed over H1
                                Asset

                            Maidstone
                                                      Projects

                                          MSU Remerchandising
                                                                            Remaining
                                                                              Costs
                                                                                      H2 2019

                                                                                     1.6      1.6
                                                                                                    2020

                                                                                                           -
                                                                                                                    3
   2019                     Hemel         Cinema & F&B                              15.1      1.6       13.5
                            Hemel         Gym                                        1.0      1.0          -
  Significant accretive                                                            17.7      4.2       13.5

                                                                                                               DEVELOPMENT & INVESTMENT
   pipeline opportunities   Pipeline Opportunities – 2020-2022 (£m)
                                                                                           Projected
  Key focus on family,         Asset                         Projects
                                                                                             Costs
   food and leisure         Ilford        MSU for Healthcare Trust                                5.1
                            Ilford        Leisure / F&B / Crossrail Mall / Residential           18.9
  Low average rents        Luton         Office Refurbishment                                    1.2
   supporting               Maidstone     Grab & Go & Guest Amenities                             4.5
                            Maidstone     Family & Ambience                                       0.9
   remerchandising          Walthamstow   Food Court                                              2.0
                            Wood Green    Family Zone & Ambience                                  3.4
  Target yield on cost     Wood Green    Food Court & Dining                                     1.5
   of c.8%                  Wood Green    Hotel Expansion                                         9.2
                            General       Strategic Asset Plans                                   0.5
                                                                                                 47.2

23   capreg.com
EXECUTIVE SUMMARY

  H1 2019 – resilient operational performance

  Strategy delivering strong relative results

  Market backdrop – structural challenges continue

  Continued focus on balance sheet

  Announcement of possible partial offer in cash and subscription for
   new shares

24   capreg.com
APPENDIX

25   capreg.com
ADJUSTED PROFIT TO IFRS PROFIT

                                                  Six months to   Six months to
 Amounts in £m
                                                   30 June 2019   30 June 2018

                                                           £m              £m

 Adjusted Profit                                          14.8            15.5

 Property revaluation (including Deferred Tax)1          (64.3)          (12.4)

 Loss on disposals                                        (0.2)               -

 (Loss)/Gain on financial instruments                     (4.9)            3.1

 Other items                                              (0.8)            0.5

 (Loss)/Profit for the period                            (55.4)            6.7

1 Includes   Kingfisher, Redditch

26       capreg.com
H1 2019 EPRA NAV BRIDGE

                    £14.8m      -£4.4m         -£64.3m        -£0.6m
                    +2.0p        -0.6p           -8.8p         -0.1p
 64p
                                                                            1p = c. £7m NAV
 62p

 60p

 58p         59.1p opening

 56p

 54p

 52p
                                                            51.6p closing
 50p
                H1 2019        Dividend       Revaluation      Other
                Adjusted     paid in period
                 Profit

27     capreg.com
C&R ASSET INFORMATION
As at 30 June 2019
Number of properties                             7
Properties at valuation                   £797.3m
Initial yield                                 6.3%
Equivalent yield                              6.7%
Reversion                                    10.2%

Weighted average lease length to break    5.0 years
Weighted average lease length to expiry   7.2 years

Contracted rent                            £61.1m
Passing rent                               £59.8m
ERV                                        £65.9m
Occupancy                                    96.8%

28    capreg.com
C&R ASSETS

                                                                                                          Number of   Annual       Car
                                                                                                Size       lettable   footfall    park
 Property               Description                           Principal occupiers             (sq feet)      units      (m)      spaces
 The Mall, Blackburn    Leasehold partially covered           Primark, Debenhams, H&M,        600,000        120       12.2      1,304
                        shopping centre on three floors       Next, Wilko, Pure Gym

 The Marlowes, Hemel    Freehold covered scheme on one        Wilko, New Look, Sports         350,000        110        6.2      1,200
 Hempstead              principal trading level               Direct, River Island

 The Exchange, Ilford   Predominantly freehold scheme         Debenhams, Next, H&M, TK        300,000        79        10.7      1,060
                        over three trading levels             Maxx, M&S

 The Mall,              Leasehold covered shopping            Debenhams, Primark, H&M,        900,000        165       19.3      1,706
 Luton                  centre on two floors with over        TK Maxx, Wilko, Luton BC
                        65,000 sq ft of offices               (offices)

 The Mall, Maidstone    Freehold covered shopping centre      TJ Hughes, Boots, New Look,     500,000        110        8.6      1,050
                        on three floors with over 40,000 sq   Wilko, Next, Iceland,
                        ft of offices                         Maidstone BC (offices)

 The Mall,              Leasehold covered shopping            TK Maxx, Sports Direct, Lidl,   260,000        67        11.6       850
 Walthamstow            centre on two floors                  Asda, Boots, The Gym

 The Mall,              Freehold, partially open shopping     Primark, Wilko, H&M, Boots,     540,000        111       10.2      1,500
 Wood Green             centre, on two floors                 TK Maxx, Travelodge

29     capreg.com
COMMUNITY STRATEGY UNDERPINNED BY MASTERPLANS
A cohesive approach to remerchandising and unlocking mixed use opportunities

30   capreg.com
31   capreg.com
Forward Looking Statement
This document contains certain statements that are neither reported financial results nor other historical information.
These statements are forward-looking in nature and are subject to risks and uncertainties.
Actual future results may differ materially from those expressed in or implied by these statements. Many of these risks and uncertainties relate to factors that are beyond the Group’s ability to
control or estimate precisely, such as future market conditions, currency fluctuations, the behaviour of other market participants, the actions of government regulators and other risk factors such
as the Group’s ability to continue to obtain financing to meet its liquidity needs, changes in the political, social and regulatory framework in which the Group operates or in economic or
technological trends or conditions, including inflation and consumer confidence, on a global, regional or national basis.
Readers are cautioned not to place undue reliance on these forward-looking statements, which apply only as of the date of this document.
The Group does not undertake any obligation to publicly release any revisions to these forward-looking statements to reflect events or circumstances after the date of this document. Information
contained in this document relating to the Group should not be relied upon as a guide to future performance.
You can also read