Ricerca e innovazione a supporto delle politiche sul Cambiamento Climatico: L'Atlante ENEA - Gianmaria Sannino
←
→
Page content transcription
If your browser does not render page correctly, please read the page content below
Ricerca e innovazione a supporto
delle politiche sul
Cambiamento Climatico:
L’Atlante ENEA

Gianmaria Sannino
ENEA C.R. Casaccia (Roma)
Laboratorio di Modellistica Climatica e Impatti
Climate Change: current status

        Globally averaged concentration of carbon dioxide in the atmosphere reached the symbolic and
        significant milestone of 400 parts per million for the first time in 2015 and surged again to new records in
        2016 on the back of the very powerful El Niño event, according to the World Meteorological
        Organization's annual Greenhouse Gas Bulletin.
        CO2 levels had previously reached the 400 ppm barrier for certain months of the year and in certain
        locations but never before on a global average basis for the entire year. The longest-established
        greenhouse gas monitoring station at Mauna Loa, Hawaii, predicts that CO2 concentrations will stay
        above 400 ppm for the whole of 2016 and not dip below that level for many generations.
El Niño 2015

         Andamento parametri climatici globali

           In this side-by-side visualization, Pacific Ocean sea surface height anomalies during the 1997-98 El Niño
           (left) are compared with 2015 Pacific conditions (right). The 1997 data are from the NASA/CNES
           Topex/Poseidon mission; the current data are from the NASA/CNES/NOAA/EUMETSAT Jason-2 mission.
           Credit: NASA/JPL-Caltech.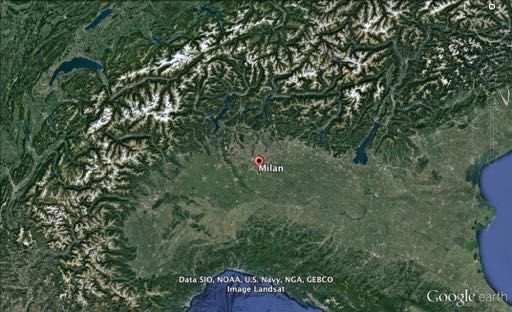
Contributi cumulativi del budget totale di anidride carbonica
                                             dal 1870. I contributi sono mostrati in parti per milione (ppm)

Source: CDIAC; NOAA-ESRL; Houghton et al
2012; Giglio et al 2013; Joos et al 2013;
Khatiwala et al 2013; Le Quéré et al 2014;
Global Carbon Budget 2014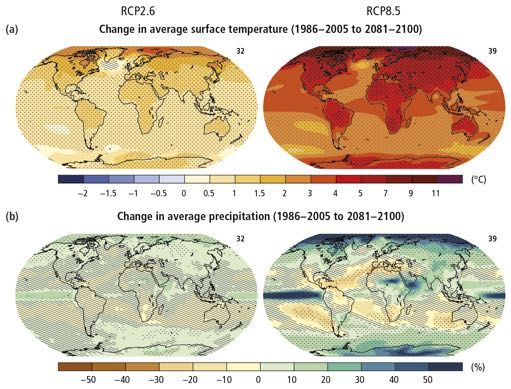
Climate Change: current status (CO2)
Climate Change: current status (CO2 CH2 NO2)

         CO2                    CH4            NO2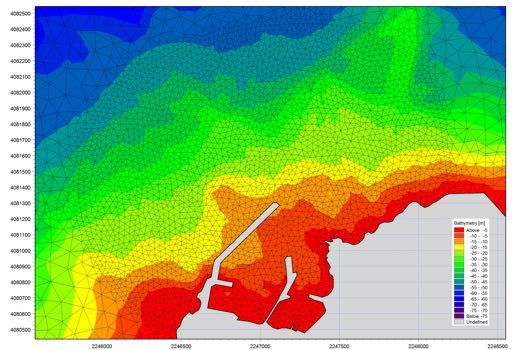
Climate Change: current status

       The Global Atmosphere Watch (GAW) global network for carbon dioxide in the last
       decade. The network for methane is similar.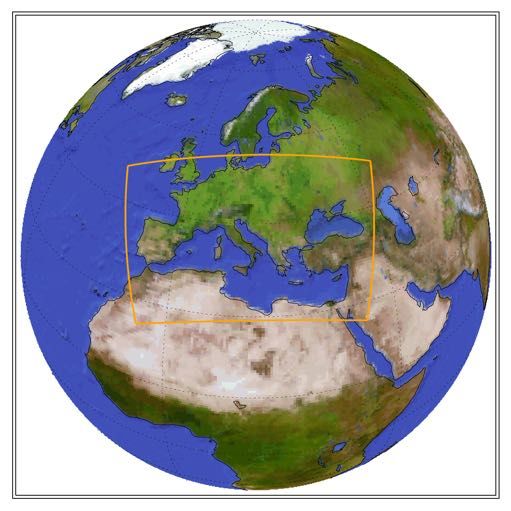
Climate Change: current status – ENEA initiatives

  The ENEA Station for Climate Observations
  (Roberto Sarao) on the island of Lampedusa is a
  research facility in the Mediterranean dedicated
  to the measurement of climatic parameters.
  Lampedusa is an excellent site for studies on the
  atmospheric composition and structure, on the
  transfer of solar and infrared radiation, and for
  oceanographic investigations.
Questo grafico, basato sul confronto di campioni di bolle di aria contenute nelle carote di ghiaccio e misure più recenti
dirette, fornisce la prova che la CO2 atmosferica è aumentata a partire dalla Rivoluzione Industriale. (Credit: Vostok
carota di ghiaccio di dati / JR Petit et al .; NOAA Mauna Loa record di CO2)
Climate change – Past reconstruction
Climate change – Past reconstruction - Italian Research
Climate change – Past reconstruction - Italian Research
                                      Base Mario Zucchelli

                             Base Italo_francese Concordia
Climate Change: current status (T °C)
Climate Change: current status (Sea Ice extension Km2)
Climate Change: current status (Sea Ice mass variation)

Data from NASA's GRACE satellites show that the land ice sheets in both Antarctica and Greenland are
losing mass. The continent of Antarctica has been losing about 134 gigatonnes of ice per year since
2002, while the Greenland ice sheet has been losing an estimated 287 gigatonnes per year.
(Source: GRACE satellite data)
Climate Change: current status (Sea level)

   Sea level rise is caused primarily by two factors related to global warming: the added water
   from melting land ice and the expansion of sea water as it warms. The first chart tracks the
   change in sea level since 1993 as observed by satellites.
Climate Change: current status

     January-September 2016 was the hottest such period on record, at 0.89°C
     above the 20th century average of 14.1°C, according to a new report from
     the U.S. National Oceanic and Atmospheric Administration.
Climate Change: current status in Europe
Anomalie di temperature
estive superficiali in Europa
nell’estate del 2015 rispetto
al periodo di riferimento
1961-1990. Fonte: WMO-
DWD
[°C]Climate Change: current status Artic
Artico: è ancora record. Ottobre mai così caldoClimate Change: current effects
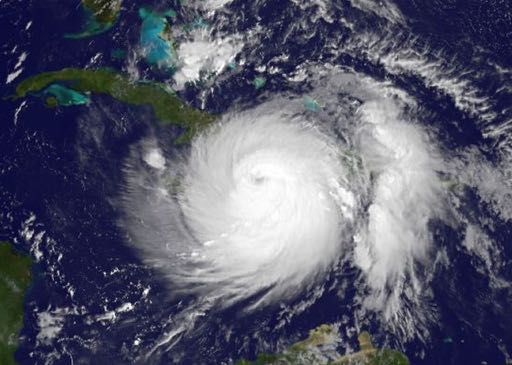
Hurricane Matthew
Matthew showed a very rapid rate of escalation to Category 5 status, and a long
persistence at very strong hurricane strength, that is noteworthy. Explosive
intensification and long life at intense strength are certainly the kinds of attributes
we’d expect to see more often as a warming climate heats the oceans and
provides more fuel for the most intense hurricanes.Climate Change: already running
Climate Change: already running

     Figura - Anomalie di temperatura superficiale media globale per il periodo 1950-
     2015 calcolate rispetto al periodo di riferimento 1961-1990. Per il 2015 sono
     considerati i mesi da gennaio a ottobre. I colori delle barre indicano la presenza o
     meno (colore grigio) di periodi caratterizzati dal fenomeno di El Niño (rosso) o de
     La Niña (blu). Fonte WMO
Climate Change: already running in Italy Serie delle anomalie di temperatura media globale sulla terraferma e in Italia, rispetto ai valori climatologici 1961-1990 (elaborazione ENEA) Anche in Italia, il 2014 ha fatto segnare livelli record della temperatura media, risultando il più caldo dell’intera serie dal 1961, superando anche i record precedenti registrati nel 1994 e nel 2003. L’anomalia di +1,57 °C rispetto alla climatologia calcolata sul periodo 1961-1990, della temperatura media in Italia, colloca il 2014 al 1° posto nell’intera serie dal 1961 al 2014 e rappresenta il 23° valore annuale positivo consecutivo.
IPCC Assessment Report 5 (AR5) - 2014

  IPCC reports are the result of extensive work from scientists around the world.

  The IPCC’s reports are considered the most authoritative scientific assessments on
  climate change in the world and are produced through the involvement of thousands
  of scientists worldwide.

   AR5 provides a clear and up to date view of the current state of scientific
   knowledge relevant to climate change. It consists of three Working Group (WG)
   reports and a Synthesis Report (SYR). Further information at www.ipcc.ch
IPCC Assessment Report 5 - Projected Climate Change

                               Future Climate Changes, Risks and Impacts

                                Representative Concentration Pathways (RCPs)
                                are four greenhouse gas concentration (not
                                emissions) trajectories adopted by the IPCC for its
                                fifth Assessment Report (AR5) in 2014

                                ¨   Set of four new scenarios defined by the scientific
                                    community for the Fifth IPCC Assessment Report.
                                ¨   Four RCPs include:
                                    ¨   one mitigation scenario leading to a very low
                                        forcing level (RCP2.6),
                                    ¨   two stabilization scenarios (RCP4.5 and RCP6),
                                        and
                                    ¨   one scenario with very high greenhouse gas
                                        emissions (RCP8.5).
                                ¨   RCPs represent a range of 21st century climate
                                    policies.
IPCC Assessment Report 5 - Projected Climate Change
Future Climate Changes, Risks and Impacts
Representative Concentration Pathways (RCPs)
are four greenhouse gas concentration (not
emissions) trajectories adopted by the IPCC for its
fifth Assessment Report (AR5) in 2014
(A) Atmospheric CO2 scenario. (B) projected global
mean surface temperature change as simulated by Earth
System Models of Intermediate Complexity (EMICs) for the
4 RCPs up to 2300 (relative to 1986–2005) followed by a
constant (year 2300 level) radiative forcing. (C) Sea-level
change projections. The bars in (C) show the maximum
possible spread that can be obtained with the few
available model results (and should not be interpreted as
uncertainty ranges). These models Likely underestimate
the Antarctica ice sheet contribution, resulting in an
underestimation of projected sea-level rise beyond 2100.IPCC Assessment Report 5 - Projected Climate Change: surface
temperatude
Future Climate Changes, Risks and Impacts
Representative Concentration Pathways (RCPs)
are four greenhouse gas concentration (not
emissions) trajectories adopted by the IPCC for its
fifth Assessment Report (AR5) in 2014
Projected Change in Average Surface TemperatureIPCC Assessment Report 5 - Projected Climate Change: precipitation
Future Climate Changes, Risks and Impacts
Representative Concentration Pathways (RCPs)
are four greenhouse gas concentration (not
emissions) trajectories adopted by the IPCC for its
fifth Assessment Report (AR5) in 2014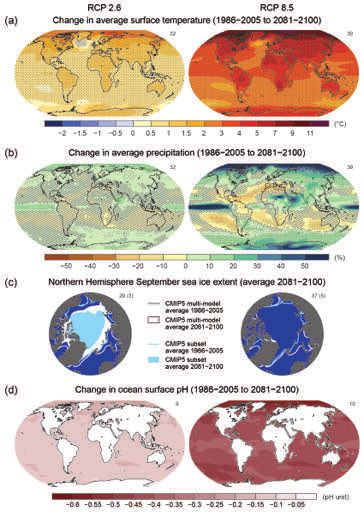
Projected Change in Artic sea ice extentIPCC Assessment Report 5 - Projected Climate Change: precipitation
Future Climate Changes, Risks and Impacts
Representative Concentration Pathways (RCPs)
are four greenhouse gas concentration (not
emissions) trajectories adopted by the IPCC for its
fifth Assessment Report (AR5) in 2014
Source: CDIAC; Le Quéré et al 2014; Global Carbon Budget 2014How do scientists make projections about future climate change and climate impacts?
Tools to Predict and Project Changes in the Climate

         Climate Prediction
         •A climate prediction or climate “forecast” is an attempt to produce an estimate
          of the actual evolution of the climate in the future.

         Emissions Scenario
         •Emissions scenarios describe future releases to the atmosphere of greenhouse
          gases, aerosols, and other pollutants and, along with information on land use and
          land cover, provide inputs to climate models.

         Climate Model
         •A numerical representation of the climate system based on the physical,
          chemical and biological properties of its components, their interactions and
          feedback processes, and accounting for some of its known properties.

         Climate Projection
         •A climate projection is the simulated response of the climate system to a scenario
          of future emission or concentration of greenhouse gases and aerosols, generally
          derived using climate models.
Tools to Predict and Project Changes in the Climate: numerical models
Un modello climatico descrive l’evoluzione del clima tramite un sistema di
equazioni matematiche non risolvibili analiticamente
Conservazione della Massa
Equazione del momento
Equazione di stato
Equazione di Avvezione e Diffusione
per Salinità e TemperaturaTools to Predict and Project Changes in the Climate
Climate Model
•A numerical representation of the climate system based on the physical,
chemical and biological properties of its components, their interactions and
feedback processes, and accounting for some of its known properties.
Source: ETH
Comprehensive three-dimensional coupled models resolving the atmosphere, ocean, land and sea ice
can be used to make projections on smaller scales and for quantities other than temperature.
A climate model is based on a system of differential equations describing physics, fluid motions and
chemistry. In order to solve the equations, the planet is divided into a 3-dimensional grid on which the
equations are discretized. The time dependent solution is then calculated numerically with the aid of a
computer code.Med-CORDEX CORDEX is a WCRP Project: The Coordinated Regional Climate Downscaling Experiment (CORDEX) Med-CORDEX is one of the 14 regional CORDEX domain. It has been proposed by the Mediterranean climate research community as a follow-up of previous and existing initiatives.
Med-CORDEX
                            Med-CORDEX is a coordinated contribution to CORDEX that is supported
                            by HyMeX and MedCLIVAR international programs.

 Med-CORDEX initiative has been proposed by the Mediterranean climate research community as a
 follow-up of previous and existing initiatives. MED-CORDEX takes advantage of new fully coupled
 Regional Climate System Models (RCSMs).

 Med-CORDEX takes advantage of new very high-resolution Regional Climate Models (RCM, up to 10
 km) and of new fully coupled Regional Climate System Models (RCSMs), coupling the various
 components of the regional climate.
Med-CORDEX database The simulations used in this work are ocean-only regional evaluation runs downloaded from the Med-CORDEX database www.medcordex.eu.
Climate models @ ENEA
Climate models @ ENEA

                        c            d

                            Fig. 2
Climate models @ ENEA
!
!
!Climate services: delivering climate information
Fine-scale ecological and economic assessment of climate change on olive in the Mediterranean
Basin reveals winners and losers
Change in profit (€ha−1) under the A1B +1.8°C
climate warming scenario.
Ponti et al. PNAS, 2014Heat waves pictures – We all ‘feel’ the heat waves
Heat waves and health
safety
 Heat Wave Safety (Nasa/Noaa)
 Heat waves may be less exciting or dramatic than other natural disasters like
 tornados, hurricanes, flooding, or even thunderstorms, but heat waves kill more
 people in the United States than all other weather-related disasters combined.
Heat waves and health
safety
 Heat Wave Safety (Nasa/Noaa)
 Heat waves may be less exciting or dramatic than other natural disasters like
 tornados, hurricanes, flooding, or even thunderstorms, but heat waves kill more
 people in the United States than all other weather-related disasters combined.

 Europe had a great shock in 2003.
 2003 was remembered as the hottest
  summer ever on the old continent.
 Many people were not prepared for
  this heat. There were a serious
 health crises and droughts in many
 European countries with a death
 toll reaching almost 40,000.
 Just in France almost 14,802 deaths
  happened because of this heat wave
 according to the French National
 Institute of Health. Extensive forest fires occurred in Portugal with almost five per
 cent of the countryside and ten per cent of the forests being destroyed due to
 temperatures reaching 48 degrees Celsius.
Heat waves and health
safety
 Heat Wave Safety (Nasa/Noaa)
 Heat waves may be less exciting or dramatic than other natural disasters like
 tornados, hurricanes, flooding, or even thunderstorms, but heat waves kill more
 people in the United States than all other weather-related disasters combined.

 2003 HEAT WAVES AND MORTALITY IN
 ITALY, Epidemiology. Bisanti et al. 2004

 In one city located in the central part
 of Italy – excess mortality was
 observed throughout the summer,
 while in the northern cities excess
 was concentrated in the first part of
 August. During the whole period a
 total of 933 excess deaths have been
 observed in the first city (20%), 598
 in the second one (23%), 502 in the
 last city (30%).
Past Heat waves on major cities in Italy: Roma and Milano
Past Heat waves on major cities in Italy: Roma and Milano

       Roma                                         Definition: Heat waves is
                                                    defined as ≥ 2 consecutive
                                                    days with daily mean
                                                    temperature above the
                                                    95th percentile of the
                                                    seasonal mean value
                                                    (present climate).

        Milano

                                                       E-OBS dataset
     1979                                    2010
Past Heat waves on major cities in Italy: Roma and Milano
Roma Definition: Heat waves is
defined as ≥ 2 consecutive
days with daily mean
temperature above the
95th percentile of the
seasonal mean value
(present climate).
Milano
Era-Interim dataset
1979 2010Future temperature on major cities in Italy: Roma
Roma-scenario RCP45: Surface Temp. 2021-2050 vs 1971-2000
Representative Concentration Pathways (RCPs) are
four greenhouse gas concentration (not emissions)
trajectories adopted by the IPCC for its fifth
Assessment Report (AR5) in 2014
Surface temperature anomaly as projected
Roma-scenario RCP85: Surface Temp. 2021-1050 vs 1971-2000 by Med-CORDEX models for the period 2021-
2050. Reference period 1971-2000Future temperature on major cities in Italy: Milano
Milano-scenario RCP45: Surface Temp. 2021-1050 vs 1971-2000
Representative Concentration Pathways (RCPs) are
four greenhouse gas concentration (not emissions)
trajectories adopted by the IPCC for its fifth
Assessment Report (AR5) in 2014
Surface temperature anomaly as projected
Milano-scenario RCP85: Surface Temp. 2021-1050 vs 1971-2000 by Med-CORDEX models for the period 2021-
2050. Reference period 1971-2000Future heat waves on major cities in Italy: Roma
Roma-scenario rcp45: occorrenza eventi calore intenso
2021-2050 vs 1971-2000
Cambiamenti nella frequenza di eventi intesi
Giorni/stagione clima presente 1971-
(giorn/stagione)
2000
change in the number of heatwaves events
for the period 2021-2050. Reference period
Roma-scenario rcp85: occorrenza eventi calore intenso 1971-2000
2021-2050 vs 1971-2000
Giorni/stagione clima presente 1971-
2000Future heat waves on major cities in Italy: Milano
Milano-scenario rcp45: occorrenza eventi calore intenso
2021-2050 vs 1971-2000
Cambiamenti nella frequenza di eventi intesi
Giorni/stagione clima presente 1971-
(giorn/stagione)
2000
change in the number of heatwaves events
for the period 2021-2050. Reference period
Milano-scenario rcp85: occorrenza eventi calore intenso
1971-2000
2021-2050 vs 1971-2000
Giorni/stagione clima presente 1971-
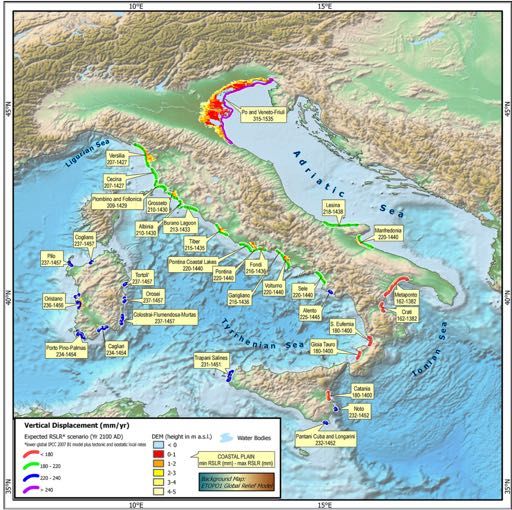
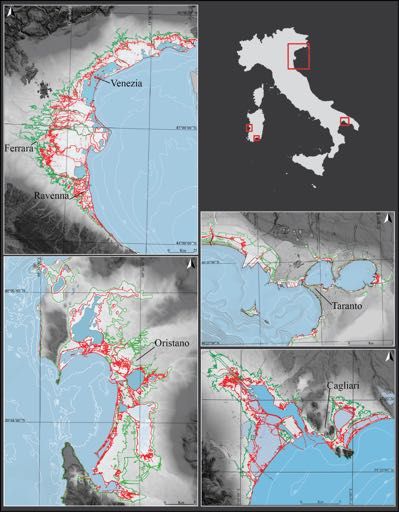
2000Climate change in Italy: Sea level rise
Lambeck et al., 2010 Antonioli et al., 2015Climate change in Italy: Land Productivity
Areas of statistically significant LP trends according to MK test threshold
p-values (pClimate change and Renewable energy We need to find the best place for new plants We need to manage existing plants (efficiently) We need to predict power output (tomorrow, in ten days, in five years)
Wave energy assessment for the Mediterranean
Yearly mean climatological energy flux

         Distribution of average power per unit crest in the Mediterranean between 2001 and 2010.

                                          ⇢g 2
                                       J=      Te Hs2                                               (1)
                                          64⇡
Wave energy assessment along the Italian coasts Distribution of average wave power flux along Sicily and west Sardinia Distribution of average wave power flux per unit crest on western Sardinia and Sicilian coastline. Values are calculated on a line located 12 km off the coast.
Wave energy assessment along the Italian coasts
Distribution of yearly average wave energy along west Sardinia

 Distribution of wave energy as a function of significant wave period and significant wave height at specific points. Lower left
 panel shows the average yearly energy associated with sea states identified by Te and Hs couples. Dotted lines mark reference
 power levels. Upper panel shows the energy distribution as a function of Te only; right panel as a function of Hs only. Red lines in
 the upper and right panels are the cumulative energy as a percentage of the total. Red dots on the cumulative lines mark each
 10th percentile. Rose plot in the upper right panel shows energy distribution over wave incoming direction. Each circle
 represents 20% fractions of the total energy.
High resolution numerical modeling approach
Numerical Wave model description
!
MIKE21
SW
WAM
(1/16°x1/16°)
WAM/SWAN
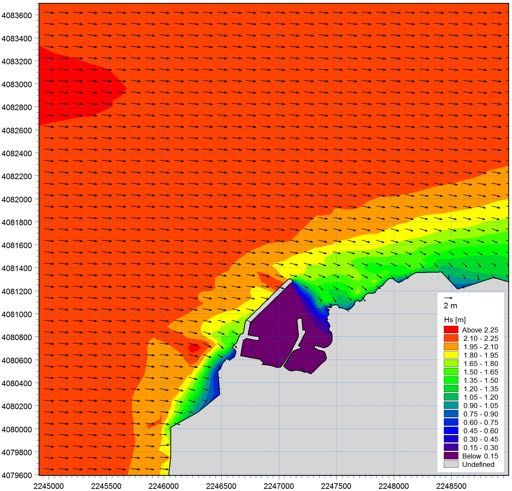
(1/120°x/120°)Wave energy assessment for Pantelleria island
Distribution of yearly average (2001-2010) wave energy around PANTELLERIA
SWAN model laterally forced by the WAM simulat
!
7 Km res. 800 m res.Wave energy assessment for Pantelleria island
Distribution of yearly average (2001-2010) wave energy around PANTELLERIA
Computational Mesh used for
Pantelleria.
!
!
!
10 km
7 Km res. 800 m res.Devices developed @ ENEA in collaboration with University PEWEC (Pendulum Wave Energy Converter)
Devices developed @ ENEA in collaboration with University
You can also read