A ROADMAP TO SPARE PARTS OPTIMIZATION - Featured Article - ASSET INTEGRITY INTELLIGENCE - Pinnacle ...
←
→
Page content transcription
If your browser does not render page correctly, please read the page content below

ASSET INTEGRITY INTELLIGENCE

Fe atured Article

A ROADMAP TO SPARE PARTS OPTIMIZATION
BRAD MOORE, Senior Project Manager at Pinnacle Advanced Reliability Technologies

VOLUME 21, ISSUE 5
SEPTEMBER | OCTOBER 2015
A ROADMAP TO SPARE PARTS OPTIMIZATION
BY: BRAD MOORE, Senior Project Manager at Pinnacle Advanced Reliability Technologies

INTRODUCTION                                                           During a recent project, a facility faced several challenges, includ-
Operators in all industries are trying to increase equipment avail-    ing the duplication of spare parts that were recommended for var-
ability – the probability that an asset (or system) will be opera-     ious equipment units, the inability to locate spare parts for new
tional (either running or able to be run) at any given time. Yet       equipment in the existing inventory, and the inability to confirm
oftentimes, critical process equipment is not available due to         whether multiple inventories of a similar part were actually the
planned or unplanned maintenance. To increase equipment avail-         same part. These inefficiencies led to unnecessary delays and in
ability, steps must be taken to reduce downtime.                       the end, lost profits.
One way to reduce downtime in a refining or petrochemical facil-       FOUR-STEP DEVELOPMENT
ity is to ensure that spare parts are organized and available in the   To reach their spare parts optimization goals and eliminate exist-
event repairs are needed. The activities included in spare parts       ing inefficiencies, a considerable amount of spare parts develop-
optimization include the following:                                    ment work was required. The development work included four
                                                                       steps.
    • Identifying the potential challenges or roadblocks,
                                                                   First, a process was developed to comprehensively identify all of
  • Spare parts identification and association with the appropri-
                                                                   the spare parts needed for each new piece of equipment included
     ate equipment,
                                                                   in the capital project. Second, an audit of the existing inventory
  • Determining the appropriate stocking decision methods system was performed to determine if the part was already in
     (quantitative or qualitative), and                            stock, and if not, a process was developed to incorporate the new
                                                                   parts into the existing inventory system. Third, a link between
  • Setting minimum stock quantities.
                                                                   the equipment hierarchy and the spare parts inventory was devel-
A standard calculation generally used by equipment operators oped. Finally, we re-evaluated the recommended stocking quan-
or managers throughout the process industries is Mean Time to tity for each part to ensure confidence the part would be available
Repair (MTTR). The formula for MTTR is listed below.               when needed in the future.

                      TOTAL MAINTENANCE TIME
          MTTR =                                                          STEP 1: I DENTIFY SPARE PARTS ASSOCIATED
                      NUMBER OF REPAIRS                                           TO EQUIPMENT

One of the factors that can affect MTTR is the availability of spare
                                                                          STEP 2: INCORPORATE PARTS INTO INVENTORY
parts needed to complete a maintenance activity. A top priority
for facility management is keeping costs low while maintaining
optimal uptime. However, accomplishing this goal can be chal-
                                                                          STEP 3: LINK PARTS TO EQUIPMENT HIERARCHY
lenging when equipment breaks down unexpectedly. Even the
replacement of a minor part on a piece of equipment can turn
into a major incident if the appropriate spare part is not readily
                                                                          STEP 4: DETERMINE STOCKING QUANTITY
available.
The intent of this article is to discuss various methods used to
                                                                       Figure 1. Spare part optimization process.
identify spare parts and recommend stocking quantities to help
minimize the MTTR, while maintaining a focus on cost optimiza-
                                                                       SPARE PARTS IDENTIFICATION
tion of the inventory. We will consider the issue of incorporating
                                                                  For new capital projects, the spare parts needed for new equip-
spare parts for a new capital project into an existing inventory
                                                                  ment are typically identified in the Equipment Installation,
system. This scenario could be the installation of a new unit at
                                                                  Operation, and Maintenance (IOM) manuals or in Illustrated
a refinery or a new offshore production platform that shares a
                                                                  Parts Lists (IPL) supplied by the equipment vendors. In most
warehouse with several other platforms.
                                                                  cases, the formats of the documentation in which the spare parts
PROJECT CHALLENGES                                                are presented are inconsistent from one vendor to the next. The
Incorporating these new parts can uncover issues with current first step in the spare parts optimization process was to gather
spare parts organization and management. It can also reveal inef- all spare parts information into a common format so that the
ficient processes leading to inaccessible and poorly identified data could be manipulated as necessary during the development
spare parts inventory.                                            process. This was accomplished using a spreadsheet with the

2    Inspectioneering Journal   SEPTEMBER | OCTOBER 2015
following fields: • Must the facility be shut down to allow for repairs to this
equipment?
• Item description
• Manufacturer part number • Would the duration of equipment unavailability, comparable
• Vendor part number to the lead time of the part acquisition, be intolerable?
• Manufacturer/vendor recommended stocking quantity
• Finally, should the part be stocked for convenience due to
• Unit of measure
high demand?
• Number of parts needed per repair
• Equipment that can use this part If the answer to any of these questions is “yes,” then a facility
• Item cost manager may be justified in keeping a part in stock.
• Item lead time
Sometimes it will not be justified to keep certain parts in stock
• Shelf life or preservation issues
using either the quantitative or qualitative evaluation methods.
Once the parts were identified, an initial stocking decision was In many cases, these are parts with short lead times (e.g., one day
required. The stocking decision was based on certain risk factors, for belts) or they are used by equipment that does not require
and included asking: “Does this part even need to be stocked at a rapid repair due to the lack of significant consequences for
all?” This initial “stock/no stock” decision can be made using one the duration of the part lead time (e.g., pumps with an installed
of two primary methods — quantitative or qualitative. spare). Other parts might not be stocked due to the remote likeli-
hood of component failure (e.g., pump case, electrical enclosure)
QUANTITATIVE VERSUS QUALITATIVE METHODS
or because an effective predictive maintenance program could
The quantitative method drives the decision based primarily on
detect incipient failures with enough time to procure the parts
financial impact. Alternatively, the qualitative method drives the
before equipment functional failure occurs. These non-stocked
decision based on safety, health and environmental consider-
parts essentially have a stocking quantity of zero. The manager
ations, as well as convenience.
must decide if these non-stocked parts will still be managed in
The quantitative method compares the cost of keeping a part in the inventory system, making them easy to locate when the parts
stock against the financial impact that occurs if the part is not actually need to be ordered.
available when needed. Essentially, if the annualized cost of stock-
The input required to complete quantitative and qualitative
ing the part is less than the annualized cost of not stocking the
analyses is typically gathered by performing a failure modes-
part, then the part should be kept in inventory.
and-effects and criticality analysis (FMECA) of the equipment.
Two major issues should be considered when evaluating the This analysis identifies the financial, safety, and environmental
financial impact of stocking a part. The first is the actual cost of impacts that an equipment failure might induce. The resulting
the part (net present value versus depreciation). The second is the criticality of the equipment typically relates closely to the initial
holding-cost factor, which is typically 20 to 30 percent of the cost stock/no stock decision.
of the part per year. This is because keeping a part in stock can
SPARE PART INVENTORY IDENTIFICATION
produce significant costs including available space, time (life-cy-
After the initial stock/no stock decision has been made for each
cle of the part), and inventory management. Typical costs may
part, the existing inventory system should be searched to deter-
include storage space, insurance, salaries, handling, and the loss,
mine if the part is already being held in stock. This review can
deterioration, or obsolescence of the part.
reveal a number of issues with a facility’s current inventory sys-
To calculate the cost impact if the part is not stocked, four issues tem. First, identical parts might be included in the inventory, but
should be considered. These are: the lead time to acquire the part, itemized under multiple inventory item numbers (i.e. duplication
the lost-profit opportunity (such as production losses) due to of the part in inventory). Second, item descriptions may not be
equipment downtime waiting for the part, the expediting costs, standardized making it difficult to confirm whether a part in
and the annualized demand for the part (i.e., the equipment fail- inventory matches the new part to be stocked. Third, the inven-
ure rate). Lost-profit opportunity can result from an off-specifi- tory might include obsolete parts and/or invalid or missing man-
cation product, a throughput rate reduction, or the continuation ufacturer/vendor part numbers. Finally, the system might contain
of a facility shutdown until the repairs can be completed. The incomplete information that is required to order the appropriate
duration of the lost opportunity event can be directly affected by part.
a part’s lead time before acquisition.
A comprehensive inventory system data clean-up effort might be
If the equipment that uses the part does not have a direct or quan- required to address these issues. Existing spare parts optimization
tifiable financial impact, the decision to stock a part will rely on must begin with this data-cleansing work. During this optimiza-
the qualitative method. To qualitatively determine if a part should tion, managers should identify different inventory item numbers
be stocked, the following issues should be considered: that have the same manufacturer part number and update item
description fields to keep a standard format for similar parts. Also,
• Does the equipment have an impact on facility safety, health,
managers should conduct research to validate that the correct
or environmental performance?
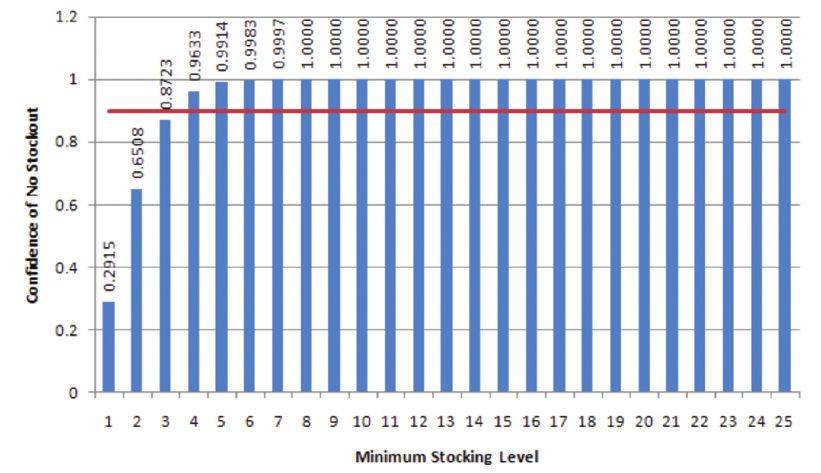
information is available to order the part. Additionally, managersFigure 2. This graphic shows the
increasing confidence that a part will
be available when needed as the min-
imum stocking quantity increases.
For this example, the confidence
level threshold is set at 90 percent
and the minimum stocking quantity
would be set at four, since this is the
number required for a confidence
level of no stock-out greater than
90 percent.
might need to perform a physical inventory audit to ensure that Finally, the manager should determine the minimum acceptable
the quantities of the parts are correct in the inventory system and probability that each part is available in stock when needed. This
to verify if different inventory item numbers are identical or are probability, or confidence level, is based on the equipment crit-
unique parts. icality and level of failure consequence. This confidence level is
equal to 100 percent minus the percentage of stock-out the facil-
Some of the new parts for the capital project will already be
ity operator will accept for a demand on this part. For example, a
included in the current inventory and will be identified during
confidence level of 98 percent indicates that up to a two percent
the review previously described. The other parts to be stocked
stock-out rate for that part is acceptable. Common confidence
that are not currently in the inventory system must be assigned a
levels are 98 percent for critical equipment and 80 percent for
new inventory item number and properly documented.
non-critical equipment.
At this point, all parts associated with the capital project should
All of these factors are used to determine the minimum stocking
have an inventory item number. A link must be created between
quantity for each part. This quantity is the number of parts that
the equipment and the inventory item numbers for the equip-
should be kept in inventory to reach the target confidence level.
ment parts. This link can reside in the inventory system or in the
When inventory falls below the minimum stocking quantity,
Computerized Maintenance Management System (CMMS). This
additional parts should be ordered to return the inventory quan-
link creates a list of parts that are used by each piece of equip-
tity to the minimum stocking quantity or higher. While awaiting
ment, which is needed to identify the correct parts needed for
delivery of the parts, there might be additional demands for the
planned or unanticipated repairs.
part. Stock-out occurs when there is demand for a part that is
MINIMUM STOCK QUANTITIES not in stock before the ordered parts have arrived and have been
For each of the cost-justified parts, a minimum stocking quantity incorporated into the inventory. The manager must set this proba-
can be calculated. Assuming a normal distribution (random fail- bility of stock-out at a threshold acceptable to the company.
ure rate) of demand for this part, the data needed to complete the
CONCLUSION
calculation includes the estimated lead time to receive parts once
In all industrial organizations, including refineries and petro-
they are identified and ordered, and the number of parts required
chemical plants, the optimization of spare parts activities, includ-
to complete the repair per demand. Typically, a single part is
ing the management of inventories, ordering processes and risk
needed to complete the repair, but there are several scenarios in
analyses, is always important. This process becomes even more
which many parts might be required for the repair (e.g., replace-
critical during periods of economic stress. Facility and plant man-
ment of all filter elements in the housing).
agers should review and optimize their current spare parts proce-
Also, managers should determine the number of equipment units dures and inventory documentation systems to ensure that plant
that can use this part (e.g., four identical pumps that use the same turnarounds or unscheduled downtimes are not extended due to
seal assembly) and the estimated MTBF (mean time between poor spare parts management. n
failures) for this equipment to calculate an overall annualized
demand rate for the part. Some parts are needed for pre-planned For more information on this subject or the author, please email
maintenance activities and managers might need to account us at inquiries@inspectioneering.com.
for this demand on the part in the minimum stocking quantity
calculation.
4 Inspectioneering Journal SEPTEMBER | OCTOBER 2015CONTRIBUTING AUTHORS
BRAD MOORE
Brad Moore is a Senior Project Manager at Pinnacle Advanced Reliability Technologies,
directing asset management implementation projects for Fortune 500 companies in the
oil & gas, petrochemical, and power industries. These projects include the development of
asset hierarchies, Reliability Centered Maintenance (RCM) studies, Proactive Maintenance
(PM) programs, including Operator Driven Reliability (ODR) activities, pre-planned repair
procedures, and spare parts optimization. Mr. Moore received his Bachelor of Mechanical
Engineering from Georgia Institute of Technology, and over his career has held positions as a
reliability engineer and project manager.
SEPTEMBER | OCTOBER 2015 Inspectioneering Journal 5The Future of
RELIABILITY
PinnacleART is your SME for comprehensive reliability
asset management and integrity services.
Engineering Services
Audits, Analyses & Assessments
Damage Mechanism Support
Fitness for Service
Integrity Operating Windows
REDUCE RISK
Program Evergreening
Risk-Based Inspection
Reliability Centered Maintenance
Software Implementation – IDMS, RBI, CMMS, EAM
Spare Parts Optimization
Inspection Services
Inspection Drawings
Inspection Planning
OPTIMIZE COST On-Stream and Visual Inspections
Positive Material Identification
QA/QC Vendor Surveillance
Tank Inspections – MFE Floor Scans
Turnaround Inspections
Training
ENSURE COMPLIANCE API 571 & 580
Program Maintenance
Software – IDMS, RBI, CMMS, EAM
Contact a Solutions Engineer - 281.598.1330
info@pinnacleart.com
Advanced Reliability Technologies
www.pinnacleart.comYou can also read