Community-made Earthquake Intensity Maps using Google's API
←
→
Page content transcription
If your browser does not render page correctly, please read the page content below
Originally published as

Haubrock, S.; Wittkopf, T.; Grünthal, G.; Dransch, D. (2007): Community-made
Earthquake Intensity Maps using Google’s API, Proceedings of the 10th AGILE
International Conference on Geographic Information Science, 10th AGILE
International Conference on Geographic Information Science (Aalborg, Denmark
2007), CD, 8.

            Community-made Earthquake Intensity Maps
                      using Google’s API
  Authors: Sören Haubrock, Tobias Wittkopf, Gottfried Grünthal, Doris Dransch
          Affiliations: GeoForschungsZentrum Potsdam, Telegrafenberg, D-14473 Potsdam

INTRODUCTION
    The availability of abundant reliable data is a constraint for successful scientific research.
Research progress is often inhibited by the difficulties in collecting data in a reasonable time period
due to missing infrastructures, cost and time issues.

    With the upcoming of the Internet and especially the recently developed web services and
service-oriented architectures, a technological basis is nowadays given for collecting data more
efficiently then is currently the case in many scientific communities. In this context, the OGC
develops standards for the exchange of sensor data over well-defined XML interfaces. While this
approach seems feasible for machine-to-machine communication of sensor data, additional
approaches seem necessary for making use of data “sensed” by human. The term sensor is here not
understood solely as technical device measuring physical, chemical or biological parameters directly,
but can also be people recognizing certain effects that can be linked to spatio-temporal phenomena.
All participants of a data collection process can be seen as a community for that particular research
topic. To make use of these “human sensors”, a user-friendly interface to communicate their
estimation of a sensed phenomenon using existing technical infrastructures should be provided
instead of syntactically and semantically complex specifications.

   The aim of this paper is to establish a concept for a community-based map creation process in the
context of earthquake intensity estimation. The approach relies on established technologies and APIs,
where Google Maps play a major role.

Community-made maps
    The overall idea of integrating distributed users of a research community into data collection
processes is to extend the data basis significantly and to save time and costs collecting these data sets
by using nearly real-time collection methods. For spatio-temporal applications, the result of such a
survey can be a map depicting the estimations of the community, a so-called community-made map.
In this case, the spatial characteristic of a data set needs to be registered by providing address data,
postal codes or coordinates.

    In contrast to automatic sensor-based approaches, where sensor devices send data automatically,
the role of the human users is significant in the architecture of community-based map generation.
User interfaces should be easily understandable while being unambiguous in terms of the semantics
for parameters that need to be gathered.
Earthquake Intensity estimation
The use case realized in the context of this project is to create a community-based earthquake
intensity map for Germany. The vast majority of the seismic epicentres in Germany are concentrated
in three weak zones of the Earth's crust: (1) the Rhine area (2) the Swabian Jura and (3) Eastern
Thuringia as well as Western Saxony with its swarm quake area ("Vogtländisches
Schwarmbebengebiet") (Grünthal, 2003). Since earthquakes unambiguously sensed by humans or
even destructive earthquakes are very rare natural phenomena in the country, the established
architecture is intended to be generic so it can be used in other spatial contexts beyond the specified
use case as well.
Workings on the systematic collection of ground motion effects triggered by earthquakes began in
the 19th century. The degree of ground motion and its effects were classified in terms of intensity
grades. The intensity scales developed for this purpose were improved and designed over the years to
minimize effects caused by subjective errors.
In the context of earthquake intensity estimation, some approaches already exist for integrating
human-sensed data into the research process of seismic events. The probably best-known system “Did
you feel it?” has been developed by the U.S. Geological Survey (USGS, 2007). It relies on the web-
based collection of intensity estimation data by the community and results in a contribution to a
digital map integrated on a web page after collecting the record of each single user. The static map
contains ZIP areas representing a single intensity value that is deduced from multiple intensity
estimations by the community.
In other projects, community data has been integrated as well, although in a rather event-specific
context. Such a project is the Dumfries Earthquake Survey (BGS, 2007), where a macroseismic
survey was launched on the BGS ‘Earthquakes’ web site with a total of 301 responses.
INFORMATION ARCHITECTURE
This project aims at establishing a more generic architecture for the integration of community-
based earthquake intensity estimation data into the process of generating digital, interactive maps and
reports for research and publication on the Internet. It is based on multiple technological components
that are combined in a process chain in order to automatically generate maps from user input.
Earthquake Report Form
The estimation of earthquake intensity applied here is operationalized using the standardized
EMS-98 scale (Grünthal, 1998). The macroseismic intensity I represents a classification of the
magnitude of ground motion based on observed phenomena in a defined area, e.g. a town. Effects of
ground motion on people, objects in houses as well as damages to buildings form the basis for the
appraisal. Intensities are a robust measure of magnitude classification: I not felt, II scarcely felt, III
weak, IV largely observed, V strong, VI slighty damaging, VII damaging, VIII heavily damaging, IX
destructive, X very destructive, XI devastating, XII completely devastating.
Instead of querying the users directly for their intensity estimation, these values are deduced from
recognized natural phenomena in a standardized way. As an example, by paraphrasing the different
intensity classes with textual descriptions (e.g. “hanging objects swing heavily, small objects maybe
shifted. Doors and windows swing open and close.“), it is possible for users to integrate their local
event-specific knowledge into the overall system without knowing the actual semantics of an intensity
class. Instead, the descriptions collected in a web-based form are later on mapped to the
corresponding class. Following this approach, non-experts are able to take part in a survey, such that
the number of participants is large enough to gain significant results from the data.The form used here contains among questions concerning the mentioned textual descriptions also
variables for spatially referencing the event. The user is given the opportunity to either enter a postal
code, an address, or a set of geographical coordinates. The latter two parameters are later on matched
to an appropriate postal code for visualization in the map, but are additionally being kept for more
specific localization of an event in other contexts.
Intensity Information Service
While the report form provides data entered by the user, the intensity information service
processes this data by a) mapping the given form parameters to earthquake intensities, b) forward the
spatial information to the geocoding process provided by external components, c) administrate the
processes of data storage, map creation and web page response to the user.
The variables in the earthquake report form have been chosen in such a way that their relationship
to earthquake intensity is unambiguous. In a matching process, the most appropriate earthquake
intensity class is chosen for each report submitted by combining the set of variables.
On the basis of the provided spatial information, i.e. a postal code, an address or a geographic
coordinate, the sensed earthquake intensity can be geocoded to the map resolution, which is in this
case the combination of postal code areas (for large cities) and communities (for rural areas). The
geocoding process itself is however not performed by the intensity information service itself, but
rather by an external service provided by the Google Maps API (see below). The role of the former
service is to parse the spatial variables from the submitted form and pass them to the external service.
The resulting coordinates can eventually be transformed to postal codes with an internal spatial
matching process based on the coordinate information of all German postal codes.
The remaining tasks of the intensity information service is to parse the other variables from the
form, forward the data to the report database, setup scripts to create map layers with the summary of
all earthquake intensity reports submitted so far and to return to the user with a web page containing
the eventual map.
Earthquake Reports Database
The database keeps track of all earthquake reports submitted and stores additionally for each of
them the most appropriate estimated earthquake intensity and the result of the geocoding process (at
least geographic coordinates and postal codes). Due to its spatial content, the database is able to return
all reports for a certain area, so queries to the database can be used to generate statistics on certain
regions, which is the case for the resulting intensity map. For visualization in the map, the average
intensity is calculated from all reports submitted for each area of interest.
Google Maps API
One central component in the architecture is the Google Maps API, which fulfills two roles in the
system. With its powerful and efficient mechanism to geocode addresses (that even do not necessarily
need to be complete) to coordinates, it upgrades the usability of the overall system by high
performance while keeping error rates on a low level. By simply submitting the spatial parameters as
strings to the Google Maps geocoding web service, the appropriate coordinates are returned to the
client, which is in this case the intensity information service. Since Google Maps base data is
available for most countries of the world, this approach fulfills the aim of being generic for
transmitting the concept to other regions.
The second role of the the Google Maps component is to create maps based on two layers: the
base layer provided by Google containing background information like topographic data or remote
sensing images, and the actual information layer generated by the intensity reports of the community.
The latter is generated based on spatial queries of the database and the subsequent statistical operation
of averaging the single reports to a single value.
The Google Maps API provides a means to generate customized symbols to be drawn in the map.
In the case of the earthquake intensity map, the standardized icons used in this context can therefore
be created and used for classification in the resulting map.Communication Architecture
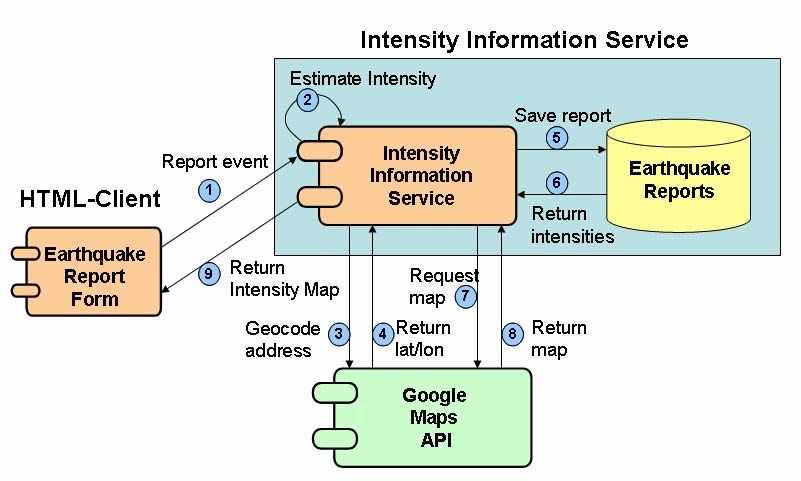
The overall communication architecture combining the four base components is sketched in figure 1.
Basically, the process chain performs the following activities.
1. The user gives an estimation of earthquake intensity by filling out and submitting the form
on a web page.
2. Intensity information system generates intensity from parameters following EMS-98
standard.
3. Address data provided in report form is sent to Google Maps API in order to geocode it into
geographic coordinates.
4. Google Maps API returns geographic coordinates.
5. The whole report (incl. Coordinates and estimated intensity) is saved in database for
archiving and further processing.
6. The set of estimated intensity values for each location is sent to the intensity information
system in form of a point list with attributes. The intensity information system generates
average intensities for each area.
7. Average intensity estimations are sent to Google Maps API together with symbol
information.
8. Google Maps API returns map with user-defined symbols showing average estimated
intensity values.
9. Map is integrated into web page and returned to client synchronously.
Figure 1: Conceptual communication architecture of the system.
Technical implementation
The whole system is based on the established technologies readily available and usable on the
Internet. The form is integrated in a simple HTML page, which is served by an Apache HTTP Server.
PHP scripts are used at the server side to manage database access, data storage and forwarding of
requests. It is further used for communicating with JavaScripts, which play the key role in using the
Google Maps API. A simple MySQL instance has been chosen as database, since coordinates for
point measurements as well as postal codes can be stored easily without any spatial extension.CONCLUSION AND OUTLOOK
The conceptual approach presented here aims at establishing a framework for integrating data
“sensed” by a community for estimating earthquake intensity in Gemany. The goals are to set up a
generic system, that can be extended to other regions of the world, but also used in different thematic
contexts that need to integrate community information. So far it has been developed as a conceptual
first prototype and is intended to be developed as an operational system in a next step.
In order optimize the participation of the community, it has been designed to be technically
simple, easy-to-use and bring up results immediately after submitting the individual contribution in
form of the report. Usability is further improved by founding the concept on the very fast interactive
web client of Google Maps.
At the same time, the scientific value of the resulting map is given due to the fact that established
methodologies like the EMS-98 are applied, standard symbols are used and statistical procedures in
the background are transparent. However, in order to enhance the quality of the results, the reports
provided by the users need to be evaluated in some way, which has to be considered when further
developing the architecture for operational usage in the community.
From a technical point of view, the whole system is relatively straightforward to establish and use
and therefore gives a good foundation for integrating community data into the scientific research. By
using established technologies, it has the potential to significantly enhance cost and time issues in the
data collection process.
BIBLIOGRAPHY
BGS. Dumfries Earthquake Survey Results, URL:
http://www.earthquakes.bgs.ac.uk/earthquakes/reports/dumfries_26122006/
dumfries_macro_results.htm, accessed 2007/01/21.
Google. Google Maps API, URL: http://www.google.com/apis/maps/documentation/, accessed
2007/01/21.
Grünthal, G. (ed.): European Macroceismic Scale 1998 (EMS-98). Cahiers du Centre Européen de
Géodynamique et de Séismologie, Volume 15, Luxembourg, 1998.
Grünthal, G., 2003. Wo in Deutschland die Erde bebt. Nationalatlas Bundesrepublik Deutschland,
Band 2: Relief, Boden und Wasser. Institut für Länderkunde, Leipzig (Hrsg.), pp 44-45,
Spektrum Akademischer Verlag, Heidelberg, Berlin.
USGS. Did You Feel It? - Community Internet Intensity Maps, URL:
http://earthquake.usgs.gov/eqcenter/dyfi.php, accessed 2007/01/21.You can also read