DATAWorks 2021: Empirical Analysis of COVID-19 in the U.S - IDA
←
→
Page content transcription
If your browser does not render page correctly, please read the page content below

INSTITUTE FOR DEFENSE ANALYSES

                                                 DATAWorks 2021:
                                      Empirical Analysis of COVID-19 in the U.S.

                                                    Emily D. Heuring

          April 2021
 Approved for Public Release.
    Distribution Unlimited.

IDA Document NS D-21549
   Log: H 2021-000032

 INSTITUTE FOR DEFENSE ANALYSES
        4850 Mark Center Drive
    Alexandria, Virginia 22311-1882
The Institute for Defense Analyses is a nonprofit corporation that operates three Federally Funded
                       Research and Development Centers. Its mission is to answer the most challenging U.S. security and
                       science policy questions with objective analysis, leveraging extraordinary scientific, technical, and
                       analytic expertise.

About This Publication
This work was conducted by the Institute for Defense Analyses (IDA) under contract HQ0034-19-D-0001, Task: BA-9-4869.0.0, “COVID-19 Empirical Tools and Analytical Support”
for the Office of the Director, Operational Test and Evaluation. The views, opinions, and findings should not be construed as representing the official position of either the Department
of Defense or the sponsoring organization.

Acknowledgments
The IDA Technical Review Committee was chaired by Mr. Robert R. Soule and consisted of Rebecca Medlin, Matthew Avery, and Bram Lillard from the Operational Evaluation Division,
and Kristina Guerrera and Zach Szlendak from the Cost Analysis and Research Division.

For more information:
Emily Heuring, Project Leader
eheuring@ida.org • 703-845-4374

Robert R. Soule, Director, Operational Evaluation Division
rsoule@ida.org • (703) 845-2482

Copyright Notice
© 2021 Institute for Defense Analyses
  4850 Mark Center Drive, Alexandria, Virginia 22311-1882 • (703) 845-2000

This material may be reproduced by or for the U.S. Government pursuant to the copyright license under the clause at DFARS 252.227-7013 [Feb. 2014].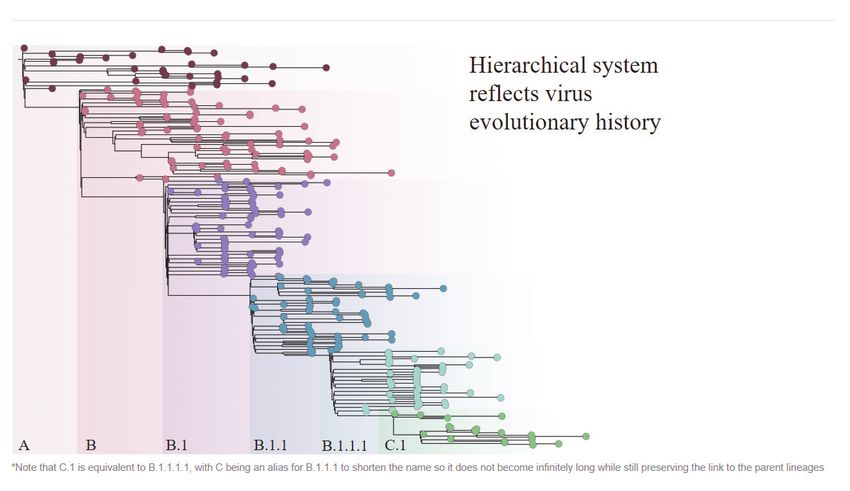
INSTITUTE FOR DEFENSE ANALYSES

            IDA Document NS D-21549

           DATAWorks 2021:
Empirical Analysis of COVID-19 in the U.S.

              Emily D. Heuring
Executive Summary

     The zoonotic emergence of the coronavirus SARS-                SARS-CoV-2 genomic analysis over the course of the
CoV-2 at the beginning of 2020 and the subsequent global            pandemic demonstrates that different lineages have
pandemic of COVID-19 has caused massive disruptions to              emerged and waned over the course of the pandemic.
economies and health care systems, particularly in the                    Overall, the emergence of SARS-CoV-2 and COVID-
United States. This briefing to be presented at                     19 has resulted in the public having unparalleled access to
DATAWorks 2021 will describe IDA’s empirical analysis               data for analyzing the pandemic. Such access has allowed
of COVID-19 data within the U.S. general population.                for widespread real-time analysis to support the
     Using the results of serology testing, we have                 deployment of resources and implementation of policy.
developed true prevalence estimates for COVID-19 case               However, along with this unparalleled access to data come
counts in the U.S. over time, which allows for more precise         potential problems, as researchers may lack insight into
estimates of infection and case fatality rates throughout the       data collection methods and experience with new types of
course of the pandemic. To elucidate the behavioral,                data, which can lead to conflicting interpretations and
demographic, weather, and policy factors that contribute to         conclusions about the pandemic.
or inhibit the spread of COVID-19, IDA compiled panel
data sets of empirically derived, publicly available COVID-
19 data. We then analyzed which factors were most highly
correlated with both the increased and decreased spread
within U.S. states and counties. Our analysis shows that
mobility to retail and recreation locations (i.e., bars and
restaurants) was highly correlated with increased COVID-
19 case counts.

                                                                i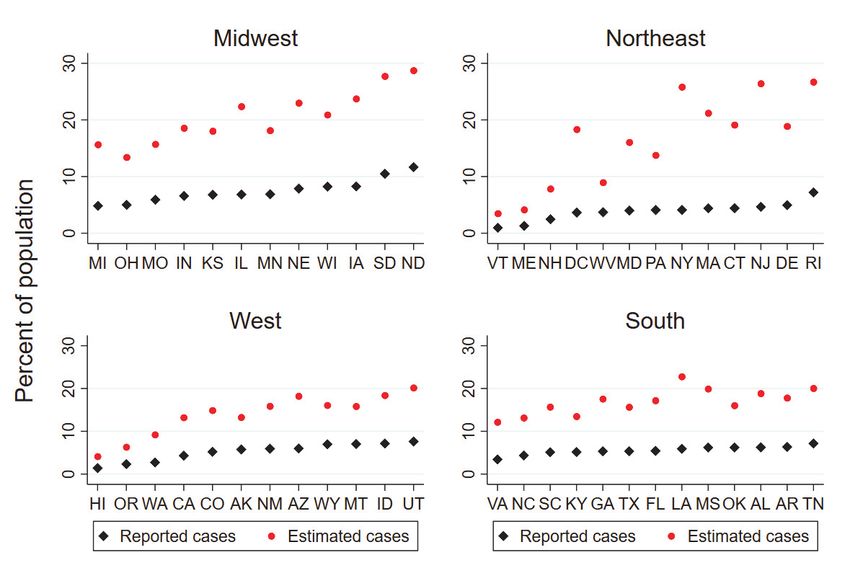
Empirical Analysis of COVID-19 in the U.S.
Dr. Emily Heuring
Controlled by:
Controlled by:
CUI Category:
Distribution/Dissemination Control: Add CUI line 4
POC:
Institute for Defense Analyses
4850 Mark Center Drive Alexandria, Virginia 22311-1882
Early in the pandemic, the sponsor identified a need
for empirical data and analysis to support decision
making
  - Traditional epidemiology models (SEIR) show what can
    happen, not what will happen
    -   Changes in behavior change the trajectory of the spread of the virus

  - Sponsor identified a need to compile a large data set of
    empirical data from a variety of sources

  - It is important to identify the factors most associated with both
    mitigation and spread of the virus

                                                                               1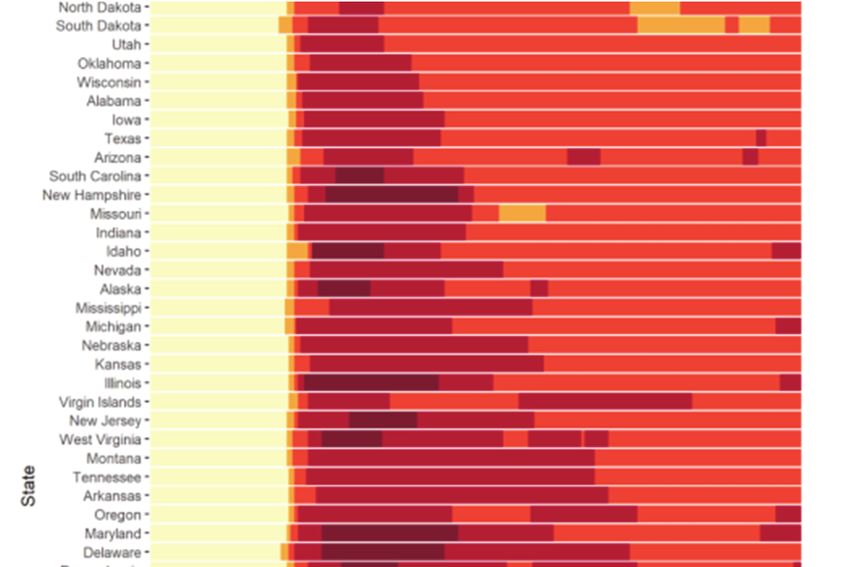
COVID-19 is the first pandemic in history in which vast
amounts of data are openly accessible to the public

                                                          2
True Prevalence of COVID-19 vs Reported Case Counts
3COVID-19 case counts have been chronically
underreported from the beginning of the pandemic
• Causes of underreporting:
• Inadequate testing supplies and access during initial months
• Those who had mild/asymptomatic cases weren’t aware that they had
COVID-19 and did not get tested
• We use serology data to estimate true COVID-19 prevalence in the U.S.
• Serology testing detects antibodies to SARS-CoV-2 from previous infection
• Although many city and state-level seroprevalence estimates were published, many
had biased sampling techniques
• We prefer CDC’s seroprevalence methods: https://www.cdc.gov/coronavirus/2019-
ncov/cases-updates/geographic-seroprevalence-surveys.html
• Compare the antibody prevalence to the number of reported cases at
multiple points in time
• Ten sample locations initially (has since been expanded)
• Assume that for a given day, all regions in the U.S. had the same underreporting
ratio
• Assume no antibody decay (conflicting data in the literature)
4True prevalence estimates create a clearer picture of the
pandemic
Estimated vs Reported Share of Population Infected
Cumulative
5Using seroprevalence data, we can estimate the
percentage of the population in each state who have
been infected with COVID-19
6
Data as of December 16With true prevalence estimates, we can calculate
infection fatality rates for the U.S.
Estimated True Infections and Case Fatality Rate (CFR) and
Known Cases Infection Fatality Rate (IFR)
350,000 80%
300,000 70%
250,000 60%
50%
200,000
40%
150,000
30%
100,000
20%
50,000
10%
0 0%
CFR IFR (20 days)
Estimated true infections New known cases
7Effect of mitigation policies on the spread of COVID-19
8We examined how mitigation policies over the course of
the pandemic affected COVID-19 case growth or decline
• To reduce bias from many mitigation policies being implemented
simultaneously, we use a two-stage approach:
• How policies affect mobility (first stage)
• How changes in mobility from policies affect new cases (second stage)
• We find evidence that policies aimed at retail and recreation traffic
decrease new cases
9Example policy data –
Oxford’s Policy Stringency Index
Oxford US State Policy Stringency Index
Measure Name Type Targeted/general?
Containment and closure
C1 School closing Ordinal Geographic
C2 Workplace closing Ordinal Geographic
C3 Cancel public events Ordinal Geographic
C4 Restrictions on gathering size Ordinal Geographic
C5 Close public transport Ordinal Geographic
C6 Stay-at-home requirements Ordinal Geographic
Restrictions on internal
C7 Ordinal Geographic
movement
Restrictions on international
C8 Ordinal No
travel
Health systems
H1 Public information campaign Ordinal Geographic
U.S. Stringency Index Rating Over time
Laura Hallas, Ariq Hatibie, Saptarshi Majumdar, Monika Pyarali, Thomas Hale. “Variation in US states’ responses to COVID-19 2.0.” 10
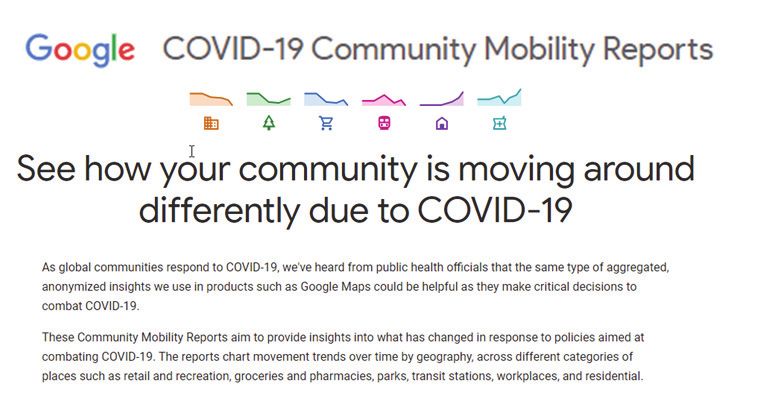
Blavatnik School of Government Working Paper. Available: www.bsg.ox.ac.uk/covidtrackerIn the U.S. in 2020, mobility to most places fell below
baseline except in parks and residential locations
% Change in Mobility by Type (7 day avg)
• Mobility to most Source: Google Mobility Data
places was below the 100
baseline for most of 80
2020
60
• Parks and residential Missing data from
some states
mobility was above 40
baseline as people 20
stayed home or went 0
outside
-20
• Gradual decline at
end of CY20/early -40
CY21 as cases -60
Jan-20 Feb-20 Mar-20 Apr-20 May-20 Jun-20 Jul-20 Aug-20 Sep-20 Oct-20 Nov-20 Dec-20 Jan-21
increased retail and recreation grocery and pharmacy parks
transit stations workplaces residential
Use cell-phone mobility data as a proxy for adherence to mitigation policies
11Mitigation policy stringency is strongly correlated with
increased residential mobility
% change from Jan 2020
raw % change in mobility % change in mobility 12
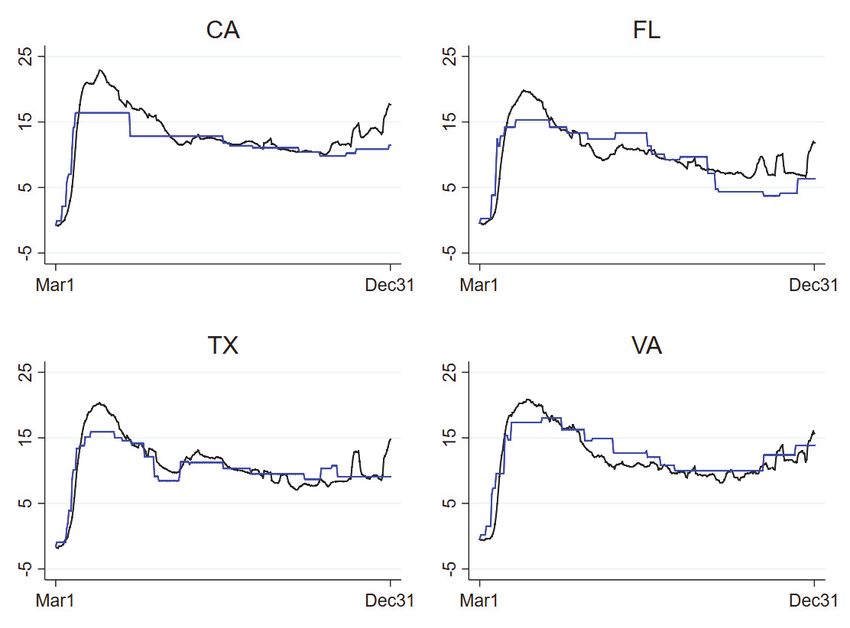
due to policiesMitigation policy stringency is also strongly correlated with
reduced mobility to retail and recreation locations
% change from Jan 2020
raw % change in mobility % change in mobility 13
due to policiesHow do reductions in mobility to retail and recreation
locations affect COVID-19 case counts?
U.S mobility U.S COVID-19 Cases (7-day moving avg)
% change from January 2020
raw % change in mobility
https://test-science.shinyapps.io/covid-19-tracker/
% change in mobility due to policies
14Mitigation policies that decreased traffic to retail and recreation
locations decreased COVID-19 case counts in the U.S.
Avg. percent Avg. percent
Avg Oxford change in retail & Avg Oxford change in retail &
First Stringency Index recreation Stringency Index recreation
stage Rating mobility from Rating mobility from
U.S.
results policies policies
March 2020 – July 2020 Aug 2020- Dec 2020
68.8 -25.2% 58.3 -15.4%
• Policies reduced traffic to retail and recreation locations by ~15-25%
Avg. percent Avg. percent
change in retail & Avg change in change in retail & Avg change in
recreation cases per 100k recreation cases per 100k
Second
U.S. mobility from from policies mobility from from policies
stage
results policies policies
March 2020 – July 2020 Aug 2020- Dec 2020
25.2% -17.8 15.4% -10.9
• The reduction in traffic to retail and recreation locations reduced
COVID-19 case counts by ~10-17 cases per 100,000 per day
15Genomic sequencing surveillance
16Rapid, high-throughput genomic sequencing has resulted
in unprecedented insight into how SARS-CoV-2 is evolving
PANGO (Rambaut et al. 2020 Nat Microbiol) is the algorithm behind the new lineages making the news.
Lineages reflect: Lineages DO NOT reflect:
1) A virus’s ancestry 1) Whether a mutation is meaningful
2) Geographic location 2) Whether a mutation is unique
3) A new mutation (in that lineage) (the same mutation can occur in
different lineages)
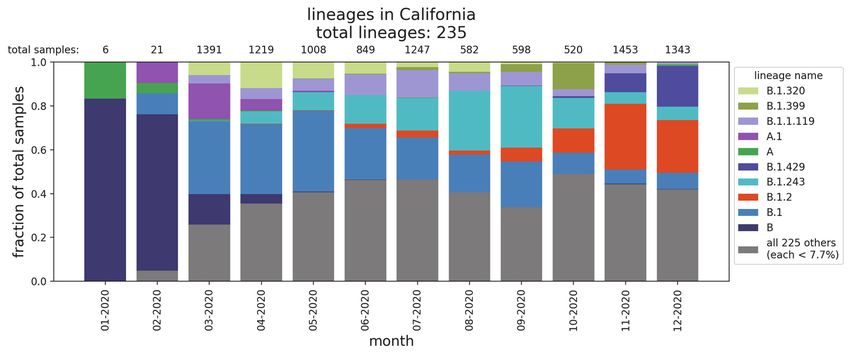
17Using genomic sequence data, we can track lineages over time
in the U.S.
18SARS-CoV-2 lineages have ebbed and flowed over the
course of the pandemic in the U.S.
• It is easy to determine what a virus’s genetic sequence is. It is more difficult to tell what the sequence
means. Lineage names reflect sequence, not meaning
• Things that may cause a lineage to be come predominant:
o Founder effect – the reduction in genetic variation when a small subset of a large population is used
to establish a new population
o One or repeated superspreader events with that lineage
o Small-number statistics/undersampling/biased sampling
o A mutation with a biological mechanism that facilitates higher infectivity/spread 19Thoughts on a pandemic in the time of “Big Data”
• More data is good!
• Allows for real-time analysis to support deployment of resources and policy
implementation
• Where more data or new data might complicate things:
• Lack of insight into data collection issues, important caveats, issues that might
affect analysis and interpretation
• Example: Early in the pandemic, some states were reporting both PCR and serology
test results into a rolled-up number, providing a false picture of real-time spread of
the virus
• Lack of experience with certain data types
• Example: Genomic sequencing generating concern about emerging variants
20Institute for Defense Analyses COVID-19 Team
Mr. Nathaniel Cleaves
Mr. Daniel Chaiken
Dr. Katherine Fisher
Dr. Kristen Guerrera
Mr. Ryan Murphy
Mr. Chris Oswald
Dr. Bryan Roberts
Dr. Zach Szlendak
21Form Approved
REPORT DOCUMENTATION PAGE OMB No. 0704-0188
The public reporting burden for this collection of information is estimated to average 1 hour per response, including the time for reviewing instructions, searching existing data
sources, gathering and maintaining the data needed, and completing and reviewing the collection of information. Send comments regarding this burden estimate or any other
aspect of this collection of information, including suggestions for reducing the burden, to Department of Defense, Washington Headquarters Services, Directorate for Information
Operations and Reports (0704-0188), 1215 Jefferson Davis Highway, Suite 1204, Arlington, VA 22202-4302. Respondents should be aware that notwithstanding any other
provision of law, no person shall be subject to any penalty for failing to comply with a collection of information if it does not display a currently valid OMB control number.
PLEASE DO NOT RETURN YOUR FORM TO THE ABOVE ADDRESS.
1. REPORT DATE (DD-MM-YYYY) 2. REPORT TYPE 3. DATES COVERED (From - To)
4-2021 Final
4. TITLE AND SUBTITLE 5a. CONTRACT NUMBER
DATAWorks 2021: Empirical Analysis of COVID-19 in the U.S. HQ0034-19-D-0001
5b. GRANT NUMBER
5c. PROGRAM ELEMENT NUMBER
6. AUTHOR(S) 5d. PROJECT NUMBER
Emily D. Heuring (OED) BA-9-4869
5e. TASK NUMBER
4869
5f. WORK UNIT NUMBER
7. PERFORMING ORGANIZATION NAME(S) AND ADDRESS(ES) 8. PERFORMING ORGANIZATION
REPORT NUMBER
Institute for Defense Analyses
4850 Mark Center Drive D-21549 NS
Alexandria, Virginia 22311-1882
H 2021-000032
9. SPONSORING/MONITORING AGENCY NAME(S) AND ADDRESS(ES) 10. SPONSOR/MONITOR'S ACRONYM(S)
OSD/CAPE
OSD-CAPE
1800 Defense Pentagon
Washington, DC 20301-1800 11. SPONSOR/MONITOR'S REPORT
NUMBER(S)
12. DISTRIBUTION/AVAILABILITY STATEMENT
Approved for Public Release. Distribution Unlimited.
13. SUPPLEMENTARY NOTES
Project Leader: Heuring, Emily D.
14. ABSTRACT
The zoonotic emergence of the coronavirus SARS-CoV-2 at the beginning of 2020 and the subsequent global pandemic of COVID-19 has caused massive disruptions to
economies and health care systems, particularly in the United States. Using the results of serology testing, we have developed true prevalence estimates for COVID-19
case counts in the U.S. over time, which allows for more precise estimates of infection and case fatality rates throughout the course of the pandemic. To elucidate the
behavioral, demographic, weather, and policy factors that contribute to or inhibit the spread of COVID-19, IDA compiled panel data sets of empirically derived, publicly
available COVID-19 data and analyzed which factors were most highly correlated with increased and decreased spread within U.S. states and counties. These analyses
can lead to some recommendations concerning future pandemic response preparedness.
15. SUBJECT TERMS
COVID-19, pandemic, empirical analysis, genomics
16. SECURITY CLASSIFICATION OF: 17. LIMITATION OF 18. NUMBER 19a. NAME OF RESPONSIBLE PERSON
ABSTRACT OF
a. REPORT b. ABSTRACT c. THIS PAGE Emily D. Heuring
PAGES
Unclassified Unclassified Unclassified Unlimited 19b. TELEPHONE NUMBER (Include area code)
30 (703) 845-4374
Standard Form 298 (Rev. 8/98)
Prescribed by ANSI Std. Z39.18You can also read