Debugging Version 7.18 - Creatio Academy
←
→
Page content transcription
If your browser does not render page correctly, please read the page content below
Debugging Version 7.18
This documentation is provided under restrictions on use and are protected by intellectual property laws. Except as
expressly permitted in your license agreement or allowed by law, you may not use, copy, reproduce, translate,
broadcast, modify, license, transmit, distribute, exhibit, perform, publish or display any part, in any form, or by any
means. Reverse engineering, disassembly, or decompilation of this documentation, unless required by law for
interoperability, is prohibited.

The information contained herein is subject to change without notice and is not warranted to be error-free. If you
find any errors, please report them to us in writing.

© 2021 Creatio. All rights reserved.
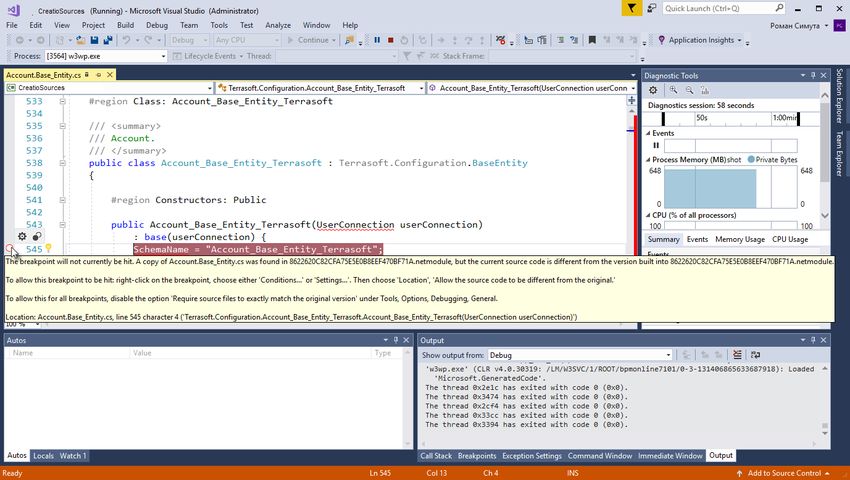
Table of Contents | 3

Table of Contents

Back-end debugging                                                                                  4
 Server code debugging tools                                                                        4
 Possible debugging issues                                                                          4
Debug the server code                                                                               6
 1. Exporting the configuration source code                                                         6
 2. Creating a Visual Studio project for debugging                                                  8
 3. Adding the exported files with the source code to the Visual Studio project                     9
 4. Attaching to the IIS process for debugging                                                     10
Front-end debugging                                                                                13
 Debugging tools                                                                                   13
 Scripts and breakpoints                                                                           14
 Execution control                                                                                 14
 Browser console use                                                                               15
 IsDebug mode                                                                                      19
Debug the server code                                                                              19

© 2021 Creatio. All rights reserved.
Back-end debugging | 4
Back-end debugging
Advanced
During the development process on the Creatio platform, developers often need to create the source code for
the server schemas of the "source code" type. These may be, for example, existing base schemas, custom
configuration classes, web services or business process scripts written in C#.
Server code debugging tools
Debug such code is easiest with integrated debugging features of the development environment, for example,
Visual Studio. The Visual Studio debugger enables developers to freeze the execution of program methods, check
variable values, modify them and monitor other activities performed by the program code.
Necessary conditions:
Debugging the code using the method described in this article is only possible for applications deployed on-
site.
Debugging the code using the method described in this article is only possible if the development in the file
system mode is turned off.
Enable the [Suppress JIT Optimization] checkbox (the [Options] menu, the [Debugging] > [General] tabs) to
be able to get the values of variables during the debugging. More information about optimized and
unoptimized code during debugging can be found in the Visual Studio documentation.
To begin debugging an application, you need to perform a number of steps:
1. Export the Creatio configuration source code to the local directory files
2. Create a new Visual Studio project for debugging
3. Add the exported files with the source code to the Visual Studio project
4. From the project, attach to the working process of the IIS server and start debugging.
Possible debugging issues
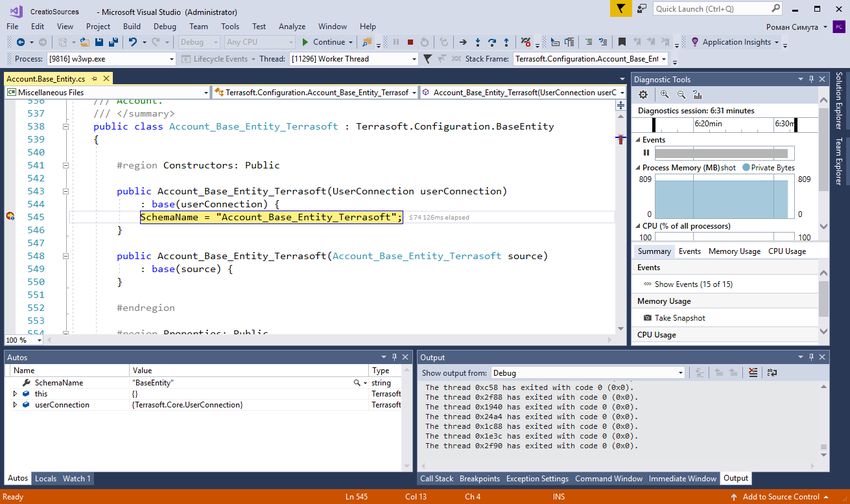
1. After attaching to the IIS process, it is possible that the breakpoint symbol is displayed as a white circle
bounded by a red circle.
A breakpoint is inactive and the application execution will not be interrupted because of it. When you hover the
cursor on the symbol of the inactive breakpoint, a hint will appear and notify you of the problem.
© 2021 Creatio. All rights reserved.Back-end debugging | 5
If the hint contains a message that the symbol information was not loaded (Fig. 8), it is necessary to do the
following:
a. Finish debugging ( Debug –> Stop Debugging ).
b. Close the source code file you are debugging.
c. Perform the [ Compile all items ] action in the [Configuration] section of the application.
d. While compiling and re-exporting source files, attach to the IIS process again.
e. After the compliation is done, re-open the source code file you are debugging.
Note. In some cases, it may be helpful to re-compile without detaching and attaching to IIS.
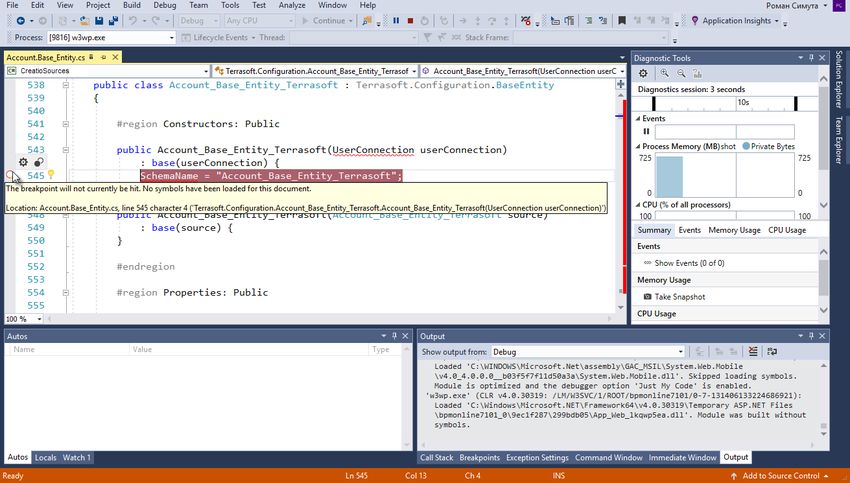
2. After the file with the source code is reopened, a message about non-uniform end-of-line characters may
appear.
© 2021 Creatio. All rights reserved.Debug the server code | 6
Press the [ No ] button If you accept the normalization of the characters (the [ Yes ] button), then the
breakpoint may become inactive again. The cause of the problem is displayed in the tooltip - file version
mismatch. The options for solving the problem are also displayed in the tooltip.
Debug the server code
Advanced
Necessary conditions:
Debugging the code using the method described in this article is only possible for applications deployed on-
site.
Debugging the code using the method described in this article is only possible if the development in the file
system mode is turned off.
Enable the [Suppress JIT Optimization] checkbox (the [Options] menu, the [Debugging] > [General] tabs) to
be able to get the values of variables during the debugging. More information about optimized and
unoptimized code during debugging can be found in the "JIT Optimization and Debugging" Visual Studio guide.
1. Exporting the configuration source code
To do this, perform the application setup.
In the Web.config file located in the root of the application (“external” Web.config), set the “true” value for the
debug attribute of the compilation element.
© 2021 Creatio. All rights reserved.Debug the server code | 7
Save the schema to apply changes.
In the Web.config file located in the Terrasoft.WebApp directory of the application (“nternal” Web.config), specify
the values for the following items:
To configure IncludeDebugInformation , specify the “ true ” value.
To configure CompilerSourcesTempFolderPath , specify the path to the directory where the source files will be
exported.
To configure ExtractAllCompilerSources , set the value to “true” if you want to export all schemas when
performing the [Compile modified items] action in the [Configuration] section. To export only the modified
schemas, set the value to “ false ” (the default value) .Debug the server code | 8
format: [ Name of the schema in the configuration ].[ Package name ]_[ Schema type ].cs.
For example: Contact.Base_Entity.cs, ContractReport.Base_Report.cs.
2. Creating a Visual Studio project for debugging
Attention. Creating a Visual Studio project is unnecessary to debug the source code – opening the
necessary files in Visual Studio is sufficient. However, if debugging is performed frequently, or you need to
work with a large number of files at the same time, creating a project will make it easier.
To create a project for debugging an application in Visual Studio, execute the File > New > Project menu
command.
In the properties window of the created project, select the [ Class Library (.NET Framework) ] project type (class
library for the classic Windows application), and specify the name and location of the project.
© 2021 Creatio. All rights reserved.Debug the server code | 9 After creating the project, you need to remove an extra file from it (by default, the file Class1.cs is added to the new project) and save the project. 3. Adding the exported files with the source code to the Visual Studio project To do this, select Add > Existing Item from the project's context menu in the solution explorer. In the dialog box that appears, you must go to the directory with the downloaded files with the source code and select all files. © 2021 Creatio. All rights reserved.
Debug the server code | 10

    Note. Add only the files needed for debugging to the Visual Studio project. However, the transition
    between methods during debugging will be limited only by the methods of classes implemented in the files
    added to the project.

Save the project after adding the files.

4. Attaching to the IIS process for debugging
To begin debugging, attach to the IIS server process, where the application runs. To do this, select the Debug >
 Attach to process command in the Visual Studio menu.

© 2021 Creatio. All rights reserved.
Debug the server code | 11 In the opened window, select the working IIS process in the list of processes, where the application pool is running. © 2021 Creatio. All rights reserved.
Debug the server code | 12

    Attention. The name of the working process can be different, depending on the configuration of the IIS
    server being used. With a regular IIS, the process is w3wp.exe, but with IIS Express, the process name is
    iiexpress.exe.

By default, the IIS working process is run under the account whose name matches the name of the application
pool. To display processes of all users, set [ Show processes from all users ] checkbox (Fig. 6).

After you attach to the IIS process, you can start debugging. To do this, open the file with the desired source
code and set a breakpoint.

As soon as the method with the breakpoint is used, the program will be stopped and you can view the current
state of the variables.

© 2021 Creatio. All rights reserved.
Front-end debugging | 13
Front-end debugging
Advanced
The client part of the Creatio application is represented by configuration schemas (modules), described in
JavaScript language. Debugging of the source code of configuration schemas is executed directly from the
browser. Developer tools that provide for debugging for all browsers, supported by Creatio, are used for this
purpose.
Debugging tools
To run tools for client debugging, execute the following command in a browser:
Chrome: F12 or Ctrl + Shift + I .
Firefox: F12 .
Internet Explorer: F12 .
All supported browsers provide mostly similar capabilities for debugging client code. Most common and
frequently used debugging methods are listed below. For more details about debugging with browser tools, see
the following documentation:
Chrome developer tools
Firefox developer tools
Internet Explorer developer tools
© 2021 Creatio. All rights reserved.Front-end debugging | 14
Scripts and breakpoints
You can view the full list of scripts, connected to the page and downloaded to a content by means of developer
tools. Open any script to set a breakpoint in the place where you want to stop execution of a source code. In the
stopped code, you can view current values of variables, execute commands etc.
To set a viewpoint, take the following actions:
open necessary script file (for example, execute name lookup by combination of buttons Ctrl+O and Ctrl+P
);
go to code string where you want to set a breakpoint (for example, execute script lookup on the basis of
method name);
set a breakpoint by one of the following methods: click string name, press F9 button or select "Add
breakpoint" item in right-click menu (cursor should be in the string, to which you want to add breakpoint).
You can also set a conditional breakpoint, for which you should set a condition for activation of the breakpoint.
You can also break an execution process directly from the code by the debugger command
function customFunc (args) {
...
debugger; //Front-end debugging | 15
Navigation panel in Internet Explorer browser debugger
Chrome browser provides an additional two commands for execution control:
deactivate all breakpoints (5);
deactivate/activate automatic break in case of error (6).
For more information about possibilities and commands of navigation panel for a browser, see corresponding
documentation.
Browser console use
In the course of debugging, you can execute JavaScript commands, display debugging, trace information,
execute measurements and code profiling. The console object is used for this purpose.
JavaScript commands calling
To start operation of the browser console, you should open it by going to the [ Console ] tab or opening it in
addition to the debugger, using the [ Esc ] button. You can then enter commands in javaScript and start their
execution by pressing [ Enter ].
Debug information output
You can enable debugging information of a different nature, i.e. info messages, warnings and error messages, in
the console. For this purpose you can use corresponding console object methods.
© 2021 Creatio. All rights reserved.Front-end debugging | 16
Console methods for output of debug messages.
Method Description Chrome Firefox Internet
Explorer
console.log(object Outputs arguments in console and + + +
[, object, ...]) separate them with comma. Used
for enabling different general
messages.
console.info(object Similar to log() method but + + +
[, object, ...])
outputs messages in other style
and emphasizes their significance.
console.warn(object Outputs warning message in + + +
[, object, ...]) console.
console.error(object Outputs error message in console. + + + (8+)
[, object, ...])
An individual style is used for each type of outputted message.
The represented console methods support formatting of outputted messages. This means that you can use
special controlling sequences (templates) that will be replaced by corresponding values (arguments, additionally
transferred to the function).
Console methods support the following formation templates.
© 2021 Creatio. All rights reserved.Front-end debugging | 17
Console message formation templates
Template Data type Example of use
%s String console.log("%s is one of flagship products of a company %s",
"Sales Creatio", "Terrasoft");
%d, %i Number console.log("Platform %s was issued for the first time ever in %d
year", "Creatio", 2011);
%f Float console.log("Pi character is equal to %f", Math.PI);
%o DOM-item (it console.log("DOM-View of item : %o",
is not document.getElementsByTagName("body")[0]);
supported by
IE)
%O JavaScript console.log("Object: %O", {a:1, b:2});
Object (is not
supported by
IE and
Firefox)
%c CSS style (is console.log("%cGreen text, %cRed Text on a blue background,
not supported %cCapital letters, %cPlain text", "color:green;", "color:red;
background:blue;", "font-size:20px;", "font:normal; color:normal;
by IE)
background:normal");
Tracing and validations
Console methods for tracing and verification
Method Description Chrome Firefox Internet
Explorer
console.trace() Outputs call stack from + + + (11+)
code point where method
was called. Call stack
includes file names, string
numbers and also call
counters of trace()
method from one and the
same point.
console.assert(expression[, Verified expression, + + +
object, ...]) transferred as an (28+)
expression parameter and,
if the expression is false,
outputs error with (
© 2021 Creatio. All rights reserved.Front-end debugging | 18
outputs error with (
console.error () ) call stack
in the console, otherwise it
outputs nothing.
Console.trace() method outputs informative stack-trace with full list of functions and their arguments at the
moment of call.
Due to the console.trace() method you can comply with rules in the code and ensure that code execution
results meet expectations. Using console.assert() you can execute code testing, i.e. if execution result is
unsatisfactory, the corresponding value will be discarded.
An example of the console.assert() method for testing of results
var a = 1, b = "1";
console.assert(a === b, "A is not equal to B");
Profiling and measurement
You can measure code execution time with browser console methods.
Console methods for measurement of code execution time
Method Description Chrome Firefox Internet
Explorer
console.time(label) Starts counter (milliseconds) with + + + (11+)
label .
console.timeEnd(label) Stops counter (milliseconds) with + + + (11+)
label and plans result in
console.
An example of console.time() and console.timeEnd() methods in code:
var myArray = new Array();
// Starts counter with Initialize myArray tag.
console.time("Initialize myArray");
myArray[0] = myArray[1] = 1;
for (i = 2; iDebug the server code | 19
You also can execute code profiling and output profiling stacks that contain detailed information about how much
time was spent by a browser for definite operations.
Console methods for code profiling
Method Description Chrome Firefox Internet
Explorer
console.profile(label) Runs Java Script profiler + + (when + (10+)
and displays results, DevTools
marked with label . panel is
opened)
console.profileEnd(label) Stops Java Script profiler. + + (when + (10+)
DevTools
panel is
opened)
You can view profiling results in:
Chrome — Profiles tab:
Firefox — Performance tab;
Internet Explorer — Profiler tab.
IsDebug mode
You need the ‘isDebug’ mode for getting detailed data about errors and tracing them in the source code. You can
debug the source code using built-in browser tools.
In the normal mode, the code in the browser is minified. This means that the client scripts are compiled in the
all-combined.js file that contains the core functionality. The file is updated during the build compilation. The
‘isDebug’ mode disables compilation and compression of the core JS files and allows retrieving the client scripts
as a series of individual files.
Attention. The isDebug mode is implemented in version 7.13.0 and up.
Debug the server code
Easy
To check the current status of the client debugging mode, open the browser console by pressing the F12 key or
pressing Ctrl+Shift+I. Aside from the current status of the client debugging mode, the console will display the
code to enable or disable debugging.
© 2021 Creatio. All rights reserved.Debug the server code | 20
You can enable the client debugging mode using the following methods:
Execute the following code in the browser console
Terrasoft.SysSettings.postPersonalSysSettingsValue("IsDebug", true)
Change the value of the [Debug mode] system setting.
To apply the changes, refresh the page or hit F5.
Upon activating the client debugging mode, you will see the Debug indicator next to the site’s version number.
Note. Enabling the client debugging mode will affect site performance. For instance, it can increase the
time needed for the pages to load.
© 2021 Creatio. All rights reserved.Debug the server code | 21 The figures below show examples of errors displayed in the console with the ‘isDebug’ mode disabled and enabled. Displaying an error (‘isDebug’ disabled) Displaying an error (‘isDebug’ enabled) © 2021 Creatio. All rights reserved.
Debug the server code | 22

© 2021 Creatio. All rights reserved.
You can also read