Q4 2019 Turkish Property Market Overview - Pamir&Soyuer
←
→
Page content transcription
If your browser does not render page correctly, please read the page content below

INVESTMENT   BROKERAGE   ADVISORY   DEVELOPMENT

 Q4 2019 Turkish Property Market Overview

Contents
Economic Overview        3

Istanbul Office Market   5

Turkish Retail Market    6

Vertical Farming         7

Definitions              11

                              2
                                  2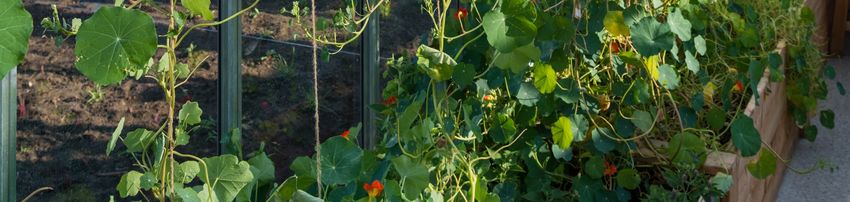
INVESTMENT         BROKERAGE                   ADVISORY                DEVELOPMENT

         Economic Overview
          GDP

          During the 3rd quarter of 2019, GDP grew by 0.9 % compared to the same
          period in 2018. When the activities constituting GDP were analysed; total
          value added increased by 3.8% in agriculture, 1.6% in industry and decreased
          by 7.8% in construction sector compared with the same quarter of last year
          (quarter-on-quarter).

          Please note that according to OECD Economic Survey of Turkey GDP growth is
          projected to decline 2.6% in 2019, and projected to grow 1.6% in 2020.

         Figure 1. Turkish Economy: selected indicators
         annual growth
          50%

          40%

          30%

          20%

          10%

           0%

         -10%
                 2015Q1
                          2015Q2
                                   2015Q3
                                            2015Q4
                                                     2016Q1
                                                              2016Q2
                                                                       2016Q3
                                                                                2016Q4
                                                                                         2017Q1
                                                                                                  2017Q2
                                                                                                           2017Q3
                                                                                                                    2017Q4
                                                                                                                             2018Q1
                                                                                                                                      2018Q2
                                                                                                                                               2018Q3
                                                                                                                                                        2018Q4
                                                                                                                                                                 2019Q1
                                                                                                                                                                          2019Q2
                                                                                                                                                                                   2019Q3
                                                                                                                                                                                            2019Q4

                                       GDP Growth (%)                                        Producer Price (%)                                         CPI (%)

         Source: TURKSTAT

Building Construction Cost Index, December 2019
                                Total Labour    Material
Monthly Change                 0.83%     0.46%   1.01%
Annual Change                 11.04%    25.70%   5.12%

House Sales Statistics, 2019 Q4                                                                       Change*
Total House Sales      483,256 houses                                                                29.6 %
First Sales            174,570 houses                                                                - 5.9 %
Second Hand Sales      308,686 houses                                                                64.9 %                                                                                          3
Sales to Foreigners      13,558 houses                                                             - 12.6 %
(*) Change over the same quarter of the previous year Source: TURKSTAT
INVESTMENT   BROKERAGE   ADVISORY    DEVELOPMENT

Economic Overview
Inflation

CPI in Turkey during December 2019 increased by 0.74%, and 11.84%
compared to September 2018, and previous 12-month period. Leading
contributors to CPI on a monthly and annual basis were respectively food &
non-alcoholic beverages and alcoholic beverages & tobacco. Cost of food &
non-alcoholic beverages increased by 2.93% between November and December
2019 on an annual basis cost of alcoholic beverages and tobacco increased by
43.12%.

Policy Rate

CBRT decreased the rate by 250 basis points in October and 200 basis points in
December MPC meetings respectively, so decided to reduce the one-week repo
auction interest rate, which is Turkey’s Policy Rate, to 12.00%. CBRT is expected
that net exports will continue to contribute to growth in the upcoming period
and the gradual recovery in the economy will continue with the downward trend
in inflation and the improvement in financial conditions.

Figure 2. Policy rate and CPI
30

24

18

12

  6

  0
      2015          2016              2017            2018       2019
                                    Policy Rate (%)    CPI (%)

Source: TURKSTAT

                                                                                    4
INVESTMENT       BROKERAGE    ADVISORY     DEVELOPMENT

Istanbul Office Market
 Demand and Supply

In the 4th quarter of 2019, cumulative supply of grade A office space in Istanbul
remained unchanged at 5.06 million sq m. During the 4th quarter of 2019,
21,915 sq. m take-up was recorded, comprising 59% of overall transactions
recorded in Istanbul primary office areas. 43% of the transactions were recorded
in Kozyatağı, 18% in Kağıthane, 13% in Maslak, 9% in Kozyatağı, 9% in Sisli-
Zincirlikuyu-Besiktas, 9% in Ümraniye and 8% in Levent-Etiler.
 Vacancy and Rental Level

 In the 4th quarter of 2019, average rents in Istanbul grade A office market
 remains stable compared to the previous quarter. Vacancy rate in Istanbul
 Grade A Office Spaces fall to 29% in total, remained unchanged at 28% in
 European Side, and 30 % in Asian Side of İstanbul. Vacancy rates realized
 as 35.9% in Maslak, 29.6% in Kozyatağı, 29.6% in Umraniye, 28.5% in Sisli-
 Zincirlikuyu-Besiktas and 16.8 % in Levent-Etiler. Prime rent stood at 150
 TL/sqm/month in Levent-Etiler region.

 Figure 5. Istanbul grade A office GLA, prime rent
 3.500.000 (sq. m)                                                               180 (TL/sq. m/month)

 3.000.000                                                                       160
                                                                                 140
 2.500.000
                                                                                 120
 2.000.000                                                                       100
 1.500.000                                                                       80
                                                                                 60
 1.000.000
                                                                                 40
   500.000                                                                       20
             0                                                                   0
                   2013      2014        2015    2016    2017    2018*    2019
                 European Side (GLA)                 Asian Side (GLA)
                 Prime Rent (European Side)          Prime Rent (Asian Side)
         (*) Kağıthane, Kavacık and Maltepe-Kartal sub-office areas were added to the stock.

 Source: Pamir&Soyuer

                                                                                                        5
INVESTMENT   BROKERAGE    ADVISORY    DEVELOPMENT

Turkish Retail Market
Demand

Based on data released by the Turkish Council of Shopping Centers (AYD) and
Akademetre Research, compared to December 2018 the shopping centers
sales index increased by 17.2% to 375 points. During the 4th quarter of 2019,
footfall index in December, decreased by 3.8% compared to the same period of
last year. In December 2019, shopping centers’ sales per leasable area (sq. m.)
occurred as 1,826 TL in Istanbul, 1,160 TL in Anatolia, and 1,428 TL in Turkey.

Supply

During the 4th quarter of 2019, Turkey’s shopping center supply increased to
12.72 million sq. m with the opening of 5 new shopping centers; Lens Shopping
Mall (38,540 sq. m) in İstanbul, Kuzu Effect Shopping Mall (30,000 sq. m) in
Ankara, Hilltown Karşıyaka Shopping Mall (68,000 sq. m) in İzmir, 01 Burda
Shopping Mall (65,000 sq. m) in Adana and Kıvılcım Shopping Mall (12,000 sq.
m) in Konya. GLA/1,000 inhabitants increased to 155.11 sq. m in Turkey.
Moreover, Istanbul has the highest rate of GLA/1,000 inhabitants as 326.79 sq.
m, which is followed by Ankara and Bolu with 301.02 sq. m and 281.16 sq. m
per 1,000 inhabitants, respectively.

Figure 6. Shopping centers visitor index
  120                                                                      50%
                                                                           40%
  110                                                                      30%
                                                                           20%
  100
                                                                           10%

   90                                                                      0%
                                                                           -10%
   80                                                                      -20%

                                            % Change   Visitor Index

Source: AYD and Akademetre Research

                                                                                  6
INVESTMENT   BROKERAGE   ADVISORY   DEVELOPMENT

Vertical Farming
What is Vertical Farming?

The concept of the modern vertical farm is developed in a class led by
Columbia University environmental health sciences Prof. Dr. Dickson
Despommier at 1999. Despommier and his students developed the idea of a
multi-story building in which layers of crops could be grown on each floor: in
other words, a contemporary vertical farming tower.

Due to rapid urbanization, resources such as water supplies, sewage,
biodiversity, land and soil resources, and public health are under pressure.
The scarcity of land and depletion of natural resources have been a driving
factor to find smart solutions in this fast-moving world. Vertical farming is a
method of urban farming of fruits, vegetables, and grains inside a building in a
city. There are 3 types of vertical farming technique ; hydroponics, aeroponics
and aquaponics.

                                              Hydroponics; most common methods of
                                              vertical farming, hydroponics
                                              includes growing plants without soil and in
                                              a water solvent containing mineral
                                              nutrients.
                                              Aeroponics; improved by NASA scientist,
                                              the dangling roots absorb a fine mist
                                              comprised of an atomized version of the
                                              nutrient solution sprayed directly onto the
                                              roots by a pump.

                                              An aquaponic system contains a soil-free
                                              plant bed suspended over a body of water
                                              containing nutrients necessary for plant
                                              growth. But within the body of water is a
                                              population of fish (typically herbivores)
                                              that produce waste that function as
                                              fertilizer for the plants. In turn, the plants
                                              help purify the water to make the water
                                              suitable for the fish.

                                                                                               7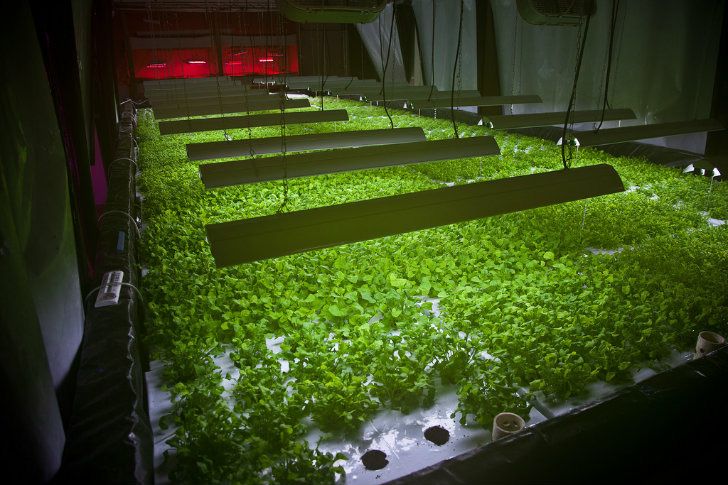
INVESTMENT           BROKERAGE     ADVISORY   DEVELOPMENT

              Vertical Farming
                  Benefits of Vertical Farming

                            Year - Round Production
                            The vegetables are grown in a controlled environment, protected from
                            pests, winds, and floods
                               Higher Yields
                               The production yields 6 or more depending on the crop
                                  No Pesticides or Herbicides
Socio – Economic Benefits

                                  Food grown is healthier, safer, and certified organic, making it
                                  even more appealing to consumers
                                     Tasty Vegetables
                                     Grown in special soil based media, which contribute to good
                                     tasting. Harvested every day and delivered immediately
                                         Space Savings
                                         The footprint of the vertical farming is small but can produce
                                         significantly more than traditional farm
                                             Creation of New Jobs

                            Vertical Farming
Environmental Benefits

                                               Low Carbon Emission
                                               Reduction in use of fossil fuels (no tractors, farm machinery,
                                               or shipping)
                                      Green Technologies
                                      Organic wastes being composed at the farm to ensure the use of
                                      safe, high quality fertilizers. (Reduce, reuse and recycle)
                                   Low Energy Usage
                                   Absolute control of air humidity and heat energy, this enables the
                                   recovery of a very large percentage of energy.
                              Low Water Usage
                              İrrigation occurs using an innovative flooding method, using very little
                              water. The water is also recycled and reused.
                            Environmentally Friendly
                            Ecosystem restoration; reduction of pathogens.

                                                                                                                8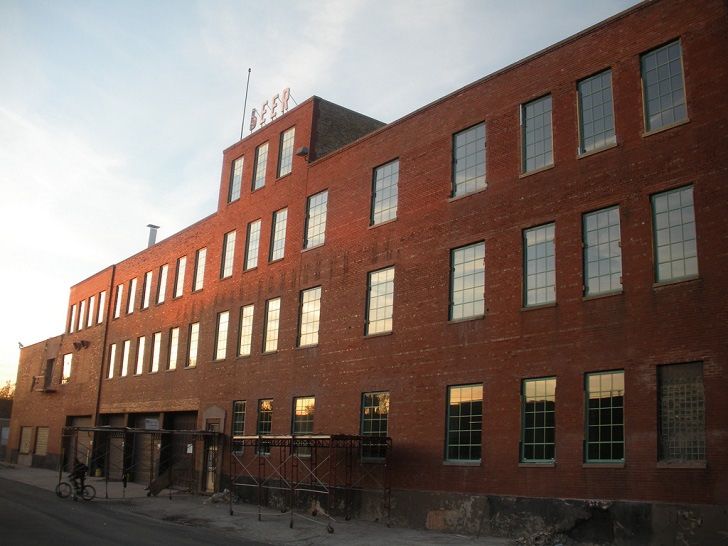
INVESTMENT   BROKERAGE   ADVISORY   DEVELOPMENT

Vertical Farming
The Plant, Chicago

The Plant is a formerly vacant
warehouse (8,686 sq m) repurposed
into functioning urban farm (zero
waste & energy). The area is
economically challenged area with
a high degree of vacancies. The
building itself had been vacant for
some time, and is being refurbished
and fit out using a “deconstruction”
process where 80% of waste
materials are put back into the
building’s new construction.

The main growing system within
the Plant is an aquaponics system.
Leafy greens growing in a
hydroponic (or water as medium)
system leach nitrates into the
water. This water is circulated to
tilapia, which filter the nitrates from
the water, creating clean water that
can be recirculated back to the
plants. This closed-loop ethos is
used throughout the building; spent
grain and barley feed the anaerobic
digestor and tilapia, the anaerobic
digestor system is net-zero energy,
and oxygen from the plants is
converted to CO2 in the kombucha
tea fermentation process.
(https://plantchicago.org/)

                                                  9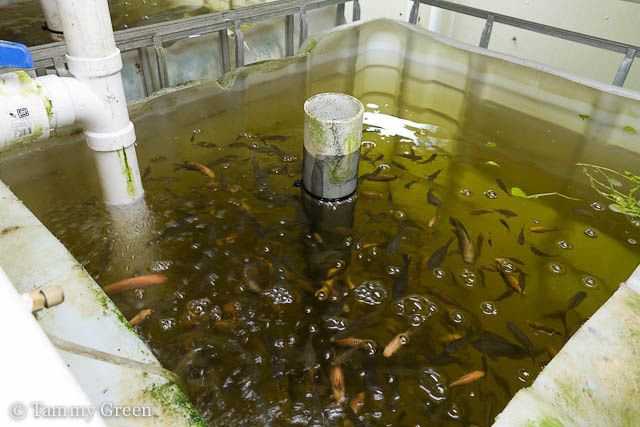
INVESTMENT   BROKERAGE    ADVISORY   DEVELOPMENT

      Vertical Farming
      The Plant, Chicago

                                       Zero Energy & Waste Circle

                                                                    Steam
                                                                                   Building
                   Light
                                                 Turbine                           Heat & Cool

                               CO2
                                                Generator          Bio
                                                                   Gas
                                                                                                 Steam
                                           Food Waste                    Food Waste

                                                                Anaerobic
                                                                 Digester                 Commercial
                                                                                            Kitchen
                                                                             Fertilizer
                                                                             Algae

      PLANTS
                                                         Fish                             Brewery
                                                                            Waste
CO2                            Oxygen

                                                                    Spent Barley

          Kombucha

      Please check the following video for more information
      https://www.youtube.com/watch?v=Uh_zJ09jUc0

                                                                                                         10
INVESTMENT BROKERAGE ADVISORY DEVELOPMENT
Definitions
Office
Istanbul Primary Office Regions: Pamir & Soyuer office database covers only Grade A office buildings which have total
floor area larger than 3,500 sq m and located in the primary office areas (Maslak, Levent-Etiler, Şişli – Zincirlikuyu -
Beşiktaş in the European side and Kozyatağı, Ümraniye and Ataşehir in the Asian side).
Net Absorption: The amount occupied at the end of a period minus the amount occupied at the beginning of a period and
takes into consideration space vacated during the period.
New supply: Total level of new office space to be built or under construction, with construction permit.
Average rent: Expressed in TL/sq m/month excluding tax and charges. The average rent represents the average rents of
all deals, weighted by their total surface area.
Prime rent: Expressed in TL/sq m/month excluding tax and charges. The prime rent represents the average value in
the first quartile of all deals and excludes extreme values.
Prime yields: Expressed as a percentage, between rents and the capital value of assets. The prime yield represents the
lowest yield observed in a given period of time and excludes extreme values.
Vacancy rate: Represents the immediately available supply over the existing office stock.
Retail
Definition and Classification of Retail Centres: Retail centres are defined as purpose built, shopping developments with
over 5,000 sq. m gross leasable area (GLA) excluding supermarket area and comprising of 30 or more retail units.
Database covers all operating retail centres. The additional or expanded space is considered as a new retail centre floor
space. .
Principal types of retail centres are classified using British Council of Shopping Centre (BCSC) definitions as follows:
Town Centre Malls: are shopping centres located in a town centre or the central business district of a city.
District Shopping Centres: are located outside of the town centre proper but still within the urban area.
Outlet Centres: are defined as centres where the majority of retailers sell branded merchandise at a substantial discount
to the recommended retail price.
Retail Parks: are purpose built centres solely comprised of at least three retail warehouses of not less than 1,000 sq. m
and have common parking.
Average retail rents are calculated taking into consideration small to medium-size units’ (MSU) rents, excluding anchor
tenants.
Disclaimer
This report should not be relied upon as a basis for entering into transactions without seeking specific, qualified,
professional advice. Whilst facts have been rigorously checked, Pamir & Soyuer can take no responsibility for any damage
or loss suffered as a result of any inadvertent inaccuracy within this report. Information contained herein should not, in
whole or part, be published, reproduced or referred to without prior approval. Any such reproduction should be credited to
Pamir & Soyuer.
© Pamir & Soyuer 2020
11Who We Are
Pamir & Soyuer was established in 1993 by Ali Pamir and Firuz Soyuer to provide real estate advisory
services to corporate clients and HNWI.
Mr. Pamir and Mr. Soyuer both started their careers in investment banking and have been active in Turkish
real estate since 1986 primarily through Pamir & Soyuer or related entities. Collectively they have over 50
years of residential and commercial real estate experience, and have transacted over USD 1 billion in real
estate investment sales.
Headquarters of Pamir & Soyuer is located in Istanbul with a liason office in Bodrum.
What We Do
Pamir & Soyuer is active in both residential and commercial real estate, and provides the following services:
• Investment Advisory & Sales
• Development Advisory & Management
• Project Marketing
• Tenant Representation
• Agency/Owner Representation
• Marketing & Feasibility Studies
• Valuation
Research Investment
Hazal Bali Firuz Soyuer
Associate Managing Partner
+90 (212) 231 55 30 ext.119 +90 (212) 231 55 30 ext.117
ozkanh@pamirsoyuer.com.tr fs@pamirsoyuer.com.tr
Research Reports are available at pamirsoyuer.com.tr/en/research/
INVESTMENT BROKERAGE ADVISORY DEVELOPMENT
Pamir & Soyuer Gayrimenkul Danışmanlık A.Ş.
Hakkı Yeten Cad. 15/7 Şişli 34365 İstanbul Turkey
pamirsoyuer.com.tr
12You can also read


