ELANOR RETAIL PROPERTY FUND - 1HFY20 Results Presentation 17 February 2020
←
→
Page content transcription
If your browser does not render page correctly, please read the page content below
ELANOR RETAIL PROPERTY FUND
1HFY20 Results Presentation

17 February 2020
Contents

Section                                             Page No.

     1    1HFY20 Highlights                                3

     2    Strategy and Business Overview                   5

     3    Execution – Divestment of Income Assets          8

     4    Execution – Value-Add Retail Assets              10

     5    Portfolio Overview                               15

     6    1HFY20 Financial Results                         25

     7    Strategy and Outlook                             29

                                                                [2]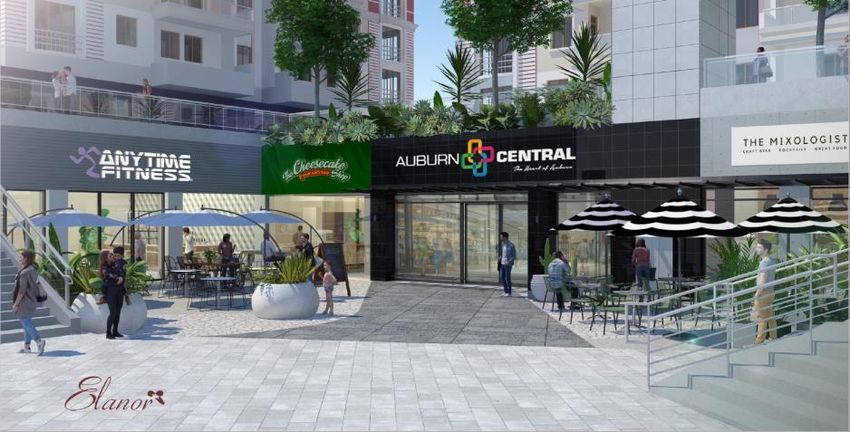
1HFY20 Highlights
1HFY20 Results Highlights

                                                                             •   Core Earnings includes:

       Core Earnings                                $7.1m                        − BIG W Auburn Central surrender fee
                                                                                 − Tweed Mall Aldi repositioning downtime
                                              12.6% increase on 1HYF19           − Accrued performance fee for the period

                                                                             •   95% Core Earnings payout ratio
     Distributions Per                              5.24c
         Security                            12.6% increase on 1HFY19

                                                                             •   No material changes to portfolio valuations from June 2019
                                                                             •   Three Income Assets currently being marketed for sale
     NTA Per Security                               $1.54
                                           0.7% increase from 30 June 2019

                                                                             •   No change in portfolio average capitalisation rate from June 2019
     Portfolio Avg Cap
           Rate
                                                      6.7%
                                             No change since 30 June 2019

                                                                             •   Average debt maturity of 2.3 years

           Gearing1
                                                     39.3%                   •   Weighted average cost of debt of 4.0% p.a.
                                              Increased from 38.8% as at     •   Gearing within ERF’s target range (30% to 40%)
                                                     30 June 2019

                                                                                                                                         [4]
1.   Net debt / (total assets less cash)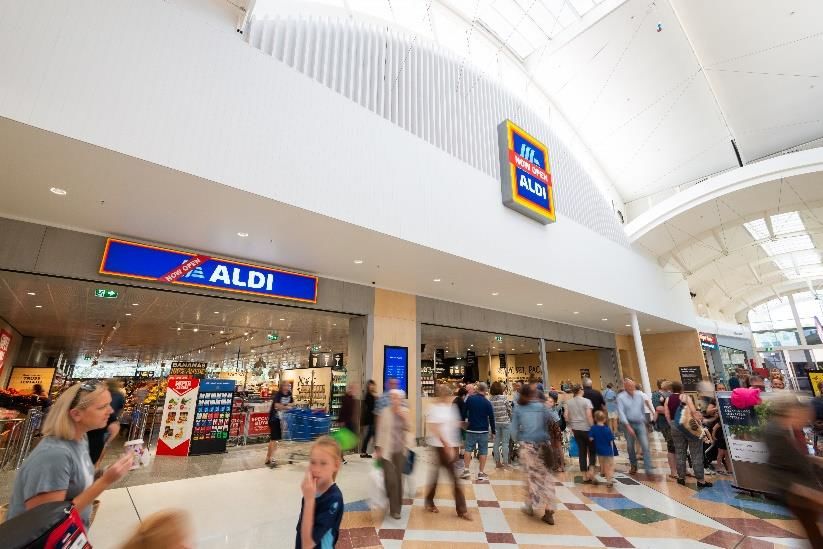
Strategy and Business Overview

ERF – Value-Add Retail Real Estate Fund
                                      • Focus on retail assets which can be repositioned or have significant value-add opportunities
         Value-Add Retail
         Real Estate Fund             • Prevailing market conditions are presenting high quality Value-Add investment opportunities in the
                                         Australian retail sector

     ‘ True Play’ Real Estate Funds            Grow Portfolio                                    Divest and Redeploy Capital
                Manager                       Value-Add Assets                                           Income Assets
                                                  $207.4m                                                    $130m
                                                    61%                                                       39%
Deep and Differentiated Capability
 in Delivering Value through Retail
           Repositioning              High, risk-adjusted total returns
                                      from repositioning retail tenant mix                   Strong cash flows, secured by long
                                      and /or unlocking the assets’                          leases to anchor retailers
                                      highest and best use real estate
                                      potential

Strong Track Record of Investment
                                      • The Fund’s Value-Add retail assets have delivered a 15% p.a. total return since ERF was listed
             Returns

                                      • Senior management capabilities across acquisition sourcing, asset management and development
     Highly Scalable Platform            management to enable the execution of ERF’s Value-Add retail asset investment strategy

                                      • Post the divestment of the Fund’s Income-Assets, ERF will be in a position to acquire up to $100m
        Capital for Growth               of additional Value-Add retail assets based on a 35% gearing ratio

                                      • ERF will consider capital management initiatives, including buy-backs, as part of positioning the
 Capital Management Initiatives          Fund for growth and future capital raisings

                                                                                                                                            [6]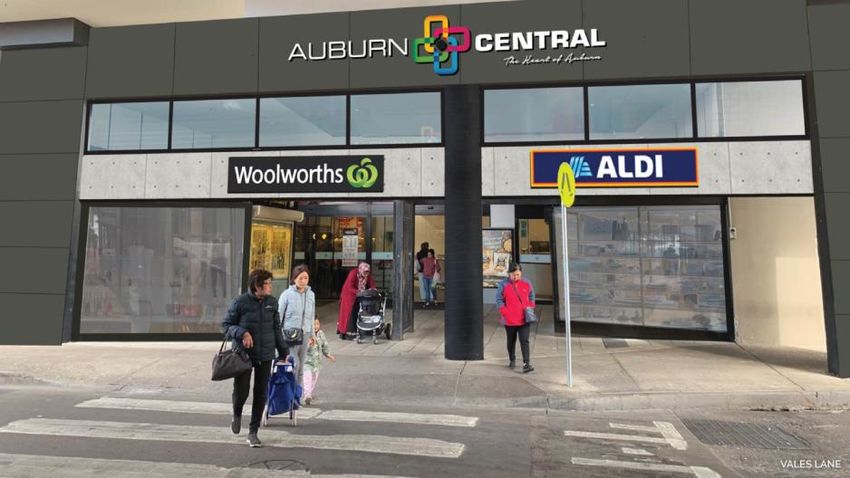
Fund Strategy and Investment Approach

                                                            Deliver high risk-adjusted
Strategic                                        returns from repositioning and/or unlocking the
Objective                                   real estate potential of investment grade retail properties
                                                            with high strategic value

                            Provide superior investment management to deliver on strategic objective

Investment
                      Invest                       Active Asset                    Strategic                  Capital
and Asset                                          Management                     Value Add                 Management
              Invest in retail properties
Management       that provide strong
                                                 Implement active leasing     Implement development        Maintain a conservative
Approach     earnings from a diversified
                                                     and other asset              and repositioning          and efficient capital
               retail tenant mix with a
                                                management initiatives to       strategies across the      structure with a target
             focus on non-discretionary
                                                grow income and portfolio             portfolio           gearing range of between
             retailers and high strategic
                                                          value                                                 30% and 40%
                   real estate value

                                                                                                                         [7]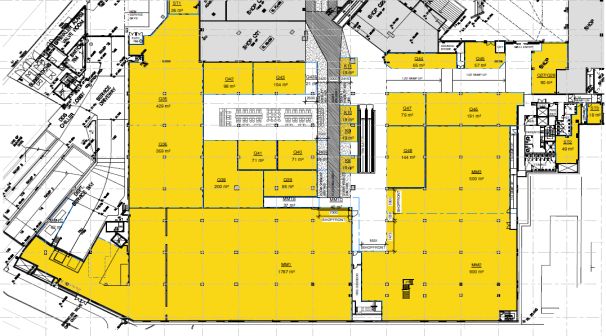
Execution – Divestment of Income Assets
Income Assets - Divestment Program

    Savills engaged to sell three assets

                  Sales campaign commenced

                                 EOI closing date 27th February 2020

                                                             Due Diligence & Exchange of Contracts

                                                                           Forecast Settlement

Dec-19        Jan-20        Feb-20         Mar-20       Apr-20         May-20       Jun-20       Jul-20      Aug-20

                   Dec-19 to Apr-20
                   Divestment of Moranbah Fair,
                   Manning Mall and Gladstone
                   Square

                                                                 March-20 to Aug-20
                                                                 Divest Northway Plaza and Glenorchy Plaza
                                                                                                                      [9]
Execution - Value-Add Retail Assets
Execution of Strategic Initiatives at Value-Add Assets
 ERF continues to reposition the retail tenant mix at the Value-Add assets away from underperforming DDS and discretionary retailers:
 • Tweed Mall: Aldi replaced Lincraft; Repositioning of Target Space in progress
 • Auburn Central: Aldi, Asian Grocer, food and retail services to replace Big W

                                   •   Transformation of Auburn Central into a Sydney metropolitan, dual supermarket, neighbourhood
                                       shopping centre by December 2020. Strong progress including :
    Auburn Central –                   − early surrender of BIG W lease
 Executing Repositioning               − Agreement For Lease with Aldi to anchor new retail precinct
        Strategy                       − strong leasing demand with negotiations well progressed with two mini-majors
                                       − significant positive rental reversion driving strong return on additional investment and valuation
                                         increase

                                   •   ALDI trading strongly with centre sales / foot traffic up 15.4% / 13.5% post opening in August 2019
     Tweed Mall –                  •   ALDI’s introduction has positively impacted the performance of supermarket anchors
  Retail Repositioning

                                   •   Mixed-use master planning well progressed
                                   •   Stage 1 DA submission planned for 2HFY20 linked to repositioning of the Target tenancy
     Tweed Mall –
                                   •   Active discussions with development / delivery partners for mixed-use opportunities
    Master Planning
                                   •   Increasing demand for commercial office / aged care in Tweed CBD

                                   •   Senior management capabilities across acquisition sourcing, asset management and development
                                       management to enable execution of ERF’s Value-Add retail asset investment strategy
 Management Capability             •   Executing tailored repositioning strategies for each asset

                                                                                                                                      [ 11 ]
Execution of Major Repositioning Initiatives
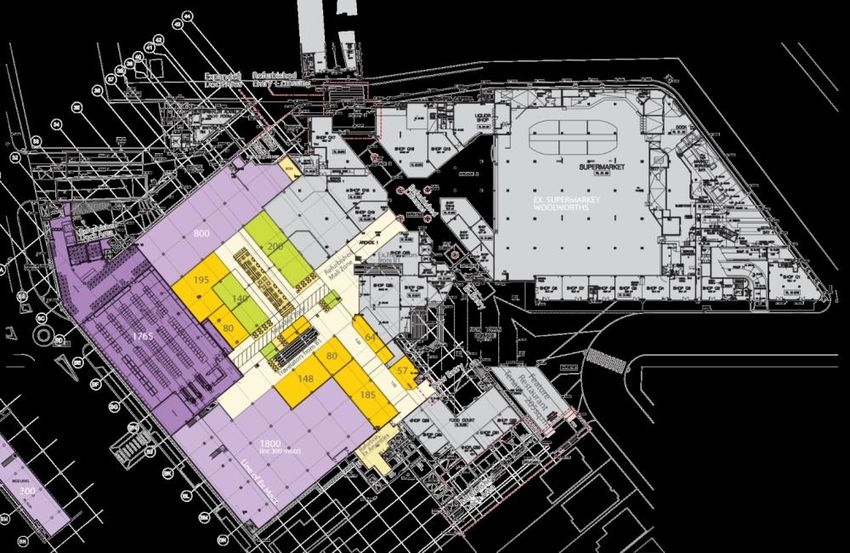
Auburn Central – Repositioning and Value Enhancement
• Transformation of Auburn Central into a Sydney
metro dual-supermarket anchored
neighbourhood centre is well progressed
• BIG W surrender payment covers of Big W rental
downtime during repositioning works
• Agreement For Lease with Aldi executed for a
new 1,755 square metre supermarket, secured Ex BIG W
by a 15-year lease with 2 x 5 year options Tenancy Adjoining site
• Aldi to commence trading in November 2020
anchoring the new retail precinct
• Repositioning project forecast to generate in
excess of 10% yield on cost: $2m+ incremental Indicative Repositioning Plan
NOI / $20m development costs
• Negotiations well progressed with two mini- Food Retail Retail
Amenities
upgrade
Services
majors
• Strong leasing demand for Food Retail and Retail Asian
Services Grocer
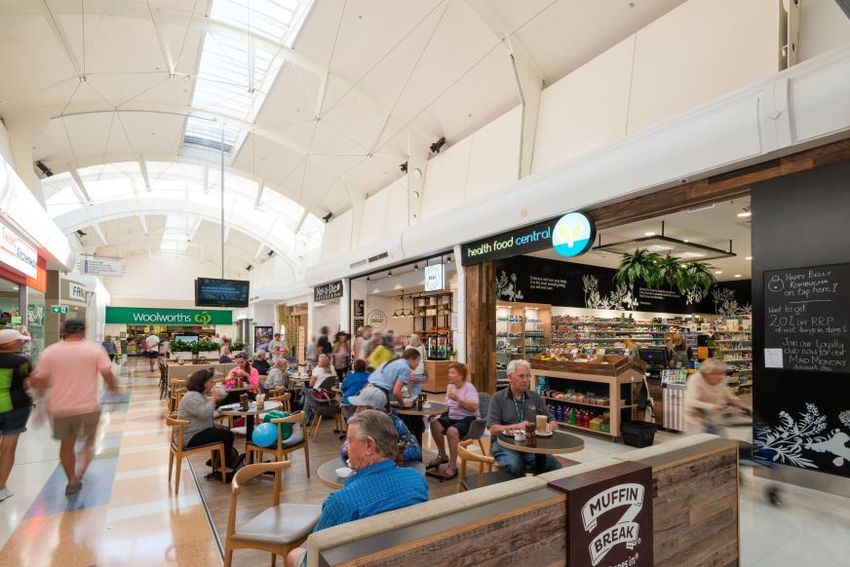
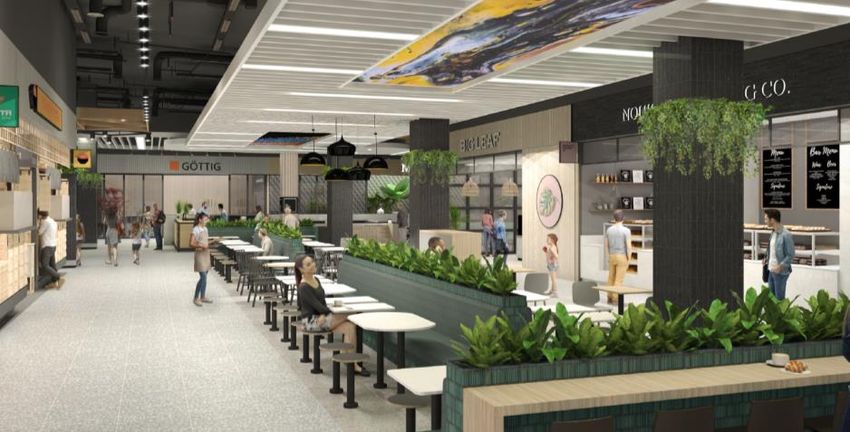
[ 12 ]Execution of Major Repositioning Initiatives (cont’d)
[ 13 ]Execution of Major Repositioning Initiatives (cont’d)
Tweed Mall – Aldi
• ALDI commenced trading under a 15 year lease in August 2019
• Significant increase in centre sales / foot traffic of 15.4% / 13.5% since Aldi opening
• ALDI’s introduction anchored the remix strategy for the northern mall, attracting non-discretionary food and
services retailers and continues to generate strong specialty leasing interest
[ 14 ]Portfolio Overview
Strong Operational and Strategic Upside

                                                                                         FY20 Progress /     Short Term       Medium Term
                                                                                             Status
ERF’s Portfolio is currently valued at $334.9m
As at 31 December 2019, the Portfolio comprises seven high investment quality retail shopping centre assets
valued at $334.9m
PORTFOLIO BY VALUE1 PORTFOLIO BY LETTABLE AREA1
Moranbah Moranbah
Fair Fair
Gladstone Auburn
Square 27.6 Gladstone 7,044 Central
Auburn Square
Central 15,433
30.2 6,899
102.3
Northway
Plaza Northway
16.2
Plaza 4,045
Glenorchy
17.8 $334.9m 76,171 sqm
Plaza
Glenorchy 8,727
Plaza
38.2
Manning 23,263
Mall Tweed
10,761 Mall
102.6
Manning
Tweed Mall
Mall
1. Excluding Auburn Ambulance Station [ 17 ]Portfolio Snapshot
Number of Lettable Area WALE
Type of Shopping Centre Centres Valuation ($m)1 Cap Rate (sqm) Occupancy2 (Income)3
Sub-Regional 4 260.9 6.4% 58,183 97.6% 3.3yrs
Neighbourhood 3 74.0 7.8% 17,988 96.8% 5.3yrs
Total 7 334.9 6.73% 76,171 97.4% 3.8yrs
GEOGRAPHIC DIVERSIFICATION4 TENANT MIX BY TYPE5 KEY TENANTS6
TAS Other (2%)
Woolworths
5%
13%
Specialties
QLD 22%
31% 12% Coles
73% NSW
Other 59% 6% Target
64% Tenants
Mini 5%
Major
Major BIG W
(3%)
Supa IGA
ALDI (3%)
(2%)
1. Excluding Auburn Ambulance Station
2. By Lettable Area and includes the impact of Rental Guarantees.
3. Includes Auburn Central BIG W early lease surrender
4. By asset value
5. By lettable area, excluding Auburn BIG W tenancy
6. By base rent, excluding Auburn BIG W tenancy [ 18 ]Assets Summary
ERF has a Portfolio of seven high investment quality retail shopping centre assets
Value1 Lettable Area Base Rent WALE WALE No. of No. of
Property Name Centre Type State Cap Rate Occupancy2
($m) (sqm) ($m) (by Area) (by Base Rent) Tenants5 Tenancies
Auburn Central Sub-Regional NSW 102.3 6.00% 15,433 6.8 99.9% 1.8yrs4 2.7yrs4 51 53
Tweed Mall Sub-Regional NSW 102.6 6.50% 23,263 7.5 97.6% 3.5yrs 3.4yrs 67 77
Manning Mall Sub-Regional NSW 38.2 6.88% 10,761 3.7 93.2% 3.6yrs 3.9yrs 29 38
Glenorchy Plaza Sub-Regional TAS 17.8 7.63% 8,727 1.9 98.7% 4.5yrs 3.7yrs 15 16
Northway Plaza Neighbourhood QLD 16.2 8.00% 4,045 1.5 96.2% 1.7yrs 1.7yrs 11 13
Gladstone Square Neighbourhood QLD 30.2 7.50% 6,899 2.6 95.9%3 8.5yrs 7.6yrs 22 33
Moranbah Fair Neighbourhood QLD 27.6 8.00% 7,044 2.5 98.1% 5.3yrs 5.0yrs 23 27
Total 334.9 6.74% 76,171 26.4 97.4% 3.8yrs 3.8yrs 218 257
1. Excluding Auburn Ambulance Station
2. By Lettable Area and includes the impact of Rental Guarantees. Occupancy excluding Rental Guarantees for the Portfolio and Gladstone Square is 96.7% and 88.8% respectively
3. Rental Guarantees valued at $0.4m in place to provide income on nominated vacancies until June 2021 for Gladstone Square
4. Includes Auburn Central BIG W early lease surrender
5. Includes Majors, Mini-Majors, Discount Department Stores, Specialties and Other (Kiosks, ATMs, Carwashes, Offices, Roof top leases to telecommunication providers)
[ 19 ]Portfolio Valuation Movements
Value Dec-19 Value Jun-19
Property Name Centre Type Valuation Valuation
($m) ($m)
Auburn Central Sub-Regional Internal 102.3 Independent 101.5
Tweed Mall Sub-Regional Internal 102.6 Internal 101.3
Manning Mall Sub-Regional Internal 38.2 Internal 38.2
Glenorchy Plaza Sub-Regional Internal 17.8 Internal 18.3
Northway Plaza Neighbourhood Internal 16.2 Internal 16.2
Gladstone Square Neighbourhood Internal 30.2 Internal 30.2
Moranbah Fair Neighbourhood Internal 27.6 Internal 26.3
Total 334.9 332.0
Auburn Ambulance Station¹ 2.5 2.5
Investment Property Carrying Value 337.4 334.5
1. Acquired to provide flexibility for Auburn Central repositioning strategy
[ 20 ]ERF Portfolio Capitalisation Rates
ERF Weighted Average Portfolio Capitalisation Rate is higher than the Sub-Regional and
Neighbourhood shopping centre market and peers
8.50%
8.00%
7.50%
7.00%
ERF: 6.7% (Jun-19) ERF: 6.7%
6.50% SCP: 6.5%
6.00%
CQR: 6.2% (Jun-19)
5.50%
VCX: 5.3% (Jun-19)
5.00%
Jun-13 Dec-13 Jun-14 Dec-14 Jun-15 Dec-15 Jun-16 Dec-16 Jun-17 Dec-17 Jun-18 Dec-18 Jun-19 Dec-19
Neighbourhood Sub-Regional
Source: Colliers Research and ASX
[ 21 ]ERF: Strong and Secure Rental Income
• Portfolio of seven high investment quality retail shopping centre assets anchored by quality national
tenants and supported by long term lease covenants from major corporations including Woolworths
Limited, Wesfarmers Group and ALDI
• Majors occupy 64% of occupied lettable area and contribute 40% of base rental income1
TENANT MIX BY TYPE TOP 10 TENANTS BY INCOME
Other Other
2% 3% Woolworths 13%
Specialty Coles 12%
31%
Target 6%
Specialty
53%
Mini Major Big W 5%
3%
Cornett's Supa IGA 3%
Amcal Chemist 2%
Mini Major
4%
Major ALDI 1%
64%
Sunshine Fruit 1%
Major
40%
The Reject Shop 1%
Auburn Central Pharmacy 1%
Lettable Area Income
1. Excluding Auburn BIG W tenancy [ 22 ]ERF: Strong and Secure Rental Income (cont’d)
• 62% of the Portfolio’s income is secured by non-discretionary retailers with a long lease expiry profile
• Portfolio is 97.4% occupied1 with a WALE of 3.8 years by lettable area and 3.8 years by base rental income
LEASE EXPIRY2 NON-DISCRETIONARY EXPOSURE2
50%
7%
DDS
10%
Discretionary
28%
44%
16%
15%
5%
6%
8%
5% 5%
2% 62%
3% 9% 11%
1% 1% 5%
3% 4%
1% Non-
Vacancy / FY20 FY21 FY22 FY23 FY24+ Discretionary
Holdover
Major / Mini Major Specialty Other Vacant Rental Guarantee
1. By Lettable Area and includes Rental Guarantees
2. By base rental income, excluding Auburn BIG W tenancy
[ 23 ]Retail Comparable Sales
Auburn Tweed Manning Glenorchy Northway Gladstone Moranbah
Central Mall Mall Plaza Plaza Square Fair
1
Annual Retail Sales ($m) 91.3 111.6 65.1 19.2 23.2 43.2 54.2
Centre Sales ($ / sqm p.a) 6,525 6,338 7,510 2,730 8,525 7,838 11,734
Supermarket Sales ($ / sqm p.a) 14,354 9,033 12,776 n/a 8,205 10,039 13,033
YoY change (%) 2.5% 2.1% 2.5% n/a 0.5% 7.0% 8.2%
Specialty Sales1 ($psqm / p.a) 7,952 5,625 10,768 n/a2 n/a2 7,092 n/a2
YoY change (%) 5.3% 1.9% (3.2%) n/a2 n/a 2 3.0% n/a 2
Specialty Occupancy Cost1 14.0% 12.3% 8.7% n/a2 n/a2 11.4% n/a2
Note: Analysis is limited to retailers who have traded and consistently reported sales for the 24 months ended 31 December 2019
1. Excludes non retail categories of Travel Agents, Post Offices, Gyms, Medical / Veterinary and Offices
2. Insufficient specialty retailer sales data
[ 24 ]1HFY20 Financial Results
Profit and Loss

                                                    1HFY20
Income
                                                      $’000
                                                              •   Statutory net profit of $6.0m for the six months
                                                                  ended 31 December 2019
Rental income                                       16,590
Interest income                                           3   •   Core Earnings of $7.1m or 5.52 cents per security
Total income                                        16,593
                                                              •   Distribution of 5.24 cents per security (representing
                                                                  95% of Core Earnings)
Expenses
Rates, taxes and other outgoings                      4,925   •   Result includes BIG W lease surrender fee at
Borrowing costs                                       2,921       Auburn and accrued performance fee to the
Investment management fees                            1,788       Manager (relating to the period from listing in
Other expenses                                         742        November 2016 to 31 December 2019)
Net fair value decrement on investment properties      246
Total expenses                                      10,622
Net profit                                            5,971

Reconciliation to Core Earnings
Net profit                                            5,971
Net fair value adjustments and transaction costs       246
Straight lining of rental income                       200
Amortisation expense                                   687
Core Earnings                                        7,104

                                                                                                                    [ 26 ]
Balance Sheet
Balance Sheet as at 31 December 2019 $’000 • Net tangible asset value per security of $1.54 at 31
December 2019
Assets
Cash 4,454 • Interest bearing debt less cash of $133.7m at 31
December 2019
Receivables 2,626
Other assets 442
• Gearing ratio of 39.3%
Investment properties 337,386
Total assets 344,908
Liabilities
Payables 4,314
Rent received in advance 761
Interest bearing liabilities 138,191
Derivative financial instruments 3,276
Total liabilities 146,542
Net assets 198,366
Number of securities (‘000) 128,730
NAV per security $1.54
NTA per security $1.54
Gearing (ND / TA less cash) 39.3%
[ 27 ]Debt and Capital Management
31 December 2019 • Gearing of 39.3% is within ERF’s target gearing range
Facility limit ($m) 138.4
• Weighted average cost of debt is approximately 3.96% p.a.
Drawn debt (net of cash) ($m) 133.7
The weighted average term to maturity of the Fund’s debt is
Gearing 39.3% 2.3 years
% debt fixed or hedged 78.6%
Weighted average cost of debt (p.a.) 3.96%
• Debt is 78.6% hedged
Average debt facility maturity (years) 2.3 – Target range for fixed interest rate exposure of
between 70% and 100% of drawn debt
Average swap / hedge maturity (years) 1.2
Interest cover ratio 3.71x – Average swap / hedge maturity is 1.2 years
• Key Covenants
Drawn Debt Maturity Profile ($m)
– Loan-to-value ratio (LVR)1 ≤ 50%
50
45
– Interest Cover Ratio (ICR)2 ≥ 2.00x, assessed semi-
40 annually
35
30
25
20
15
10
5
0
FY20 FY21 FY22 FY23 FY24
1. LVR is calculated as drawn debt divided by the value of the Portfolio
2. ICR is calculated as net rental income from the properties in the Portfolio divided by interest expense
[ 28 ]Strategy and Outlook
Strategy and Outlook

ERF is well positioned to enhance value for security holders

• Divestment of Income Assets is expected to realise carrying value
• Execution of strategic and repositioning initiatives at the Fund’s Value-Add Assets is
    progressing well

Growth

• Post the divestment of the Fund’s Income Assets, ERF will be in a position to acquire up to
    $100m of additional Value-Add assets based on a 35% gearing ratio
• ERF will consider capital management initiatives, including buy-backs, as part of positioning
    the Fund for growth and future capital raisings

                                                                                            [ 30 ]
Disclaimer
This presentation has been authorised for release by the Elanor Funds Management Limited Board of Directors.
This presentation has been prepared by Elanor Funds Management Limited As Responsible Entity For Elanor Retail Property Fund I (ARSN 615 291 220) and Elanor Funds
Management Limited As Responsible Entity For Elanor Retail Property Fund II (ARSN 615 291 284), collectively Elanor Retail Property Fund (‘ERF’ or ‘the Fund’).
This presentation contains selected summary information relating to the consolidated financial report for ERF for the year ended 31 December 2019 (“Fund’s Results”) and
does not purport to be all-inclusive or to contain all of the information that may be relevant to any particular investor or which a prospective investor may require in
evaluations for a possible investment in the Fund. It should be read in conjunction with the Fund’s continuous disclosure announcements lodged with the Australian
Securities Exchange including the Fund’s Results, which are available at www.asx.com.au. The recipient acknowledges that circumstances may change and that this
presentation may become outdated as a result. This presentation and the information in it are subject to change without notice and the Fund is not obliged to update this
presentation.
This presentation is provided for general information purposes only. It is not a product disclosure statement, prospectus or any other disclosure document for the purposes
of the Corporations Act and has not been, and is not required to be, lodged with the Australian Securities & Investments Commission. It should not be relied upon by the
recipient in considering the merits of the Fund or the acquisition of securities in the Fund. Nothing in this presentation constitutes investment, legal, tax, accounting or other
advice and it is not to be relied upon in substitution for the recipient’s own exercise of independent judgment with regard to the operations, financial condition and
prospects of the Fund. The information contained in this presentation does not constitute financial product advice. Before making an investment decision, the recipient
should consider its own financial situation, objectives and needs, and conduct its own independent investigation and assessment of the contents of this presentation,
including obtaining investment, legal, tax, accounting and such other advice as it considers necessary or appropriate. This presentation has been prepared without taking
account of any person’s individual investment objectives, financial situation or particular needs. It is not an invitation or offer to buy or sell, or a solicitation to invest in or
refrain from investing in, securities in the Fund or any other investment product.
The information in this presentation has been obtained from and based on sources believed by the Fund to be reliable. To the maximum extent permitted by law, the Fund
and its other affiliates and their respective directors, officers, employees, consultants and agents make no representation or warranty, express or implied, as to the accuracy,
completeness, timeliness or reliability of the contents of this presentation. To the maximum extent permitted by law, no member of the Fund accepts any liability (including,
without limitation, any liability arising from fault or negligence on the part of any of them) for any loss whatsoever arising from the use of this presentation or its contents or
otherwise arising in connection with it.
All dollar values are in Australian dollars ($A or AUD) unless stated otherwise.
This presentation may contain forward-looking statements, guidance, forecasts, estimates , prospects, projections or statements in relation to future matters (‘Forward
Statements’). Forward Statements can generally be identified by the use of forward looking words such as “anticipate”, “estimates”, “will”, “should”, “could”, “may”,
“expects”, “plans”, “forecast”, “target” or similar expressions in this presentation. Forward Statements including indications, guidance or outlook on future revenues,
distributions or financial position and performance or return or growth in underlying investments are provided as a general guide only and should not be relied upon as an
indication or guarantee of future performance. No independent third party has reviewed the reasonableness of any such statements or assumptions. No member of the Fund
represents or warrants that such Forward Statements will be achieved or will prove to be correct or gives any warranty, express or implied, as to the accuracy, completeness,
likelihood of achievement or reasonableness of any Forward Statement contained in this presentation. Except as required by law or regulation, the Fund assumes no
obligation to release updates or revisions to Forward Statements to reflect any changes.
[ 31 ]You can also read