Waste Reduction In Barwon Dining Chair Production Process Using The Failure Mode And Effect Analysis (FMEA) Method on CV. Valasindo Sentra Usaha
←
→
Page content transcription
If your browser does not render page correctly, please read the page content below
Applied Research in Science and Technology
Vol. 01 No. 01, May 2021 (01-11)
ISSN (Print)    : 2776-7213
ISSN (Online) : 2776-7205

Waste Reduction In Barwon Dining Chair Production Process
   Using The Failure Mode And Effect Analysis (FMEA)
         Method on CV. Valasindo Sentra Usaha
Bambang Suhardi1, Femilia Setya Puji Hastuti1, Wakhid Ahmad Jauhari2 Pringgo
                              widyo Laksono1,2*
      1
       Department of Industrial Engineering, Sebelas Maret University, Indonesia
              2
                Graduate School of Engineering, Gifu University, Japan
                             *Email: pringgo@ft.uns.ac.id

    Received: 10 March 2021; Revised:29 March 2021; Accepted: 29 March 2021

     Abstract: The furniture industry has a vital role in economic growth in
     Indonesia by one of the activities that are international trade. During the last
     year, the export value of the furniture industry has increased. It can make an
     increase of industrial competition in the global market. Therefore,
     production efficiency needs to be improved under the four pillars that affect
     global market competitiveness. This study focuses on the Barwon Dining
     Chair sub-product because it has the most and constant demand with an
     average demand is 57 units per month while the company experiences delay
     until 88% with an average delay of 14 days. Determination of Value Added
     (VA), Non-Value Added (NVA), and Necessary Non-Value Added are used
     to describe the current Value Stream Mapping (VSM) as an explanation of
     the production process flow. Failure and Effect Analysis (FMEA) is used to
     identify a system with the risk of failure and its consequences by giving
     values from severity, occurrence, and detectability and generating the
     largest number of RPN assembly stations at 45. The improvements are
     warehouse rack design and the box at the assembly station, reducing the
     time to approximately 2 minutes.

     Keywords: Lean manufacturing; Value stream mapping (VSM); Pareto
     diagram; Failure and effect analysis (FMEA)

How to Cite: Suhardi, B., Hastuti, F. S. P., Jauhari W. A., & Laksono, P.
W. (2021). Waste Reduction In Barwon Dining Chair Production Process
Using The Failure Mode And Effect Analysis (FMEA) Method on CV.
Valasindo Sentra Usah. Applied Research in Scince and Technology,
1(1), 01-10.

                                  INTRODUCTION

The furniture industry is one industry that has an important role in Indonesia's economic
growth. The activities carried out by the furniture industry are not only national trade
but also international trade including export and import activities. Based on the data
from Badan Pusat Statistik (BPS, 2019), the value of furniture industry exports

https://areste.org/index.php/oai
Research and Social Study Institute                                                Page 1
Applied Research in Science and Technology
Vol. 01 No. 01, May 2021 (01-11)
ISSN (Print)    : 2776-7213
ISSN (Online) : 2776-7205

increased by 4.63% from January 2018 to January 2019. The increase in export value is
accompanied by increasing competition in the furniture industry in the global market.
Competitors from the Indonesian furniture industry come from China, Mexico, Poland,
Malaysia, Thailand, the Philippines, Brazil, and other countries (International Trade
Centre, 2004). According to Indonesian Furniture and Handicraft Association (Asosiasi
Mebel dan Kerajinan Indonesia, 2015), four pillars determine the competitiveness of
Indonesian furniture exports, they are raw materials, production processes, design and
innovation, and marketing. Regarding the pillars of the production process, one of the
influencing factors is the efficiency of the production process. Therefore, to win the
competition from these countries, the Indonesian furniture industry must make
improvements starting from company performance, product quality, product prices, and
on-time deliveries.
       CV. Valasindo Sentra Usaha is one of the furniture industries located on Jalan
Raya Solo-Purwodadi Km 8.5, Mundu, Selokaton, Gondangrejo, Karanganyar Regency,
Central Java. The products include chair furniture, shelves, beds, sofas, and tables. The
company is oriented towards export activities to several companies abroad, such as
Singapore, Malaysia, Taiwan, Sweden, Mexico, Australia, and the United States. The
export activity requires companies to continuously improve performance, production,
and service to consumers so that companies can compete in the global market. Some
export products produced by CV. Valasindo Sentra Usaha includes Dupuis, Globe
West, Teak Scan, Eco Outdoor, Mass Studio, and Fiber. Products that are often ordered
among the six products are Eco Outdoor and Scan Teak.
       This study focused on Eco Outdoor products because Eco Outdoor products have
a constant demand. Eco Outdoor products have several sub-products, including Jan Juc,
AYR, Bronte, Nullica, Lennox, Lennox Special Order, Barwon, Zuma, Mill, Turon,
Claybourne, Nomah, Albany, Waratah, and Marsden. The sub-product with the most
and constant demand for the past year is Barwon Dining Chair, with an average monthly
demand is 57 units. Therefore, this study focuses on the sub-product Barwon Dining
Chair. The large and constant demand should also be followed by optimal company
performance. However, based on the past year's data, these sub-products often delay
until 88%, with an average delay of 14 days. If these conditions continued, consumers
would trust in the performance of the CV. Valasindo Sentra Usaha will decrease. This
delay in shipping because of waste in the production process at CV. Valasindo Sentra
Usaha. Therefore, further research is needed to identify the causal factors of waste
production time, which results in delays in shipping which are included in the seven
waste concepts.
       Lean manufacturing learns about the workflow started from product design until
consumers accept the product without any returns caused by defects or waste (Muhsin et
al., 2018). Lean manufacturing is a management philosophy derived from the Toyota
Production System (TPS) that focuses on eliminating seven wastes to increase customer
satisfaction (Ariani, 2004). Implementing lean manufacturing in the furniture industry is
used to reduce waste on the production floor, which results in late delivery (Suhardi et
al., 2016). Based on the research conducted by Alfiansyah & Kurniati (2018), the steps
taken in Lean Manufacturing are to identify all waste and the root of the problem then
make improvements to the design of the production process. The concept can be applied
in the CV. Valasindo Sentra Usaha to reduce the delay in delivering Barwon Dining
Chair sub-products, such as the research conducted by Siregar & Ayu (2018) that

https://areste.org/index.php/oai
Research and Social Study Institute                                               Page 2
Applied Research in Science and Technology
Vol. 01 No. 01, May 2021 (01-11)
ISSN (Print)    : 2776-7213
ISSN (Online) : 2776-7205

implement Lean to overcome delays in shipping milk products. The factors that cause
delays are included in the Seven Waste Concept identified in the theory of the Toyota
Production System. The theory identifies the types of Seven Waste in the manufacturing
or service processes, namely overproduction, waiting, transportation, excess process,
inventory, motion, and defects. Based on the previous research by Harish & Selvam
(2015), reducing waste that occurs in the production process begins with understanding
the types of waste and the causes of waste because each waste has a different solution.
      Based on the research of Chen & Meng (2010), a company needs to implement
lean production with value stream mapping (VSM) to identify the overall flow of the
supply chain. VSM shows the flow of information needed to plan and meet customer
demand. VSM consists of cycle time, inventory held, changeover times, and staffing to
eliminate existing waste (Wilson, 2010). Besides, this research also applied methods to
identify and understand the potential causes and effects of a failure, assess the risk of
failure, and carry out corrective actions called the Failure Mode and Effects Analysis
(FMEA) method (Carlson, 2014). Parsana & Patel (2014), research provides an
effective tool used to solve quality problems in the manufacturing process by applying
the FMEA method to reduce losses for companies in terms of time and cost. Thus, the
application of this method is expected to minimize the risk of failure that will arise
during the production process.

                                       METHOD

This research begins with a literature review of several journals and field studies at CV.
Valasindo Sentra Usaha with direct observation and interviewing workers on the
production floor. Data collection is used to obtain primary and secondary data. The data
are obtained from observation on the production floor, take pictures and videos with
cameras, interview, fill the waste-weighting questionnaire with employees, and discuss
with related parties in the CV. Valasindo Sentra Usaha. Data retrieval with videos is
done with a sample of 30 times (Suhardi et al., 2019). The sample testing of uniformity
and data adequacy proceed with determining activities included in Value-Added
activities, Non-Value Added activities, and Necessary Non-Value Added activities that
are used as inputs for the current VSM. The determination of activities is carried out by
brainstorming with the company.
      Station determination is done by using a Pareto diagram with the input of standard
time data included in non-value added activities during the production process from the
construction station to the packaging station. The determination of stations with Pareto
diagrams gives the results of NVA stations with the largest is assembly station. The
dominant waste identifies the station for repairs. Waste identification is carried out by
giving questionnaires to the relevant parties in the selected station (Intifada & Witantyo.
2012) and processing the questionnaire results using the Borda method (Setiawan,
2017).
      Failure and Effect Analysis (FMEA) is a technique used to analyze risk by
identifying systems/facilities/tools that can fail and the effects of failures (Gasperz,
2002). Proposed improvements are given based on the analysis results using FMEA
with the highest qualification of the RPN on each selected workstation. Improvements
are made at selected stations in the form of warehouse rack design and VSM futures

https://areste.org/index.php/oai
Research and Social Study Institute                                                Page 3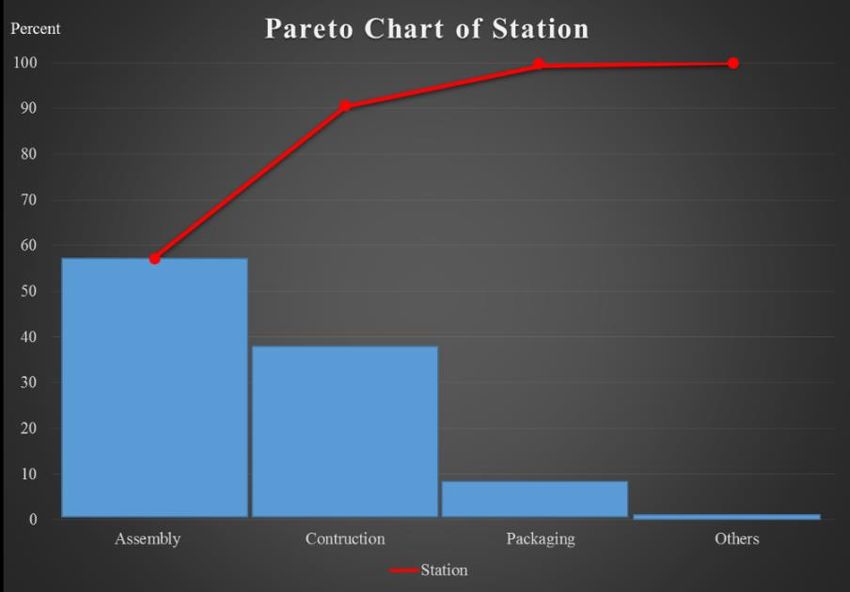
Applied Research in Science and Technology
Vol. 01 No. 01, May 2021 (01-11)
ISSN (Print)    : 2776-7213
ISSN (Online) : 2776-7205

depiction box used for the implementation of the proposed plan that had been given to
optimizing the production process of the Barwon Dining Chair sub-product.

                          RESULTS AND DISCUSSION

Current VSM:
VSM Current is a description of the production process from beginning to end,
consisting of material and information flow in a company (Gasperz, 2002).

                               Figure 1. Current VSM

      The Barwon Dining Chair production process starts from the construction,
assembly, finishing 1, weaving, finishing 2, and ends at the packaging station.
      Production: 1 unit
      Total cycle time: 415 minutes
      Total value-added time: 337 minutes
      Current VSM shows that the time of the activities with non-value-added (NVA)
and necessary but non-value-added (NNVA) is still large enough. Therefore, it is
necessary to reduce production time. Activities that need to be reduced are NVA
activities (Eswaramurthi & Mohanram, 2013).
      Current VSM shows that the time of the activities with non-value-added (NVA)
and necessary but non-value-added (NNVA) is still large enough. Therefore, efforts are
needed to reduce production time. Activities that need to be immediately reduced are
NVA activities (Eswaramurthi & Mohanram, 2013). The amount of NVA is done by
processing data with a Pareto diagram to determine the selected station. Based on
Figure 2, the chosen station is the assembly station.

https://areste.org/index.php/oai
Research and Social Study Institute                                            Page 4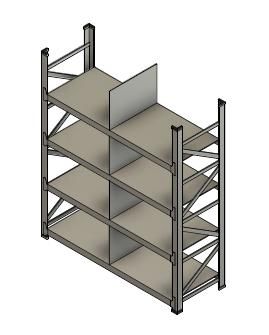
Applied Research in Science and Technology
Vol. 01 No. 01, May 2021 (01-11)
ISSN (Print)    : 2776-7213
ISSN (Online) : 2776-7205

                             Figure 2. Pareto Chart of NVA

      Based on Figure 2, processing NVA data with the largest NVA is obtained at the
Assembly station. To find out the type of waste in the station: the weighting of the
waste type is carried out at the station related to the questionnaires to parties related to
the station. Borda method is used to process data from questionnaires distributed with
the results shown in table 2 for assembly stations. Borda method is chosen for decision
making from the professional results of each decision-maker (Arliana & Soebroto,
2018).

Weight calculation of waste overproduction at the assembly station is shown below:
              ∑

   Percentage calculation of waste overproduction at the assembly station is shown
below :

              Table 1. Processing of Waste Questionnaire at Assembly Station
                                        Rank
      Waste           1      2      3          4    5       6     Weighting     Percentage
                      0      1      2          3    4       5
 Overproduction       0      3      2          0    0       0          7             9
    Defects           0      0      1          1    3       0         17            22
   Inventory          0      2      0          3    0       0         11            14
 Overprocessing       0      4      0          1    0       0          7             9
 Transportation       0      2      1          2    0       0         10            13

https://areste.org/index.php/oai
Research and Social Study Institute                                                 Page 5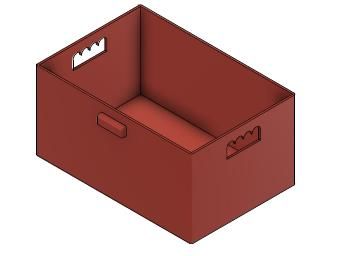
Applied Research in Science and Technology
Vol. 01 No. 01, May 2021 (01-11)
ISSN (Print)    : 2776-7213
ISSN (Online) : 2776-7205

     Waiting            0         2            1        0        1          1             13                17
     Motion             0         1            1        3        0          0             12                16

       Based on the weighting results, the waste results obtained from assembly stations
are waste defects with a percentage of 22%. Thus, it is necessary to identify the causes
of failure that result in waste defects using the FMEA method (Puspitasari & Martanto,
2014). FMEA is a method used to find out the causes of waste and determine the critical
level of waste, which is shown in the form of calculation of Risk Priority Number. RPN
is obtained by multiplying the rating from Severity, Occurrence, and Detection. The
value of Severity, Occurrence and Detection is based on discussions with parties at
assembly stations. The RPN value from the waste defect of the assembly station is
shown in table 2 based on Ratri et al., (2018) and Ririh et al., (2018).

      Example of RPN Calculation on Man Factor with failure mode of Operator is
incorrect when he took a part is shown below:

                            Table 2. The Value of RPN Waste Defect

      Factor of                        Failure      Severity   Occurrence       Recommended      Detectability
No                   Failure                                                                                     RPN
       Failure                         Mode          Value       Value             action           Value

                                                                                Improvement of
                                          The                                      warehouse
                                      operator is                                 system with
                   The size is         incorrect       5             9           box and label        1          45
                   not suitable        when he                                     design per
1       Man         during the        took a part                                   product
                    assembly                                                      components
                     process

                                         The
                                       operator                                  Training for
                                                       1             3                                2           6
                                       has less                                   operators
                                        skilled

                                                                                 Improvement
                     Mixed        Warehouse                                        design of
2    Environment                                       4             7                                1          28
                   Components      is mess                                        warehouse
                                                                                    system

https://areste.org/index.php/oai
Research and Social Study Institute                                                                         Page 6
Applied Research in Science and Technology
Vol. 01 No. 01, May 2021 (01-11)
ISSN (Print) : 2776-7213
ISSN (Online) : 2776-7205
There is no
The steps of
SOP for Make SOP’s
3 Method work are 3 6 2 36
making the product making
unclear
product
The mall is
Make a mal’s
4 Machine Misuse mall not 1 2 2 4
store
organized
Based on table 3, the largest RPN value at the assembly station is caused by the
man factor, and the failure is the size that is not suitable during the assembly process.
The failure mode is the operator who is incorrect when he took part from components
warehouse with the RPN value of 45, severity value of 5, and occurrence value of 9.
The recommended action in table 2 is an improvement warehouse system with box and
label design per product components with a detectability value of 1.
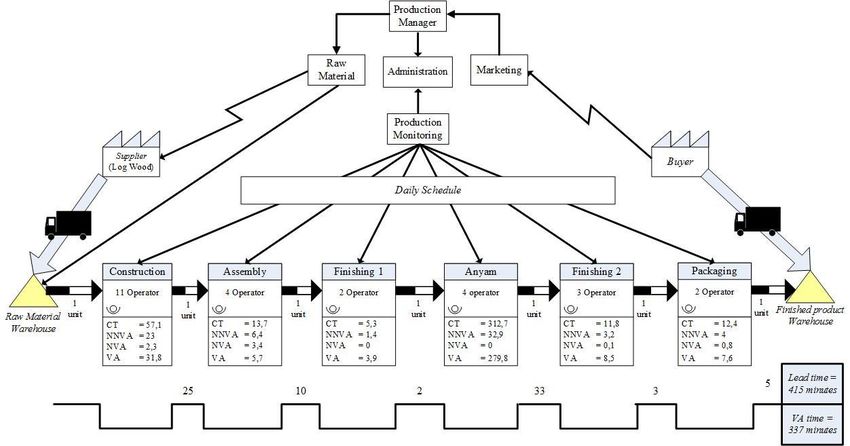
Recommended action
Recommended action for the waste defect at the assembly station is the design of the
warehouse rack and product box according to table 2. The visualization design of the
recommended action is shown in figure 3 to figure 6 which consists of the warehouse
rack and box design with dimension and information card (label) on the box per product
component. The following is an explanation of the recommended action:
Figure 3. Warehouse Design
These are explanations in determining the dimensions of the proposed
improvement given:
1. Box
The box is used to facilitate operators in transferring and storing the Barwon
Dining Chair sub-product. Besides, the box is used to avoid mixing between product
components with the box image shown in figure 4. The inside of the box has a length of
900 mm, which refers to the longest component size, namely the rear leg component
with a component length of 884 mm. The inside of the box has a height of 450 mm,
which refers to the thickest component size, namely the rear leg component with a
component thickness of 30 mm so that in one stack is arranged ± 15 components. While
https://areste.org/index.php/oai
Research and Social Study Institute Page 7Applied Research in Science and Technology
Vol. 01 No. 01, May 2021 (01-11)
ISSN (Print) : 2776-7213
ISSN (Online) : 2776-7205
the inside of the box has a width of 600 mm, which refers to the widest component size
multiplied by 2 for the right and left parts 464 mm so that it still has an allowance of
126 mm. The right and left sides have a hole to make it easier for the operator to lift the
box with a size 150 mm, which refers to the hand width anthropometry of 15.17 with
the 95th percentile.
Figure 4. Box Design
2. Label
This label serves to make it easier for operators to find components and reduce
errors in retrieving components according to the results of the weighting of VA, NVA,
and NNVA. The following is a breakdown of the proposed label to solve problems at
the assembly station (Noerfajr & Suliantoro 2016).
Figure 5. Detail of Information Card in Every Box
3. Component Shelves
The component shelf is used to store the Barwon Dining Chair components and it
has visually shown in Figure 6.
Figure 6. Warehouse Shelf Design
https://areste.org/index.php/oai
Research and Social Study Institute Page 8Applied Research in Science and Technology
Vol. 01 No. 01, May 2021 (01-11)
ISSN (Print) : 2776-7213
ISSN (Online) : 2776-7205
The height dimension of the warehouse shelf is 2300 mm that refers to the
anthropometric dimensions of the upward grip in a standing position using the 95th
percentile specification 2332 mm so that the shelf height is still in the 95 th percentile
specification. The dimension of the shelf width is 682 mm that refers to the box width
620 mm.
Future VSM
Future VSM describes the conditions resulting from the improvements that are applied
to the current VSM. Future VSM will become a new line in the Barwon Dining Chair
production after the wastes are eliminated. Lead-time material from construction station
to packaging station becomes faster, which is 413 minutes. Future VSM is shown in
Figure 7.
Figure 7. Future VSM
CONCLUSIONS
The production process of Barwon Dining Chair in the CV. Valasindo Sentra Usaha has
the dominant type of waste, namely waste defects in assembly stations. The factors of
the defect such as the Operator is incorrect when he took a part, the operator has less
skilled, there is no SOP for making the product, there is no SOP for operating the
machine, the mall is not organized, components are mixed, and the warehouse is a mess.
From the causes described by FMEA, the operator who is incorrect when he took a part
obtains the largest RPN value of 45. Therefore, it needs improvements. The solutions to
this problem are warehouse rack design and the box at the assembly station, which can
reduce the time to approximately 2 minutes.
ACKNOWLEDGMENT
This research is not supported by any organization.
https://areste.org/index.php/oai
Research and Social Study Institute Page 9Applied Research in Science and Technology
Vol. 01 No. 01, May 2021 (01-11)
ISSN (Print) : 2776-7213
ISSN (Online) : 2776-7205
REFERENCES
Alfiansyah, R & Kurniati, N. (2018). Identifikasi waste dengan metode waste
assessment model dalam penerapan lean manufacturing untuk perbaikan proses
produksi (studi kasus pada proses produksi sarung tangan). Jurnal Teknik ITS,
7(1), 165-170.
Ariani, D. W. (2004). Pengendalian kualitas statistik. Yogyakarta. Indonesia: ANDI
Yogyakarta.
Arliana, A. G., & Soebroto, A. A. (2018). Sistem pendukung keputusan kelompok
untuk penilaian kinerja unit perusahaan menggunakan metode topsis dan borda
(studi kasus : perum jasa tirta 1 malang). Jurnal Pengembangan Teknologi
Informasi dan Ilmu Komputer, 2(12), 7348-7356.
Asosiasi Mebel dan Kerajinan Indonesia (AMKRI). (2015). “Roadmap Industri Mebel
dan Kerajinan Indonesia “Target Pencapaian Ekspor 5 Milyar USD” dalam
Bunga Rampai Info Komoditas Furnitur”. Badan Pengkajian dan Pengembangan
Perdagangan. Jakarta. Indonesia
Badan Pusat Stastistik .(2019). “Buletin Perdagangan Luar Negeri Menurut Kelompok
Komoditi dan Negara Januari 2019”. BPS RI: CV. Josevindo. Indonesia.
Carlson, C. S. (2014). Understanding and applying the fundamentals of FMEAs.
Arizona: ReliaSoft Corporation.
Chen, L. & Meng, B. (2010). The application of value stream mapping based lean
production system. International Journal of Business and Management, 5(6), 203-
209.
Eswaramurthi, K. & Mohanram, P. V. (2013). Value And Non- Value Added
(VA/NVA) activities Analysis of An Inspection Process - A Case Study.
International Journal of Engineering Research & Technology, 2(2),1-5.
Gasperz, V. (2002). Total quality management. Jakarta. Indonesia: PT. Gramedia
Pustaka Utama.
Harish, K. A., & Selvam, M. (2015). Lean waste: a study classification from different
categories and industry perspectives. The Asian Review of Civil Engineering, 4(2),
7-12.
International Trade Centre (ITC). (2004). “International Wooden Furniture Markets”.
Geneva: International Tropical Timber Organization.
Intifada, G.S. & Witantyo. (2012). Minimasi waste (pemborosan) menggunakan value
stream analysis tool untuk meningkatkan efisiensi waktu produksi. (studi kasus
PT. Barata Indonesia, Gresik). Jurnal Teknik POMITS, 1(1), 1-6.
Muhsin, A., Djawoto., Susilo, P. & Muafi. (2018). Hospital performance improvement
through the hospital information system design. International Journal of Civil
Engineering and Technology, 9(1), 918-928.
Noerfajr, L. & Suliantoro, H. (2016). Usulan perancangan tata letak gudang dengan
menerapkan sistem management warehouse di PT. Sandang Asia Maju Abadi.
Industrial Engineering Online Journal, 5(4), 1-7
Puspitasari, N. B. & Martanto, A. (2014). Penggunaan FMEA dalam mengidentifikasi
resiko kegagalan proses produksi sarung atm (alat tenun mesin) (studi kasus PT.
Asaputex Jaya Tegal). J@ti Undip : Jurnal Teknik Industri, 9(2), 93-98.
https://areste.org/index.php/oai
Research and Social Study Institute Page 10Applied Research in Science and Technology
Vol. 01 No. 01, May 2021 (01-11)
ISSN (Print) : 2776-7213
ISSN (Online) : 2776-7205
Ratri, E. M., Gusminto, E. B., & Singgih, M. (2018). Peningkatan kualitas produk roti
manis pada PT. Indoroti Prima Cemerlang Jember berdasarkan metode statistical
process control (SPC) dan failure mode and effect analysisi (FMEA). E-Journal
Ekonomi Bisnis dan Akutansi, 5(1), 200-207.
Ririh, K.R., Sundari, A.S. & Wulandari, P. (2018). Analisis risiko pada area finishing
menggunakan metode failure mode effect and analysis (FMEA) di PT. Indokarlo
Perkasa. Seminar Rekayasa Teknologi Semrestek, 631-640.
Setiawan, A. (2017). Pengurangan waste proses produksi tiang penerangan jalan
umum pada CV. X dengan pendekatan value stream mapping. Institut Teknologi
Sepuluh Nopember. Surabaya. Indonesia
Siregar, M.Tirtana. & Pitaloka, N. W. A. (2018). Lean distribution untuk minimasi
keterlambatan pengiriman produk susu. Jurnal Manajemen Transportasi &
Logistik, 5(3), 265-276.
Suhardi, B., Anisa, Nur. & Laksono, P. W. (2019). Minimizing waste using lean
manufacturing and ECRS principle in indonesian furniture industry. Cogent
Engineering, 6, 1-13.
Suhardi, B., Sari, A.P. & Laksono, P.W. (2016). Implementation of standardization
work to improve productivity in indonesian furniture industry. Journal of
Engineering and Applied Sciences, 11(12), 2602-2606.
Parsana, T. S., & Panel, M. T. (2014). A case study: a process FMEA tool to enhance
quality and efficiency of manufacturing industry. Bonfring International Journal
of Industrial Engineering and Management Science, 4(3), 145-152.
Wilson, L. (2010). How Implementation Lean Manufacturing. New York: McGraw Hill.
https://areste.org/index.php/oai
Research and Social Study Institute Page 11You can also read