Lower-Darling Operations Plan - November 2018 - waternsw.com.au

Page created by Eugene Lewis
 
CONTINUE READING
Lower-Darling Operations Plan - November 2018 - waternsw.com.au
Lower-Darling
Operations
Plan
November 2018

                waternsw.com.au
Lower-Darling Operations Plan - November 2018 - waternsw.com.au
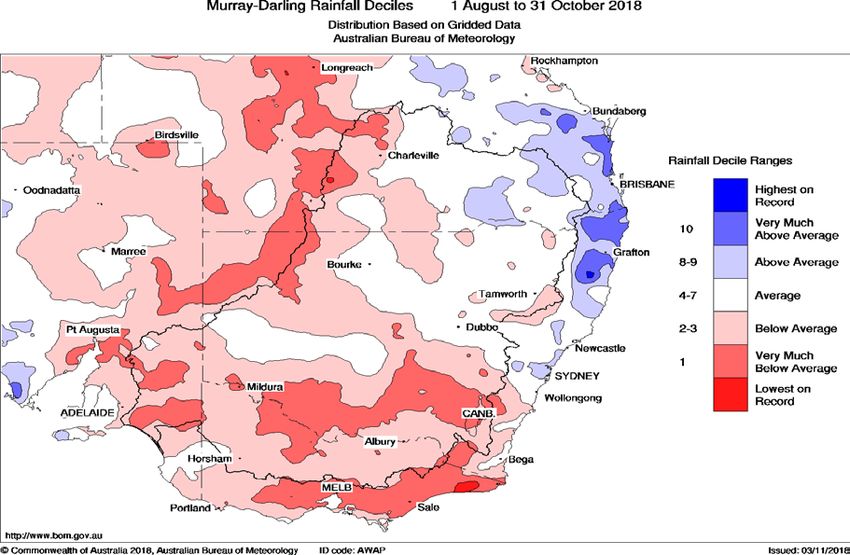
Contents

1.     Highlights ........................................................................................................................................................ 3

2.     Operational objectives................................................................................................................................. 4

3.     Operational rules........................................................................................................................................... 5

3.1    Water Sharing Plan (WSP) .................................................................................................................................. 5

3.2    Murray-Darling Basin agreement ..................................................................................................................... 6

4.     Customers ...................................................................................................................................................... 7

4.1    Domestic and stock ............................................................................................................................................ 7

4.2    Local water utility – Broken Hill, Pooncarrie .................................................................................................... 8

4.3    Regulated river (high security) .......................................................................................................................... 9

4.4    Regulated river (general security) ................................................................................................................. 10

5.     Drought management measures .............................................................................................................. 11

6.     Resources analysis ...................................................................................................................................... 13

7.     Operational strategy................................................................................................................................... 20

7.1    Drought strategy................................................................................................................................................ 22

7.2    Dry scenario (80th percentile inflows) ............................................................................................................ 24

7.3    Water quality ...................................................................................................................................................... 25

7.4    Key operational decisions and dates ........................................................................................................... 27

7.5    Key messages regarding drought measures ............................................................................................... 29

Lower-Darling Operations Plan – November 2018                                                                                                                        2
Lower-Darling Operations Plan - November 2018 - waternsw.com.au
1. Highlights

WaterNSW has developed the Lower-Darling Operations Plan to ensure water supplies for Broken Hill
and surrounding communities and reliable water supply to the customers along the Lower-Darling
can be maintained through a repeat of the worst drought of record. This plan is a living document
and will be updated regularly based on changing conditions.

Water is stored in Menindee Lakes to meet water needs including provision for water losses
(seepage and evaporation), maintaining the Lower-Darling environment supply for essential
requirements (e.g. town water supply, domestic and stock and basic land holder rights) and
General Security Licenses in the Lower-Darling and Lower Murray systems.

This plan looks to optimise water delivery through maximising releases from the lower storages
(Menindee and Cawndilla) and retaining water in the more efficient Upper Lakes (Wetherell and
Pamamaroo) until demands and outlet capacity constraints of the lower storages necessitates
releases from the upper lakes.

We have analysed the lowest inflow sequences and maximum evaporation rates for the region to
ensure operations of the lakes are optimised for supply through a repeat of the drought of record
and drier scenarios.

Lower-Darling Operations Plan – November 2018                                                   3
2. Operational objectives

The aim of the plan is to maximise the use of the resource to meet customer demands within the
Lower-Darling water source and to meet NSW and Victoria’s contribution to the Murray while
ensuring that essential water needs can be met through a repeat of the worst drought on record.
The plan also identifies the key actions required to extend supplies if inflows are lower than previous
droughts.

The plan therefore has been developed to ensure that critical water needs can be met, and the
environmental needs of the Lower-Darling river are maintained for as long as possible.

Key operational objectives
    •    Maintain supply to Broken Hill.
    •    Maintain a continual flow of water along the Lower-Darling (maintain flow at Burtundy)
         through a repeat of the lowest inflows on record.
    •    Maximise use of water in the lower Lakes to meet customer demands first.

The operations plan has considered three inflow scenarios that will guide operational decisions.
They provide assessment of a range of conditions that may occur in the coming 12-24 months.
    •    Scenario 1: Sahara – no inflow occurs at Wilcannia through to resource being exhausted;
    •    Scenario 2: Drought – minimum statistical inflow sequence on record - applied from Dec
         2018 – with resources managed to the next significant inflow; and
    •    Scenario 3: Dry scenario - 80th percentile inflow sequences applied from Dec 2018 to
         represent the likely no inflow scenario. The dry scenario considers an inflow sequence that
         could be expected to be exceeded 8 years out of 10 based on historical records.

We will continue to review the system operations forecast with the aim to implement drought
measures as the volume of water in the lakes reduce.

As there is no guarantee that the next drought will not be more severe than the last, the design
scenario is considered to be scenario 1, it is the worst-case, no inflow scenario.

Scenario 2 provides for a repeat of the worst inflow sequence; this scenario considers the measures
required to manage the systems water resources through a repeat of these conditions to provide
the best outcome possible.

Lower-Darling Operations Plan – November 2018                                                         4
Scenario 3 provides scope of the potential system operations in the event of some inflows, but
overall the system remains relatively dry, and what this would mean for river flows and town water
supplies.

Overall it is unlikely that the conditions presented in these scenarios will be repeated. Rather they
will be used to help inform customers and community about potential system operations over the
next 12 – 24 months and guide operational decisions as time progresses. Ultimately the decisions
made will be in response to the conditions that do occur.

3. Operational rules

3.1 Water Sharing Plan (WSP)

The WSP provides a framework for sharing of water resources within the Lower-Darling, aiming to
provide a balance between environmental, economic and social objectives. The plan establishes
a bulk access regime for the extraction of water under access licences providing for environmental
water rules or planned environmental water, water for basic landholder rights and extraction under
a number of access licence categories.

The WSP was originally gazetted in 2003 and as such the framework has been established based on
inflow sequences prior to this time. Since gazette of the plan, the minimum inflow sequence prior to
2003 has been exceeded (by lower inflows) on at least 2 occasions.

The WSP provides for licenced entitlements of:

    •    Domestic & stock
    •    Local water utility
    •    Regulated river (high security)
    •    Regulated river (general security)
    •    Supplementary – although all supplementary entitlement is now held by government and
         has essentially be retired from extractive use

The WSP provides that minimum releases be delivered at Weir 32 for the suppression of algae,
noting the seasonal variability, the minimum release requirements are as follows:

January-March                                        350 ML/d
April                                                300 ML/d
May-October                                          200 ML/d

Lower-Darling Operations Plan – November 2018                                                       5
November-December                                   300 ML/d

These releases total 95.6 GL/year.

3.2 Murray-Darling Basin agreement

The Commonwealth Water Act 2007 provides the Murray-Darling Basin Agreement within Schedule
1 of the Act. Clause 95 of Schedule 1 provides the New South Wales entitlement to water from
Menindee Lakes.

Clause 95 provides that:

    •    Whenever water in the Menindee Lakes storage falls below 480 GL, New South Wales may
         use stored water as it requires until the volume next exceeds 640 GL.

    •    Whenever sub clause 1 does not apply, the resources within the storage are shared in
         accordance with Clause 94 (c), meaning that inflows to the storage are shared 50:50
         between Victoria and New South Wales.

The agreement provides that the Murray-Darling Basin Authority, acting on behalf of the signatories
to the agreement, shall manage the access and delivery of resources held within the Menindee
Lakes storage in accordance with system operating requirements.

Lower-Darling Operations Plan – November 2018                                                     6
4. Customers

4.1 Domestic and stock

There are 115 Domestic & Stock licences with a total share component of 1,370 ML. Domestic &
Stock use in the Lower-Darling generally exceeds 400 ML/year. Average annual use has been
impacted by periods of no access in the Lower-Darling in recent years. Figure 1 shows the annual
historical use for domestic and stock from 2012/13. Domestic & stock water is required all year
round and requires a continual flow along the Lower-Darling between Weir 32 and Burtundy Weir.

                                          Domestic & stock
              800

              700

              600

              500
 Usage (ML)

              400

              300

              200

              100

                0
                    2012/13   2013/14       2014/15   2015/16   2016/17   2017/18   Average

Figure 1: Historical Use - Domestic & Stock

Lower-Darling Operations Plan – November 2018                                                    7
4.2 Local water utility – Broken Hill, Pooncarrie

There are two Local Water Utility (LWU) with share component of 9,975 ML for Broken Hill and 160 ML
for Pooncarie. Broken Hill demand varies from 15 ML/d over winter to 35 ML/d over summer.
Historical use shown in figure 2 indicates that use is usually over 3,500 ML/year, and regularly
exceeds 5,000 ML/year.
Water quality can be a major issue for town water supplies with salinity content above 1,000 EC
resulting in taste concerns and above 1,500 EC resulting in corrosive issues on residential,
commercial and industrial equipment. Once water quality exceeds these levels additional levels of
treatment is required to ensure the water can be used for town supply.

                                                   Local water utility
                        8000

                        7000

                        6000

                        5000
           Usage (ML)

                        4000

                        3000

                        2000

                        1000

                          0
                               2012/13   2013/14     2014/15   2015/16   2016/17   2017/18   Average

Figure 2: Historical use – Local water utility

Lower-Darling Operations Plan – November 2018                                                          8
4.3 Regulated river (high security)

There are 69 High security access licences with a total share component of 7,771 ML. Out of which,
Consumptive use account for 4,196 ML and environmental water account for 3,575 ML. Historical
use shows that use is in most years over 3,000 ML/year, and regularly exceeds 3,500 ML/year (refer
to figure 3). The exceptions being years in which use restrictions have been in place for drought
management.

                                         High security
              5000

              4500

              4000

              3500

              3000
 Usage (ML)

              2500

              2000

              1500

              1000

              500

                0
                     2012/13   2013/14   2014/15   2015/16   2016/17   2017/18   Average

Figure 3: Historical use - high security

Lower-Darling Operations Plan – November 2018                                                    9
4.4 Regulated river (general security)

There are 92 General security access licences with a total share component of 79,507 shares. Out
of which, Consumptive use account for 10,143 shares and environmental water account for 69,364
shares.          The history of general security use has been highly variable. Recent years has been
boosted by significant allocation assignments into the Lower-Darling system by both consumptive
users and the environmental water managers.
While the average use is calculated as 91,100 ML/year, that annual use ranges from 900 ML in
2015/16 to 185,000 ML in 2016-17, where e-water holders used 183,000 ML. Figure 4 shows the
historical general security uses since 2012/13.

                                            General security
              200000

              180000

              160000

              140000

              120000
 Usage (ML)

              100000

              80000

              60000

              40000

              20000

                  0
                       2012/13   2013/14        2014/15   2015/16   2016/17   2017/18   Average

Figure 4: Historical use - general security

Lower-Darling Operations Plan – November 2018                                                     10
5. Drought management measures

5.1 Reduce water sharing plan minimum flow requirements

The WSP provides 95.6 GL (Section 3.1) of water for release over Weir 32, in a seasonal pattern for
improved water quality in the Lower-Darling. Meeting the WSP requirement is a significant draw on
the available resources, once the system reaches 480 GL and access to resources transfers solely to
NSW.

WaterNSW has allocated a budget of 63 GL per year for releases downstream of Weir 32, once the
480 GL trigger is achieved – when no significant inflows are in transit upstream of the storage.

The WSP minimum flow requirements have been set based on what is assumed necessary to
maintain ecological function and minimise risk of Blue Green Algal outbreaks. Reducing below the
minimum required flows during Summer will create an increased risk of algal outbreak, that is
unlikely to be mitigated through increased flow.

The option of maintaining minimum flow requirements at Weir 32 will reduce the duration of time
that flow through the system can be maintained if no further inflows occur. That is, the resources will
be depleted sooner, and as such, without inflow, cease to flow at weir 32 will occur sooner.

In this plan greater value has been placed on maintaining a reliable supply to the Lower-Darling
water users, extending the duration of stock, domestic and town water supplies. However, if higher
rates of release are supported by community and customers for management of water quality,
these would be considered.

5.2 Pumping to Copi Hollow (maximum storage volume 12GL)

Additional storage in Copi Hollow requires the installation of a block bank across the
interconnecting channel between Copi Hollow and Lake Pamamaroo. Pumping from Lake
Pamamaroo to Copi Hollow needs to commence before the water level and water quality in
Pamamaroo drops too low, commencing when Pamamaroo reaches 108GL, and can only be
achieved to a volume of 72 GL.
Pumping to Copi Hollow extends the period of time that supply can be made to Broken Hill without
the need for reverse osmosis.

Lower-Darling Operations Plan – November 2018                                                        11
5.3 Pumping lake Tandure to lake Wetherell

Lake Tandure is a small flat storage lake that is usually connected to Lake Wetherell. Naturally the
two lake bodies separate when the storage reaches 57.8 m or approximately 9.4 GL.
However, efficiency in system storage can be achieved by installing a bank and isolating Lake
Tandure when the Lake Wetherell total storage reaches around 53 GL, and pumping the volume
held in Lake Tandure to Lake Wetherell. This reduces the surface area of the stored volume and
provides efficiency through reduced evaporation.

Pumping from Lake Tandure can extend the period that supply can be made to Broken Hill.

5.4 Reverse osmosis (Broken Hill)

Water quality in Lake Wetherell decreases as the water evaporates and leaves the salt behind. The
electrical conductivity (measurement of salinity) increases to a point where it becomes unsuitable
for domestic supply (above 1,500 E.C.). Essential Water has capacity to install a reverse osmosis
treatment plant for use when water supplies from the Menindee scheme exceed 1,500EC. This
requires some work by Broken Hill to re-instate the facility.

Essential Water have a primary extraction point for supply from upstream of Weir 32. The Weir 32
weir pool has continuous monitoring of E.C. at the WaterNSW hydrometric gauging station. Essential
Water may also source water from Copi Hollow for drought supplies. Monthly monitoring of Lake
water quality is the normal regime, however, this would be increased during drought management
periods or algal outbreaks.          Essential water is also likely to complete a rigorous water quality
monitoring program of all supplies.

5.5 Lower-Darling River block banks

When the water supply is insufficient to secure both Broken Hill and maintain continuous flows in the
Lower-Darling, block banks are constructed as temporary weirs in the Lower-Darling. The water
behind these block banks would then extend the supply of stock and domestic and high security
supplies in these locations. However, they supply only a limited number of customers and do not
address the need of all customers along the Lower-Darling.

Lower-Darling Operations Plan – November 2018                                                         12
5.6 Temporary bore field for Broken Hill and Menindee

Bores have been installed in the Menindee Lake and Tallyawalka aquifers. The water quality in
these aquifers is suitable for supply to Broken Hill and Menindee township, although the Menindee
bore-field would still require reverse osmosis treatment due to salinity marginally above the 1,500 EC
threshold. Commissioning of these bore-fields would require; power, pumps and substantial
pipelines that would take about six months to construct.

This action has been strongly opposed by the Broken Hill community in past years.

6. Resources analysis

6.1 2017/18 water year

Inflows to Menindee Lakes System have been very low during 2017/18 water year. Storage volume
peaked at 1,585 GL on 17 December 2016 and since then has decreased due to releases to meet
downstream demands and system losses, including evaporation, seepage, etc.

As shown in figure 5, the storage volume was 768 GL at the start of 2017/18 water year which has
depleted to 209 GL at the end of water year by 30 June 2018.

The 2017/18 total flow at Willcannia was 52 GL and inflows to the lake system was 21 GL. Most of the
inflows arrived during July to Dec 2017 and a small inflow arrived at the end of the water year from
Northern Connectivity Event i.e. when Environmental water was released from Gwydir and Border
River Catchments and s324 order was in place to protect the water.

Around 2 GL inflow was recorded since the start of 2018/19 water year and that was mostly from
Northern Connectivity Event. Figure 6 shows the recorded flows along the Barwon Darling River
system since July 2017.

Lower-Darling Operations Plan – November 2018                                                       13
Darling river flows and Menindee storage volume
                    3,500                                                                                                                                                                     900,000

                                                                                                                                                                                              800,000
                    3,000                                                                 Menindee storage

                                                                                                                                                                                              700,000
                    2,500
                                                                                                  Weir 32 release                            Evaporation (30
                                                                                                                                                                                              600,000

                                                                                                                                                                                                        Storage volume (ML)
                                                                                                                                             day moving
    Flow (ML/day)

                    2,000
                                                                                                                                             average)                                         500,000

                    1,500                                                                                                                                                                     400,000

                                                                                                                                                                                              300,000
                    1,000
                                                                                                                                                                                              200,000

                     500
                                                                                                                                                                                              100,000

                       0                                                                                                                                                                      0
                                                      30-Aug-17

                                                                  29-Sep-17

                                                                                             28-Nov-17

                                                                                                         28-Dec-17

                                                                                                                     27-Jan-18

                                                                                                                                                                      27-May-18

                                                                                                                                                                                  26-Jun-18
                            01-Jul-17

                                          31-Jul-17

                                                                              29-Oct-17

                                                                                                                                 26-Feb-18

                                                                                                                                              28-Mar-18

                                                                                                                                                          27-Apr-18

Figure 5: Menindee Lakes Total Volume, Storage release and Evaporation – 2017/18

Lower-Darling Operations Plan – November 2018                                                                                                                                                                        14
Period   16 Month   01/07/2017 to 01/11/2018                                                                                2017-18

                   416001                 BARWON R @ MUNGINDI       141.00 1 Day Mean               Discharge (ML/d)

                   422001                 BARWON @ DANGAR BDGE141.00 1 Day Mean                     Discharge (ML/d)

                   425003                 DARLING@BOURKE TOWN 141.00 1 Day Mean                     Discharge (ML/d)

                   425008                 DARLING@WILC. MAIN C      141.00 1 Day Mean               Discharge (ML/d)
        2000

        1600

        1200

        800

        400

          0
                  Jul       Aug    Sep     Oct      Nov       Dec    Jan      Feb       Mar   Apr        May       Jun   Jul   Aug   Sep   Oct

Figure 6: 2017/18 Recorded system Inflows

6.2 2018/19 water year forecast

6.2.1      Water allocations

Water allocation for the Lower-Darling were announced in early July with 100% allocation provided
to High Security customers and no allocations for General Security customers. Average carryover
was 15%.
Customer group                                                                                      Account volume (ML)
Local water utility                                                                                 10,135
Domestic and stock                                                                                  1,370
High security, irrigation                                                                           4,196
High security, environment                                                                          3,575
General security (AWD)                                                                              0
General security, irrigation (carryover)                                                            2,152
General security, environmental (carryover)                                                         10,061
Table 1: Available water as at 1 July 2018

Lower-Darling Operations Plan – November 2018                                                                                                        15
6.2.2     Water availability in 2018/19

This information was current as 31 October 2018.

Licence        Share          Carryover in AWD            Allocation   Allocation   Usage   Balance
category       component                        volume    assignments assignments
                                                          in           out
Domestic
and stock      335            0                 335       0            0            31      304
Domestic
and stock
(domestic) 424                0                 424       0            0            62      362
Domestic
and stock
(stock)        612            0                 612       0            0            5       607
Local water
utility        10,135         0                 10,135    0            0            1,949   8,186
Regulated
river
(general
security)      79,507         12,213            0         5            43           517     11,658
Regulated
river (high
security)      7,771          -1                7,771     224          186          757     7,051
Supplement
ary water      250,000        0                 250,000   0            0            0       250,000
Grand total 348,784           12,212            269,277   229          229          3,321   278,168
Table 2: Account balance

Lower-Darling Operations Plan – November 2018                                                         16
6.2.3    Current situation

As of 6 November 2018, the total storages were at 124.7 GL and about 77 GL of that is active
volume. Table below shows the storage breakdown of the lakes as of 6 November 2018.

Lake ending                             Current storage   Dead storage           Active storage
                                        volume (ML)       (ML)                   (ML)
Tendure                                 9,488             6,188                  3,300
Wetherell                               22,387            490                    21,897
Copi and Pamamaroo                      81,706            31,710                 49,996
Cowndilla                               11,102            8,950                  2,152
Total                                   124,683           47,388                 77,345
Table 3: Storage breakdown as of 6 Nov 2018

The Barwon – Darling River system was mostly disconnected during the second half of 2017/18
water year. Wilcannia was at cease to flow condition for 97 days starting from 27 January 2018.
Flow arrived at Wilcannia during 1st week of May from rainfall events of Moonie and Culgoa in
Queensland then continued with Northern Connectivity Event. Barwon Darling River is not currently
flowing, and flow ceased at the end of Northern Connectivity Event. The Menindee Lakes system
has received around 1.5 GL of inflow over the winter months.

Currently, with the total storage is below the trigger volume of 480 GL, several drought mitigation
measures are in place:

    •    Installation of block bank between Lake Tandure and Lake Wetherell was completed on
         15/03/2018. Water was pumped from Lake Tandure into Lake Wetherell to reduce the
         evaporation loss from the former. About 7,200 ML was pumped into Lake Wetherell
         between 26/03/2018 and 17/05/2018

    •    Reduced flow targets at Weir32 to target minimal flows at Burtundy, since 15 December
         2017.

    •    Installation of block banks in the LowerDarling River to provide a reliable supply to water
         users in the Lower-Darling River.

             o    Jamesville Bank: Located near Pooncarrie the bank was constructed on 4 July 2018
                  and filling has commenced with reduced supply to Lower-Darling River. The bank
                  was about 3.65m full on 19 November 2018.

Lower-Darling Operations Plan – November 2018                                                     17
o    Ashvale Bank: Located near Burtundy the bank was constructed on 3 August and
                  filling has commenced with reduced supply to Lower-Darling River. The bank was
                  about 1.41m full on 19 November 2018.

             o    In addition, approvals have been received for two more banks at Karoola and at
                  Court Nareen. Installation of those block banks will start soon.

    •    Installation of a bank to isolate Copi Hollow from Lake Pamamaroo has been completed on
         24 August as originally planned. Around 11 GL was pumped to Copi Hollow between 25
         September and 5 November with an aim to extend the supply to Broken Hill.

With low storage volume and nil inflows, demands for town water supply, stock and domestic and
expected to be delivered during this summer. Very limited supply will be available only for
permanent plantings during the summer months. Any supply will be dependent upon future inflows
and after ensuring enough water is available to provide connectivity and critical human water
needs.

Supply for town water, stock and domestic will be varied depending location within the system.

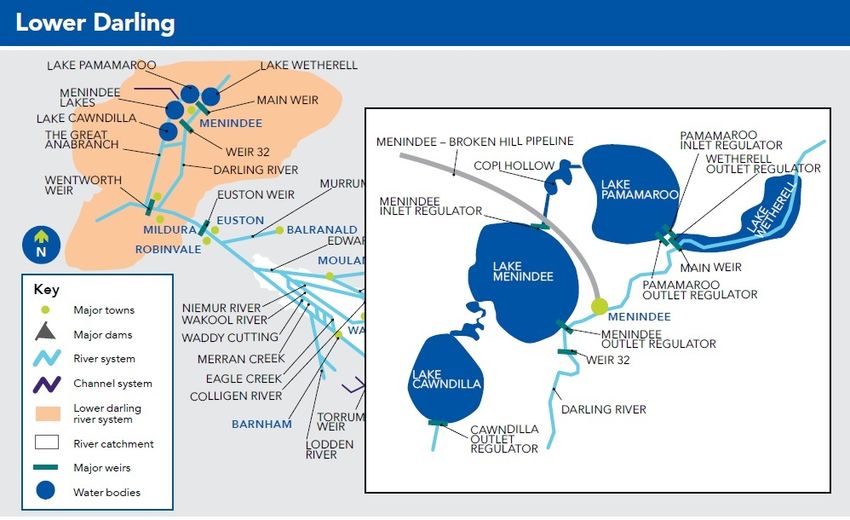
6.2.4    3-months rainfall

Rainfall over last three months has been average to very much below average across NSW, with
large areas especially in the north west receiving below to very much below average rainfall. Areas
west of the Great Dividing Range has received less than 200mm of rain during last three months.
South West Queensland has experienced average to below average rainfalls with the Murray
Darling basin catchment receiving less than with only 2-25mm of rain falling.

Northern Connectivity Event, with s324 order in place, delivered more than 7.4 GL at Wilcannia with
a peak of 500 ML/day. Flow ceased at Wilcannia by the end of August. Since then, there has been
no flow generated along the Barwon Darling catchment from rainfall and hence no inflow has
arrived at the lake system.

Lower-Darling Operations Plan – November 2018                                                    18
Figure 7: Last 3 months rainfall in the Murray Darling Basin

Lower-Darling Operations Plan – November 2018                  19
Barwon-Darling flows
                   600

                   500
   Flow (ML/day)

                   400

                   300

                   200

                   100

                     0
                                     11/07/2018

                                                    21/07/2018

                                                                 31/07/2018

                                                                              10/08/2018

                                                                                           20/08/2018

                                                                                                        30/08/2018

                                                                                                                                    19/09/2018

                                                                                                                                                 29/09/2018

                                                                                                                                                                          19/10/2018

                                                                                                                                                                                       29/10/2018
                         1/07/2018

                                                                                                                     9/09/2018

                                                                                                                                                              9/10/2018
                                                  416001-Barwon R. @ Mungindi                                                    425003 - Darling R. @ Bourke
                                                  425008 - Darling R. @ Wilcannia

Figure 8: Flows in the Barwon Darling since 1 July 2018.

7. Operational strategy

WaterNSW will operate the storages to ensure that key objectives can be met based on the worst-
case scenario (repeat of the drought of record) inflow sequence. However, the plan also looks at
a less conservative strategy (80th percentile) to show the variability of water to allow for broader
planning.
WaterNSW has engaged with customers to understand demands for the current year and has
developed a release strategy that addresses the system key objectives including ensuring a
continuous flow along the Lower-Darling and supply to Broken Hill.

The main drivers for customer demands in 2018/19 will be to:

           •         Maintain the supply for Broken Hill town water supply until delivery of the Wentworth to
                     Broken Hill pipeline (8-9 GL)

           •         Maintain the supply for Menindee and Pooncarrie for the longest duration possible;

           •         While flow connectivity can be achieved:

                                o    Supply consumptive high security and general security licence holders;

Lower-Darling Operations Plan – November 2018                                                                                                                                                       20
•   Provide critical supply for stock, domestic and permanent planting once resources reach
                          critical levels – the priority will be to fill in river storages for drought supply.

As outlined in the Operational Objective (Section 2) WaterNSW has consider a number of scenarios
within the operational strategy. All strategies assume that there will be no inflows until the end of
November 2018. Figure 9 shows the Menindee lakes storage volume forecasts for three different
scenarios.

                                                                               Menindee Lakes volume (ML)
                      1800000

                      1600000

                      1400000
Storage volume (ML)

                      1200000

                      1000000

                      800000

                      600000

                      400000

                      200000

                            0
                                                  Nov-16
                                                           Jan-17
                                         Sep-16

                                                                                                        Nov-17
                                                                                                                 Jan-18

                                                                                                                                                              Nov-18
                                                                                                                                                                       Jan-19
                                                                             May-17

                                                                                               Sep-17

                                                                                                                                                                                                                    Nov-19
                                                                                                                                                                                                                             Jan-20
                                                                                                                                   May-18

                                                                                                                                                     Sep-18

                                                                                                                                                                                                                                                                          Nov-20
                                Jul-16

                                                                    Mar-17

                                                                                                                                                                                         May-19

                                                                                                                                                                                                           Sep-19
                                                                                      Jul-17

                                                                                                                          Mar-18

                                                                                                                                                                                                                                               May-20

                                                                                                                                                                                                                                                                 Sep-20
                                                                                                                                            Jul-18

                                                                                                                                                                                Mar-19

                                                                                                                                                                                                  Jul-19

                                                                                                                                                                                                                                      Mar-20

                                                                                                                                                                                                                                                        Jul-20

                                              80th percentile inflow                                                        Minimum inflow                                               Zero inflow                                      Actual

Figure 9. Menindee Lakes volume based on the three inflow scenarios

Lower-Darling Operations Plan – November 2018                                                                                                                                                                                                                                      21
7.1 Drought strategy

To ensure that customer demands and operational objectives are met a number of drought
management measures will be needed as the drought sequence intensifies. These drought
management measures include reducing the minimum environmental releases along the Lower-
Darling and implementing drought storages (Copi Hollow) and treatment options (Broken Hill
Reverse Osmosis). Timeframes for implementing these measures have been identified in the
Operational Plan based on storage triggers.

                                              Lake storage under minimum inflow scenario
                 600,000

                 500,000

                 400,000
  Storage (ML)

                 300,000

                 200,000

                 100,000

                      0
                                             Nov-16
                                                      Jan-17
                                    Sep-16

                                                                                                   Nov-17
                                                                                                            Jan-18

                                                                                                                                                         Nov-18
                                                                                                                                                                  Jan-19
                                                                        May-17

                                                                                          Sep-17

                                                                                                                                                                                                               Nov-19
                                                                                                                                                                                                                        Jan-20
                                                                                                                              May-18

                                                                                                                                                Sep-18

                                                                                                                                                                                                                                                                     Nov-20
                           Jul-16

                                                               Mar-17

                                                                                                                                                                                    May-19

                                                                                                                                                                                                      Sep-19
                                                                                 Jul-17

                                                                                                                     Mar-18

                                                                                                                                                                                                                                          May-20

                                                                                                                                                                                                                                                            Sep-20
                                                                                                                                       Jul-18

                                                                                                                                                                           Mar-19

                                                                                                                                                                                             Jul-19

                                                                                                                                                                                                                                 Mar-20

                                                                                                                                                                                                                                                   Jul-20
                                        Wetherell (total)                                          Pamamaroo (total)                                                  Menindee                                      Cawndilla

Figure 10. Individual lakes total volume (minimum inflow scenario)

Quarter                        Inflows during the ending quarter                                                                                End of quarter storage
                               Sahara                              Minimum                             80th percentile Sahara                                                          Minimum inflow                                 80th percentile
                               (Zero Inflow)                       inflow                              inflow                                   (Zero Inflow)                                                                         inflow

 Dec-Feb 18 6,917                                                  6,917                               6,917                                    316,654                                316,654                                        316,654
 Mar-May 18 0                                                      0                                   0                                        216,310                                216,310                                        216,310
  Jun-Aug 18 3,198                                                 3,198                               3,198                                    178,618                                178,618                                        178,618
  Sep-Oct 18 0                                                     0                                   0                                        127,663                                127,663                                        127,663
  Nov-Feb 19 0                                                     0                                   32,760                                   33,769                                 33,769                                         52,274
 Mar-May 19 0                                                      0                                   84,240                                   16,371                                 16,371                                         82,750

Lower-Darling Operations Plan – November 2018                                                                                                                                                                                                                    22
Jun-Aug 19 0                    3,640            141,090           9,019      12,000              179,061
  Sep-Nov 19 0                    12,870           49,180            5,948      15,617              117,884
 Dec-Feb 20 0                     18,380           247,540           3,426      21,197              240,495
 Mar-May 20 0                     0                176,180           2,426      12,946              303,150
  Jun-Aug 20 0                    3,640            189,880           1,960      10,573              406,239
  Sep-Nov 20 0                    12,870           159,056           1,145      16,440              454,982
Table 4: Total Lake Inflow Scenarios

WaterNSW has adopted the drought scenario recommencing in Dec 2018 (24-months of minimum
inflows based on historical records), as the basis for its drought preparedness. The tables below
outline the likely inflows, releases and evaporation from the storages to enable the development of
a drought management plan to be prepared for the system.

Total Lakes
Quarter ending Inflows                    Release            Evaporation     End of quarter   Weir 32 daily
                                                                             storage          flow (ML/d)
Dec-Feb 18          6,917                 73,450             141,960         316,654          285
Mar-May 18          0                     30,305             65,180          216,310          189
Jun-Aug 18          3,198                 20,160             29,320          178,618          182
Sep-Oct 18          0                     15,860             32,077          127,663          219
Nov-Feb 19          0                     15,694             79,786          33,769           129
Mar-May 19          0                     3,887              12,778          16,371           42
Jun-Aug 19          3,640                 4,724              3,259           12,000           51
Sep-Nov 19          12,870                5,097              4,388           15,617           56
Dec-Feb 20          18,380                5,460              7,467           21,197           60
Mar-May 20          0                     5,244              3,051           12,946           57
Jun-Aug 20          3,640                 4,724              1,255           10,573           51
Sep-Nov 20          12,870                5,097              2,045           16,440           56
Table 5: Total Lake Forecast Data (minimum inflow sequence)

Lower-Darling Operations Plan – November 2018                                                                 23
Upper Lakes (Wetherell and Pamamaroo)
Quarter           Inflows            Release    Evaporation   End of quarter Weir 32 daily
ending                                                        storage            average flow
                                                                                 (ML/d)
Dec-Feb 18        6,917              30,240     69,010        238,344            285
Mar-May 18        0                  23,250     38,210        179,714            189
Jun-Aug 18        3,198              20,160     18,470        152,248            182
Sep-Oct 18        0                  15,860     22,000        115,640            219
Nov-Feb 19        0                  15,694     67,572        33,741             129
Mar-May 19        0                  3,887      12,666        16,369             42
Jun-Aug 19        3,640              4,724      3,167         11,998             51
Sep-Nov 19        12,870             5,097      4,297         15,615             56
Dec-Feb 20        18,380             5,460      7,376         21,195             60
Mar-May 20        0                  5,244      2,959         12,944             57
Jun-Aug 20        3,640              4,724      1,163         10,571             51
Sep-Nov 20        12,870             5,097      1,981         16,438             56
Table 6: Upper lakes (Wetherell and Pamamaroo) forecast data (minimum inflow sequence)

Lake Cawndilla
Quarter                     Release             Evaporation             End of quarter storage

Dec-Feb 18                  43,210              51,090                  78,310
Mar-May 18                  7,055               26,970                  36,596
Jun-Aug 18                  0                   10,850                  26,370
Sep-Oct 18                  0                   14,327                  12,043
Nov-Feb 19                  0                   12,015                  28
Mar-May 19                  0                   26                      2
Table 7: Lake Cawndilla forecast data (minimum inflow sequence)

7.2 Dry scenario (80th percentile inflows)

The dry scenario considers the 80th percentile inflow sequence to the lakes, inflows that would be
exceed 8 years in 10.
Under this scenario the volume of water held within the lakes would start to increase from Dec 2018.
Refer to figure 11 for Menindee lakes storage volume forecast for this scenario. No major drought
management measures will be required.

Lower-Darling Operations Plan – November 2018                                                     24
Under this scenario supply along to customers would continue. However, depending upon timing of
the inflows it is high likelihood the total volume in the Lakes will remain below the 480GL and not
increase above the 640GL over the two-year period. This means no water will be available for the
MDBA to meet demands in the Murray over that period.

                                                                               Menindee Lakes volume (ML)

                  1,800,000

                  1,600,000

                  1,400,000
Storage volume (ML)

                  1,200,000

                  1,000,000

                      800,000

                      600,000

                      400,000

                      200,000

                           0
                                                  Nov-16
                                                           Jan-17
                                         Sep-16

                                                                                                        Nov-17
                                                                                                                 Jan-18

                                                                                                                                                              Nov-18
                                                                                                                                                                       Jan-19
                                                                             May-17

                                                                                               Sep-17

                                                                                                                                                                                                                    Nov-19
                                                                                                                                                                                                                             Jan-20
                                                                                                                                   May-18

                                                                                                                                                     Sep-18

                                                                                                                                                                                                                                                                          Nov-20
                                Jul-16

                                                                    Mar-17

                                                                                                                                                                                         May-19

                                                                                                                                                                                                           Sep-19
                                                                                      Jul-17

                                                                                                                          Mar-18

                                                                                                                                                                                                                                               May-20

                                                                                                                                                                                                                                                                 Sep-20
                                                                                                                                            Jul-18

                                                                                                                                                                                Mar-19

                                                                                                                                                                                                  Jul-19

                                                                                                                                                                                                                                      Mar-20

                                                                                                                                                                                                                                                        Jul-20
                                                                                                                          80th percentile inflow

Figure 11: Lakes total volume under the 80th percentile inflow sequence.

7.3 Water quality

Based on current minimum inflow sequence forecasts the salinity levels will reach 1,000 electrical
conductivity (E.C.) in November 2018 and 1,500 E.C. in April 2019. Figure 12 shows the lake Wetherell
salinity levels for minimum inflow sequence. Figure 13 shows the lake Wetherell salinity levels for zero
inflow sequence.
If raw water salinity levels increase above 1,000 E.C. it will begin to have an impact on the taste of
the Broken Hill water supply and once salinity levels reach 1,500 E.C. the water quality will have a
corrosive impact on water using appliance and equipment.

Lower-Darling Operations Plan – November 2018                                                                                                                                                                                                                                      25
Water quality in Lake Wetherell will be key to the time of alternating supply from Weir 32 to Copi
Hollow for supply to Broken Hill. Future of Broken Hill water supply will depend on the completion of
Wentworth to Broken Hill pipe line project.

                                                                                                               Lake Wetherell salinity
                               2,500

                               2,000
    Lake salinity (EC µm/cm)

                               1,500

                               1,000

                                500

                                  0
                                                               29-Oct-17

                                                                           28-Dec-17

                                                                                                                                                                                                                19-Oct-19

                                                                                                                                                                                                                            18-Dec-19

                                                                                                                                                                                                                                                                                        13-Oct-20
                                                                                       26-Feb-18

                                                                                                   27-Apr-18

                                                                                                                                        24-Oct-18

                                                                                                                                                    23-Dec-18

                                                                                                                                                                21-Feb-19

                                                                                                                                                                            22-Apr-19

                                                                                                                                                                                                                                        16-Feb-20

                                                                                                                                                                                                                                                    16-Apr-20
                                                   30-Aug-17

                                                                                                                26-Jun-18

                                                                                                                            25-Aug-18

                                                                                                                                                                                        21-Jun-19

                                                                                                                                                                                                    20-Aug-19

                                                                                                                                                                                                                                                                15-Jun-20

                                                                                                                                                                                                                                                                            14-Aug-20
                                       01-Jul-17

Figure 12: Salinity levels in lake Wetherell (minimum inflow sequence)

Lower-Darling Operations Plan – November 2018                                                                                                                                                                                                                                                       26
Lake Wetherell salinity
                      20,000

                      18,000

                      16,000

                      14,000
    Lake salinity (EC µm/cm)

                      12,000

                      10,000

                               8,000

                               6,000

                               4,000

                               2,000

                                  0
                                                               29-Oct-17

                                                                           28-Dec-17

                                                                                                                                        24-Oct-18

                                                                                                                                                    23-Dec-18

                                                                                                                                                                                                                 19-Oct-19

                                                                                                                                                                                                                             18-Dec-19

                                                                                                                                                                                                                                                                                         13-Oct-20
                                                                                       26-Feb-18

                                                                                                   27-Apr-18

                                                                                                                                                                 21-Feb-19

                                                                                                                                                                             22-Apr-19

                                                                                                                                                                                                                                         16-Feb-20

                                                                                                                                                                                                                                                     16-Apr-20
                                                   30-Aug-17

                                                                                                                26-Jun-18

                                                                                                                            25-Aug-18

                                                                                                                                                                                         21-Jun-19

                                                                                                                                                                                                     20-Aug-19

                                                                                                                                                                                                                                                                 15-Jun-20

                                                                                                                                                                                                                                                                             14-Aug-20
                                       01-Jul-17

Figure 13: Salinity levels in lake Wetherell (zero inflow sequence)

7.4 Key operational decisions and dates

The below table outlines dates for key operational changes required to ensure operational
objectives are met. The model optimises the use of Lake Wetherell first drawing water from
the flood plain then transferring releases to Pamamaroo. The model has also used the
worst recorded evaporation data.

                                                                                                                    Key operational changes

Assumptions                                                                                 Sahara (zero inflow) Minimum inflow                                                                                                     80th percentile inflow
Inflow                                                                                      No inflow beyond                                                    Statistical worst inflow 80th % Inflow sequence -
                                                                                            recession of current sequence on record - Applied from Dec 2018
                                                                                            inflow                                                              Applied from Dec 2018

Broken Hill reserve                                                                         Planned 50 GL of active storage - but due to switch to Copi Hollow
                                                                                            when Weir 32 EC forecast to exceed 1,500 EC.

Lower-Darling Operations Plan – November 2018                                                                                                                                                                                                                                                        27
MDBA delivery                       Ceased since second week of December 2017
MDBA delivery cease - 480           15-Dec-17             15-Dec-17              15-Dec-17
trigger
Volume in Wetherell +               307 GL                307 GL                 307 GL
Pamamaroo @ 480GL
Volume in Cawndilla +               172 GL                172 GL                 172 GL
Menindee @ 480 GL trigger
Results                             Sahara (zero inflow) Minimum inflow          80th percentile inflow
Weir 32 Flows - NSW control - Currently 200ML/day Currently 200ML/day            Per Water Sharing Plan
post 480 GL                         Releases will be      Releases will be
                                    reduced depending reduced depending
                                    on Pamamaroo          on Pamamaroo outlet
                                    outlet capacity.      capacity.

                                    Flow cease by end     Flow cease by end of
                                    of Dec 2018 / early   Dec 2018 / early Jan
                                    Jan 2019              2019
MDBA volume accessible              Not available         Not available          Not available

Tandure pumping                     First phase           First phase completed First phase completed –
                                    completed – 25 Mar – 25 Mar to 17 May        25 Mar to 17 May 2018.
                                    to 17 May 2018.       2018.
Pumping to Copi Hollow              First phase           First phase completed First phase completed 25
                                    completed 25 Sep to 25 Sep to 5 Nov 2018     Sep to 5 Nov 2018
                                    5 Nov 2018
Lower-Darling Cease to Flow End of Dec                    End of Dec 2018/early No supply issue forecast
                                    2018/early Jan 2019 Jan 2019
Switch Supply to Copi Hollow Dec 2018                     Dec 2018               Dec 2018
(depending upon EC level in
Wetherell)

Broken Hill Supply switch           Late April 2019*      Late April 2019*       End of Feb 2019
back to lake Wetherell              On hold pending       On hold pending
                                    W2BHill pipeline      W2BHill pipeline
Broken Hill supply fail             September 2019        Secure end of forecast Secure end of forecast
                                    On hold pending       period 30 Nov 2020     period 30 Nov 2020

Lower-Darling Operations Plan – November 2018                                                             28
W2BHill pipeline

* Salinity is likely to be high
Table 5: Key Operational changes required

7.5 Key messages regarding drought measures

Drought measures have been progressively implemented since Dec 2017. WaterNSW is
continuously monitoring the situations and implemented various measures to manage the
resources during drought. Following are the highlights regarding key drought management
measures

• WaterNSW has numerous works in place to secure water supply to Broken Hill until the pipeline is
   available, and to extend Lower-Darling supplies to S&D and High Security.

• Block Bank in place between Wetherell and Tandure isolating lake Tandure providing efficiency
   through reduced evaporation.

• Block Bank between Copi Hollow and Lake Pamamaroo is in place to continue supply to Broken
   Hill without the need for reverse osmosis.

• Two temporary block banks downstream of Pooncarie (Ashville and Jamesville) have already
   been installed to maintain continuous flows with limited supply to number of customers.

• Approvals have been received for two additional temporary block banks upstream of
   Pooncarie at Karoola and at Court Nareen to secure S&D supply.

• Increased frequency of lake water quality monitoring of all water supplies.

Broken Hill Pipeline project is expected to provide assistance supplying the Broken Hill community
after December 2018.

   More information
   Subscribe to our customer information (weekly water availability reports, e-newsletters, etc.)
   at waternsw.com.au/subscribe.

Lower-Darling Operations Plan – November 2018                                                        29
You can also read