Drought crisis: Moving forward together - Swartland Municipality 01/02/2018 DROUGHT DISASTER PRESENTATION
←
→
Page content transcription
If your browser does not render page correctly, please read the page content below
Drought crisis: Moving forward together

       Swartland Municipality
            01/02/2018
        DROUGHT DISASTER PRESENTATION
          DROOGTE RAMP VOORLEGGING
How severe is the drought?
• 2017 had the lowest rainfall since 1896. And rainfall in 2015 and
  2016 was also unprecedented low.
• Findings are that this kind of drought occurs once in 311 years
  with a 90% confidence that it falls between 105 and 1 280 years.
• The drought crisis has also triggered heated emotions and a lot
  of disagreement about who is to blame.
• We can choose to be defeated, or we can choose to show the
  world that we are up to the challenge.
• Panic and hysteria are not helpful to the effort to Defeat Day
  Zero. It actually increases consumption and is counter-
  productive.
• But one thing we can agree on: We have to avoid Day Zero.
• And the only way to defeat Day Zero is to use less water.
• So everyone has to get down to 50 litres per day and lower.
• But more later in my presentation.
WHERE IS ALL THE WATER?        70%
                            POLAR ICECAPS

 97.5%
 saltwater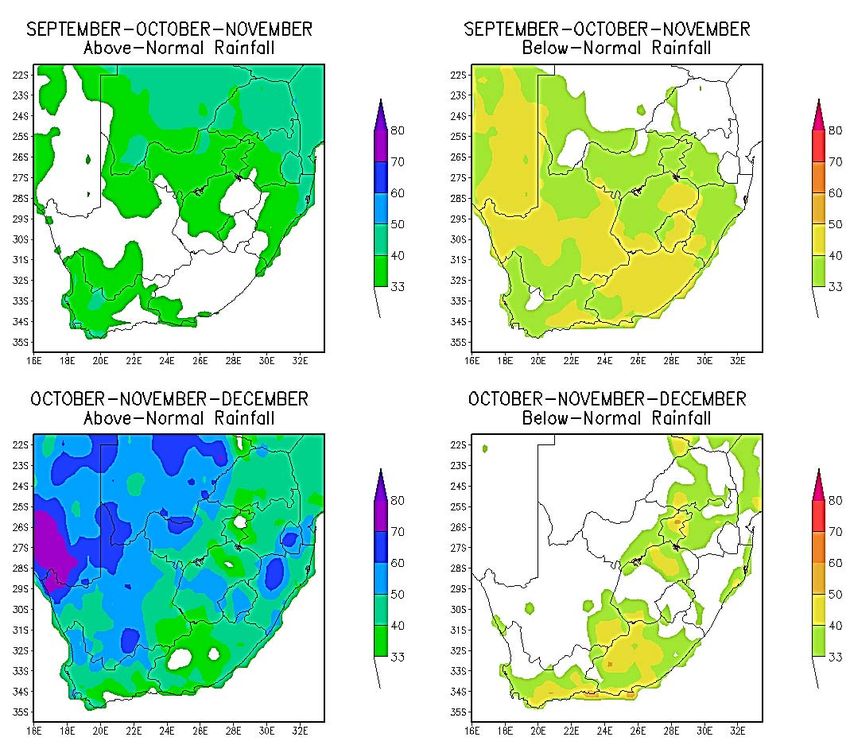
WHERE IS ALL THE WATER?                                        70%
                                                            POLAR ICECAPS

 97.5%
 saltwater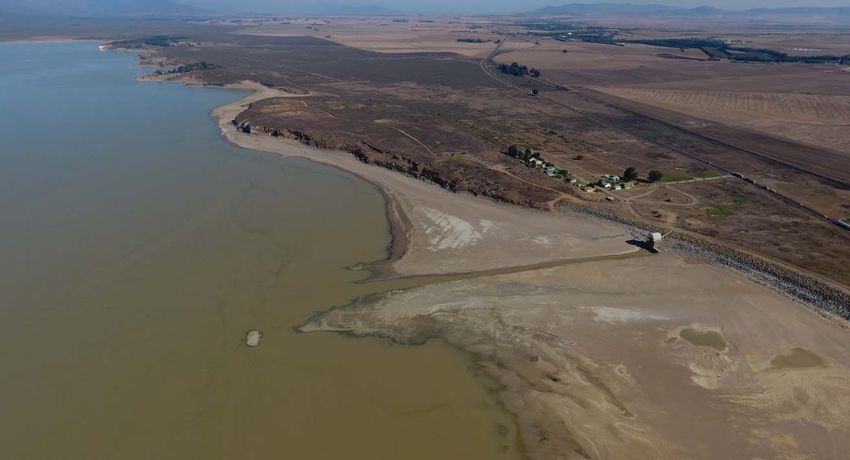
Current Seasons Rainfall – over 40
years at CPT Airport (To 18 Dec 2017)
122 YEAR of RAINFALL:
              CPT Airport (from 1895 to 2017)
                                           2017 rainfall until
                                       18/12/2017 only 152.5 mm

635

                                                                500

                                                                   400
  1896

                           1929+31

                                     1960
                                                                   300

                                            1973

                                                         2015
                                                                   200
         2016 - 221.0 mm
         2015 – 325.0 mm

                                                            2017
         2014 – 511.5 mm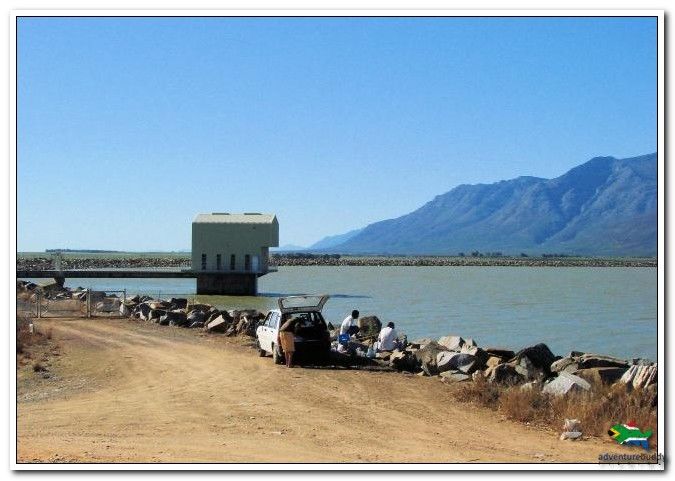
Outlook for: February –March-–
           April 2018 (Rainfall)
FEBRUARY 2018 to APRL 2018   FEBRUARY 2018 to APRL 2018
                                                          For February
                                                          2018 through to
                                                          April 2018 the
                                                          indication is
                                                          above the norm
                                                          for both the
                                                          Western and
                                                          Northern Cape.
                                                          Except the
FEBRUARY 2018 to APRL 2018   FEBRUARY 2018 to APRL 2018
                                                          extreme South
                                                          Western parts
                                                          of the Western
                                                          Cape where it
                                                          is projected to
                                                          be 40% below
                                                          normal.
                                                          UPDATED 16- 01- 2018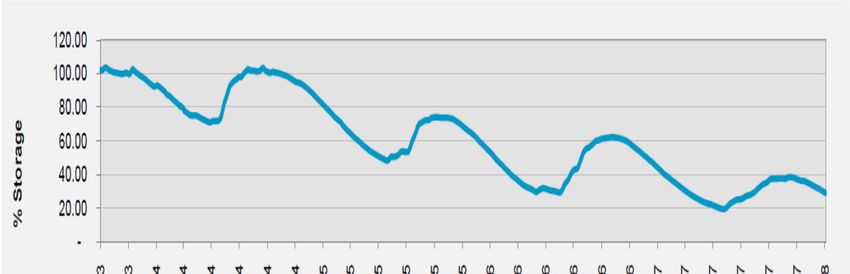
Dam levels of the six biggest dams in
              the Berg River System that the City
              draws from (17 Jan 2018)
           2013                  2014                    2015    2016    2017    2018
          102.9%                103.5%                   72.4%   60.1%   34.7%

Source: Western Cape Water Supply System Strategy 2015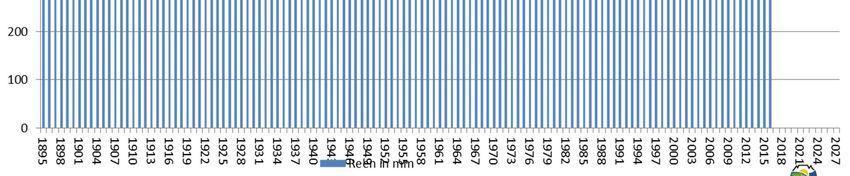
Breakdown of water users in the
              Berg River Management Area

                                        1% 1%            0% 0% 0%
Note that                                                           Agricultural (capped)
different users                4%
are under                                                           Urban: City of Cape
different levels of
                                       35%                          Town
                                                                    Urban: West Coast
water restrictions                 Agricultural
e.g. agriculture is                                                 Urban: Overberg
at 60% reduction                                                    Water
                                                                    Urban: Stellenbosch
in allocation              59%
(October 2017),               Cape Town                             Urban: Drakenstein
while domestic &
                                                                    Urban: Piketberg
industrial areas
are at 40%                                                          Other
                    6% - All other Urban Areas
reduction.
Source: Western Cape Water Supply System Strategy 2015
City of Cape Town: Water Dashboard
        29/01/2018

                                                          TARGET
Source: Western Cape Water Supply System Strategy 2015
Source: Western Cape Water Supply System Strategy 2015
Source: Western Cape Water Supply System Strategy 2015
Western Cape Water Supply System
              (WCWSS) Weekly Dam Drawdown
              Tracker

Source: Western Cape Water Supply System Strategy 2015
City of Cape Town: Water Dashboard
– 4 Year Historic Water Consumption
2014/15
2015/16 1200
2016/17 1000
800
600
500
600 Ml/day: Metro runs dry in April 2018
450 Ml/day: Metro runs dry in May/June 2018
DAMS ON 13.5% 16
Source: Western Cape Water Supply System Strategy 2015Effective from 01/01/2018 in the METRO
LEVEL 6 WATER RESTRICTIONS
• Residential units consuming more than 10 500 litres per month will
be prioritised for enforcement
All non-residential properties (e.g. commercial and industrial
properties, schools, clubs and institutions) must ensure that their
monthly consumption of municipal drinking water is reduced by 45%
compared to the corresponding period in 2015 (pre drought).
Agricultural users to reduce consumption by 60%
The use of borehole water for outdoor purposes is discouraged in
order to preserve groundwater resources
Borehole/wellpoint water should rather be used for toilet flushing.
All boreholes and wellpoints must be registered with the City and
must display the official City of Cape Town signage clearly visible
from a public thoroughfare.
No watering/irrigation with municipal drinking water allowed.
This includes watering/irrigation of gardens, vegetables, agricultural
crops, sports fields, golf courses, nurseries, parks and other open
spacesMajor dam levels in Cape Town
29 Januarie 2018
DAMS CAPACITY 22/01 15/01 2017 2016
Theewater 480 188 13.3% 14.2% 34.5% 50.9%
Voëlvlei 164 095 18.3% 18.8% 42.0% 25.7%
Bergrivier 130 010 53.7% 55.0% 49.2% 49.9%
Wemmers 58 644 52.4% 52.3% 36.6% 56.0%
Steenbr. Lo 33 517 43.8% 45.5% 44.6% 49.5%
Steenbr. Up 31 767 85.7% 90.2% 59.4% 76.9%
TOTAL 898 221 236 111 244 555 354 034 426 408
% Storage 26.3% 27.2% 39.4% 47.4%
NOTE: the last 10% of a dam's water is difficult to use, the useable
water in the dam is approximately 10% less than the dam level.
NOTE 2: Out of the System 59% to the Metro, 6% to smaller
towns and 35% to Agriculture
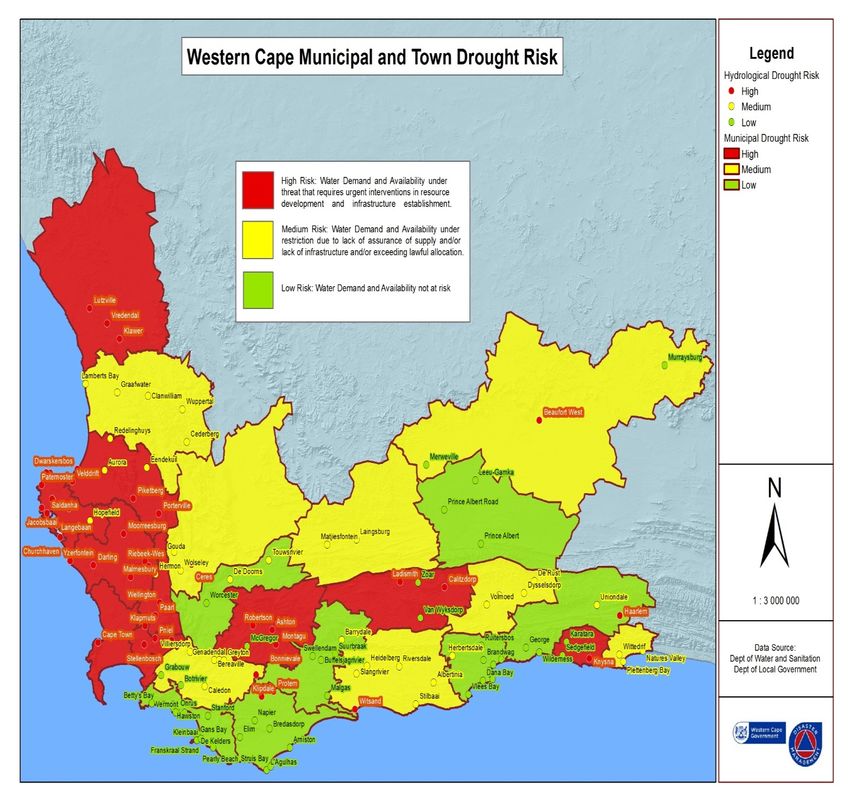
Source: Western Cape Water Supply System Strategy 2015Drought status across the Western Cape – Municipalities & Towns
WC dam levels 2016 vs 2017 (15/01/2018)
                           % Full   % Full     Normally winter rain
Dam                      This Week Last Year   starts around the
                                               Easter Weekend. In
Cape Town System                               2017 it started in June.
Dams (Combined):                               Below normal rain fell
Wemmershoek,                                   May to September
Voelvlei, Steenbras,                           (±50% of Long Term
                                               average) which had
Theewaterskloof and                            significant impact on
Berg River Dams            28.37     42.03     water levels in our
                                               major storage dams
Berg River Catchment       43.83     49.21     Dam levels much lower
Breede River                                   than corresponding
                                               time last year
Catchment                  22.55     40.21
                                               SAWS has
Gouritz River                                  recommended current
Catchment                  18.40     26.29     drought measures
                                               continue for
Olifants / Doorn River                         foreseeable future
Catchment                  20.58     56.92
                                               Businesses need to
Western Cape State of                            plan for a new
Dams                       26.56     41.36           normal
Agricultural impacts: scenario – only
40% of water allocation
Potential on‐farm impact if water
Farmers’ potential
supplies are capped at 40% of
response actions
allocation
• The average decline in production Close
is expected to be 36.9% Busines Preserv
e Crops
• Quality of produce can be affected Pull Out s
Margin 6% 1%
• This would translate to al
• R4.96 billion GVA decline for Blocks
2017/8 (27% of the WC Agri 11% Lower
Output
industry)
Mitigat 31%
• 35 634 potential job losses e
• Loss of valuable market share in 20% Prioritis
fruit exports e Block
31%
• Some farm operations likely to
go bankrupt
Very concerning is that some areas are
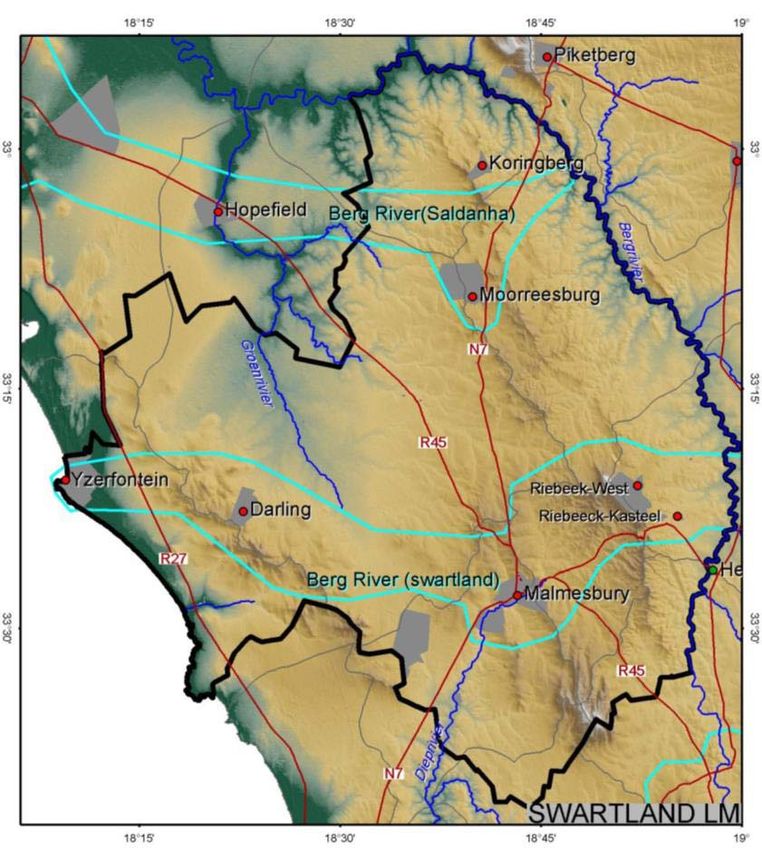
already as low as 17.5% of normal water allocationSWARTLAND MUNICIPALITY
• 11 Towns
• Population: 117 291
(133 762)
• Households: 26 670
• Annual water
demand:
2015 = 5 million m3
2016 = 4 million m3
2017 = 3.5 million m3
2018 = 3 million m3
• Water use efficiency
– 90ℓ/p/d - Must come
down toSWARTLAND MUNICIPALITY
• 11 Towns
• Population: 117 291
(133 762)
• Households: 26 670
• Annual water
demand:
2015 = 5 million m3
2016 = 4 million m3
2017 = 3.5 million m3
2018 = 3 million m3
• Water use efficiency
– 90ℓ/p/d - Must come
down toSWARTLAND BULK WATER SOURCES
Out of Voëlvlei dam:
29/01/2018
Swartland sources:
29/01/2018
Metro: 92% (10Mℓ- 8%)
Voëlvlei: 87.4% (18.3%)
Swartland:6% (10Mℓ- 8%)
Agricult.: 2% ( 0Mℓ- 0%) Paardenberg: 1.4% (9.0%)
Misverstand:?(31Mℓ-24%) Misverstand: 11.2% (73.4%)
The annual total water demand for domestic use is
83% and 17% for commercial / industrial use.
Saldanha bay : 40% domestic and 60% commercial /
industrial.Voëlvlei Dam – Monday 29 Jan 2018 # 18.3%
Monday 29 Jan 2017 # 42.4% (-24.1%)
(Inligting van die Departement Water en Sanitasie)
Die totale vlak van damme wat water aan die Groter
Kaapstad Metropool lewer (Voëlvleidam ingesluit) is tans
26.3% teenoor die 39.4% van verlede jaar.
2018-02-05 13:48 23
(-13.1%)
23Outlet of Voëlvlei dam to Swartland WTW
and Cape Town WTW FIRST HURDLE:
Swartland WTW
to get the water to
the intake/outlet
Swartland WTW
±12.5%
CoCT
Unusable WTW
Water ±5% ±5%
CoCT
WTW
PLAN VIEW CROSS SECTION VIEW
24Voëlvlei
MAX 0.92% / week
12.5% Dam level on 08/03/2018
12.5% damvlak
5% damvlakVoëlvlei
MAX 0.58% / week
12.5% Dam level on 09/04/2018
12.5% damvlak
5% damvlakVoëlvlei 12.5% Dam level on 09/04/2018
29/01/2018
THANKS TO
OUR
RESIDENTS
WAS 87 TOT OP 17/01/2018 SWARTLAND
HAVE SAVED
42% IN
JANUARY
2018
WAS OP 17/01/2018 NOG 2018/03/08Timeline towards The Day dams are on 13.5% is not a static
possible Day the date - dependent on numerous factors:
dams are on 13.5% •
•
Rainfall
Temperatures and wind speed (evaporation)
i.e. how is that Day • New supply volumes & timing
determined • Consumption – City needVoelvleidam Channel Release
from1/11/2017 to 29/01/2018
Misverstand dam level
from 10/01/2018 to 29/01/2018Phases: Disaster Restrictions
Phase 3
Phase 1
Phase 2 Full-scale
Preservation
Disaster disaster
Restrictions
Restrictions implementation
(rationing)
Purpose – To avoid Purpose – Avoid Purpose - Minimise
escalation to Phase 2: escalation to Phase 3: impact on human life:
Limiting supply and • Maintaining human life • Extreme scenario
advanced pressure and critical services • Can be avoided with
management. • Many households and progressive rationing in
• Critical services, will businesses will be phases 1 and 2
be largely unable to access • Limited drinking water
unaffected drinking water supplie.
• Tariff up + Intensified • Water collection sites to • Households and
installation of water be established businesses will be
management • Maintenance of the unable to access
sewage system drinking water.
devices
3Contingency plans: Cape Town Day Zero
• Cape Town key aim is to avoid Day Zero all together by
stretching water resources until next winter’s rainfall
• If properly managed the so called Day Zero will not arrive
suddenly and unexpectedly
• The monitoring of the situation by the WCG will provide an
early warning should the Day Zero date be approaching for a
specific municipality
• Contingency plans for the critical municipalities are currently
being developed by the Provincial Disaster Management
Centre and local municipality.
• Town specific plans are being developed, taking the local
situation and conditions into account.
31A lot can happen before Day Zero 1. Taps are closing on the agricultural sector: Agriculture uses 47% and the Metro 48% 2. Metro: Level 6B restrictions: And 600 million litres p/d to
Facts and myths about the
        water crisis
Myth: Migration from the Eastern Cape and
Gauteng is the cause:
• Population growth alone doesn’t explain the water shortage.
  Water consumption has stabilised since 2000.
Myth: Farmers are to blame:
• Agriculture is critical to the Western Cape economy. Fruit
  harvest alone will be ±20% smaller. ±50,000 Seasonal workers
  will have below normal income or no income at all.
Fact: This is the worst drought in recorded
Cape Town history:
• The main reason for the water shortage is, quite simply, a lack
  of rain in the water catchment area, probably a consequence of
  climate change
Facts and myths about the
water crisis
Complicated: The municipality is ultimately
responsible for sorting out the water crisis:
• The day-to-day management of the water is the job of the
municipality (including cleaning and reticulation), but national
government is responsible for oversight and bulk water supply.
• The National Government, has the power to regulate the use,
flow and control of all water in the Republic.
Myth: It’s just a matter of catching the water
off Table Mountain:
• Catching more water from the mountain before it runs into the
storm water system or the sea, but that is not a quick-fix
solution.INTERVENTIONS / INTERVENSIES
Funding Estimated Yield /
Intervention Cost Estimate Phase
Secured Saving (Mℓ/day)
Pressure and Flow
R 3 500 000 R 800 000 0.5 Short term
control
Communication &
R 400 000 R 200 000 Unknown Short term
Awareness
Free leak repairs R 350 000 R 350 000 Unknown Short term
Groundwater R 3 500 000 R 1 500 000 Unknown Short term
investigation
Water tanker truck R 1 422 890 R 1 422 890 Day Zero Short term
Pumping water in From 12.5%
R 5 000 000 R 0 Medium
Voelvlei dam and the Saldanha Bay
term
Misverstand dam 75% tot 50% level
Groundwater Medium to
R 9 000 000 R 3 000 000 ?
development Long term
Pypline from Metro 14% level to 5%
R 60 000 000 R 0 Long term
to Swartland WTW level
Water reclamation
R 45 000 000 R 0 2 Long term
(Malmesbury)
Desalination
R 35 000 000 R 0 1 Long term
Yzerfontein & Darling)SWARTLAND WATER CONSUMPTION
RESIDENTIAL CONSUMPTION:
DECEMBER 2017
In Sept. Used 1 767 owners over 20m3
In Dec. still 236 owners of the 1 767 uses
too much.
And 219 newcomers.
CONSUMPTION: DECEMBER 2017
Nov. Average of 321 = 36.9 L
Dec. Average of 236 = 40.9 L
Dec. Average of 219 = 36.3 LSWARTLAND WATER CONSUMPTION
RESIDENTIAL CONSUMPTION:
DECEMBER 2017
In Sept. Used 1 767 owners over 20m3
In Dec. still 236 owners of the 1 767 uses
too much.
And 219 newcomers.
Plus Indigent Households
CONSUMPTION: DECEMBER 2017
Nov. Average of 321 = 36.9 L
Dec. Average of 236 = 40.9 L
Dec. Average of 219 = 36.3 L
Plus Indigent Households
Dec. Average of 1159 = 20.2 LDROUGHT MANAGEMENT STRATEGY-
Enforcement / Enforcement
Blocks in Rate per unit
Elevated Level 6 kiloliters (kiloliter)
Tariffs 0 to 4 kl R6,30 plus VAT
5 to 10 kl R17,61 plus VAT
Households 11 to 15 kl R19.37 plus VAT
16 to 20 kl R55.00 plus VAT
All other consumers 21 to 25 kl R72.00 plus VAT
26 to 50 kl R99.99 plus VAT
from the first kiloliter 51kl and more R265.12 plus VAT
Consumption: Businesses R25,00 plus VAT
All government agencies R 30.00 plus VATDrought: Answers some of
your questions
When will a detailed policy and operational plan be
published on the PHASE 2 & 3 water collection points:
• We are in Phase 1 (Preservation Restrictions (rationing))
Purpose – To avoid escalation to Phase 2.
• We are busy to design and manage collection points in a way that
makes sense.
• In order to ensure effective implementation the Water Management
Team is labouring over questions such as:
– What range and size of containers will people choose to use;
– how will they carry these containers to and from the standpipe;
– what time of day will they come to the collection point;
– what transport will they opt to use to and from the collection point;
– how will families and neighbours organise themselves to collect water in
a way that makes sense;
– who within the household or business will be designated to collect water
and for how many people will they collect.Drought: Answers some of
your questions
Has the map for PHASE 2 & 3 cut off areas and water
collection points been finalized?:
• We are busy and we will be providing more information on the areas
without water and points of distribution in the near future:
Is it ok to use sea water to flush toilets?:
• No - Use could corrode parts of the reticulation infrastructure and our
wastewater treatment facilities are not designed to handle high
salinity. Use appropriate greywater and alternative sources, such as
water from boreholes, to flush toilets.
What are businesses going to do that rely on water.
• We are engaging with as many of these organisations as possible to
work out what will be the best way to meet their water needs in a
FASE 2 & 3 scenario. The crisis that we face requires a whole of
society approach.Drought: Answers some of
your questions
• There have been media reports on new borehole
regulations:
– We don’t regulate borehole usage: but require only that permission be obtained to
drill and to register a borehole at the municipality.
– The custodian of water resources is the National Department of Water and
Sanitation.
– We advocate for the sustainable use of borehole water for indoor purposes but we
do not support the use of borehole water for outdoor purposes, such as gardening
• Why has the municipality not (substantially)
reduced pressure on the water?
– We have in fact been substantially reducing water pressure since November 2017.
– Our engineers have been reducing water pressure in the bulk pipes at our
reservoirs as well as in the reticulation network that feeds our households.
– Even with reduced pressure, lower-lying areas will have water as it flows easier
because of gravity.
– Operational staff have lowered the pressures across Swartland but the intention is
to keep the system (in Fase 1) pressurised (keep water flowing).
– This is because a lot of damage could be done if we switch off this pressure
system entirely.Drought: Answers some of
your questions
• Is the water system sophisticated enough to
selectively cut off areas and supply the water
distribution points?
• No not in all areas, but water collection points, which will be one of
the means of distributing water, have been located near reticulation
points
• What plans does Swartland have for less able and
vulnerable people to get water from PHASE 3?
• Information sessions will being set up with neighbourhood watches,
NGOs, religious organisations and community groups to brief them
on the PHASE 3 Disaster Plan and what role they will need to play in
ensuring that all persons are able to access their (25 litres) of water
per day. As part of the information sessions, we will be asking
partners to gather information on extremely vulnerable persons in the
areas where they operate.Drought: Answers some of
your questions
• Will schools be prioritised as water collection
points so that they can continue operating too?
• It will largely be left up to relevant role-players in these sectors to
determine suitable contingency plans and concessions for employees
and students
• Residents should be aware that PHASE 2 and 3 are extreme disaster
scenario’s, and significant disruption of daily life is to be expected.
• Are there plans for providing water to essential
services if the water levels drop to a point where
water can’t be provided?
• Yes - We are procuring water tankers to assist with the provision of
water to essential services which are no longer supplied with water
via the reticulation system. However, critical infrastructure have been
prioritised for continued supply of water via the reticulation system. It
is largely residential areas which will no longer be able to be provided
with water via the reticulation system.Drought: Answers some of
your questions
• What steps are being taken to stop people using
excessive water?
• This is based on the billing information of account holders. Daily
enforcement operations are ongoing, public awareness campaigns
carry on and the installation of water management devices for high
water users at their cost. High tariffs for the highest users will assist
to drive down consumption.
Residents should be aware that PHASE 2 and 3 are
extreme disaster scenario’s, and significant
disruption of daily life is to be expected.
PHASE 3: 'It's going to be really unpleasant‘What can I do? Please immediately: Cut your water use to less than 50 litres, per person, per day in total. Use municipal drinking water only for essential washing,cooking and drinking purposes, and only use indoors. Check and fix all leaks on your property. Adhere to all water restrictions. Immediately report any leaks, burst water pipes to the Municipality at 022 487 9400. Visit our webpage www.swartland.org.za for further information and regular updates.
ONCE UPON A TIME / LANK GELEDE

          HOW MUCH HAVE YOU SAVED TODAY?
          HOEVEEL HET JY VANDAG GESPAAR?

          THANK YOU / BAIE DANKIE

Drought crisis: Moving forward together
HET JY AL SO AAN DIE REENVAL
Baie interssant
GEDINK?
Min mense weet hoe werk ‘n reenmeter.
1mm reen is 1 liter water op 1 vierkante meter.
As jy 25 mm reen op jou 1000 vierkante meter erf
kry is dit 25 ton water, 1 hektaar is dit 250 ton water.
As jy ‘n 1000 hektaar plaas het en jy kry 80mm reen
is dit 800 ton x 1,000 hektaar.
Dit is 800,000 ton water.
As jy nou ‘n 10 ton watertrok vat en jy ry 10 vragte
elke dag van die jaar sal dit 800,000/10/10/365 dae
wees.
Dit sal 21.9 jaar vat om dit aan te ry!
(Anonieme bron)You can also read