PORTFOLIO COMMITTEE ON BASIC EDUCATION - Presentation on: Provincial Infrastructure Programme ASIDI & SAFE
←
→
Page content transcription
If your browser does not render page correctly, please read the page content below
PORTFOLIO COMMITTEE ON
    BASIC EDUCATION

     Presentation on:
  Provincial Infrastructure
        Programme
       ASIDI & SAFE
                   1
PRESENTATION OUTLINE

•   Purpose
•   National Development Plan
•   Background
•   Provincial Infrastructure Programme
•   ASIDI
•   SAFE
                           2
PURPOSE
To present a progress report on
Infrastructure   planning   and
delivery as well as SAFE to the
Portfolio Committee on Basic
Education.

                       3
NATIONAL DEVELOPMENT PLAN
“Ensure that all schools meet
minimum         standards    for
infrastructure and commit to
progressively    upgrading each
school’s infrastructure to meet
optimum standards.”
         National Planning Commission: National Development Plan, November 2011)

                                                      4
NATIONAL DEVELOPMENT PLAN…
“School infrastructure backlogs have been considerably
reduced over the past 10 years. But many school
environments are still not conducive to learning.
The Department of Basic Education has committed itself to
eradicating 496 inappropriate structures, providing basic
water to 1 257 schools, providing basic sanitation to 868
schools and providing electricity to 878 schools in the
2012/13 financial year. To meet these commitments, the
department will have to:
• Find ways to deliver infrastructure and services more
  efficiently and cost-effectively
• Improve the quality of information used for planning.”
                  National Planning Commission: National Development Plan, November 2011)

                                                              5
NATIONAL DEVELOPMENT PLAN…

“Take learner safety into
account when planning
infrastructure.”
       National Planning Commission: National Development Plan, November 2011)

                                                    6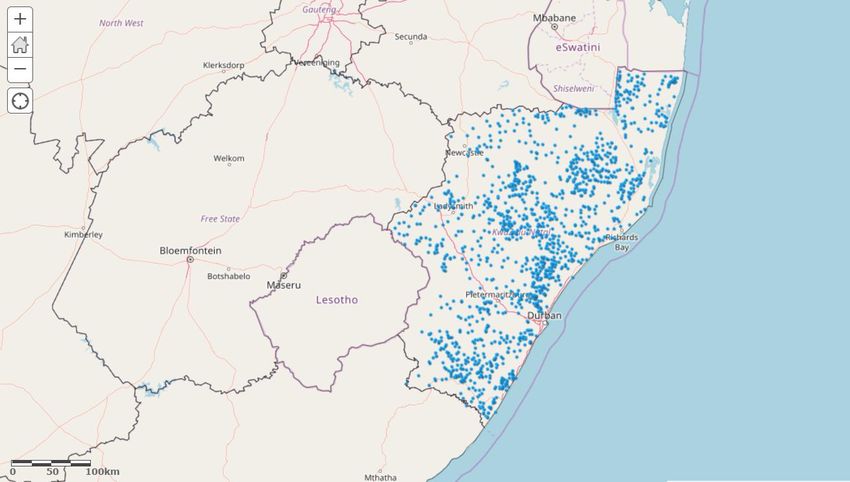
BACKGROUND
•   The sector provides infrastructure through three programmes; viz, the provincial
    programme, the Accelerated School infrastructure Delivery Initiative (ASIDI) as
    well as the Sanitation Appropriate for Education initiative (SAFE)
•   The Provincial Schools Build Programme is implemented by provinces and it
    targets the provision of basic services, new schools, additions to existing schools,
    new and upgrading of services and maintenance. It is funded through the
    Education Infrastructure Grant and the Provincial contribution through the
    equitable share.
•   The Accelerated School Infrastructure Delivery Initiative is a programme driven by
    the DBE to address school's infrastructure backlog on schools that do not meet the
    basic safety norms and standards. It is funded through the Schools Infrastructure
    Backlogs Grant. The purpose of the programme is for the eradication of schools
    made entirely of inappropriate structures and the provision of basic level of
    water, sanitation and electricity to schools.
•   The Sanitation Appropriate for Education initiative (SAFE) is a programme driven by
    the DBE to eradicate all pit latrines and other forms of unacceptable sanitation,
    provide safe and appropriate ablution facilities as well as address insufficient or
    inadequate sanitation facilities and maintenance of all ablution facilities

7
KEY AREAS
• Construction, maintenance, upgrading and rehabilitation of new and
  existing infrastructure in education including district and circuit
  accommodation;
• Provide infrastructure to match curriculum requirements;
• Replace inappropriate schools;
• Provision of basic services;
• Address damage to infrastructure caused by natural disasters;
• Extend existing schools with additional classrooms/facilities;
• Address achievement of the targets set out in the minimum norms and
  standards for school infrastructure; and
• Enhance capacity to deliver infrastructure in education.

                                                         8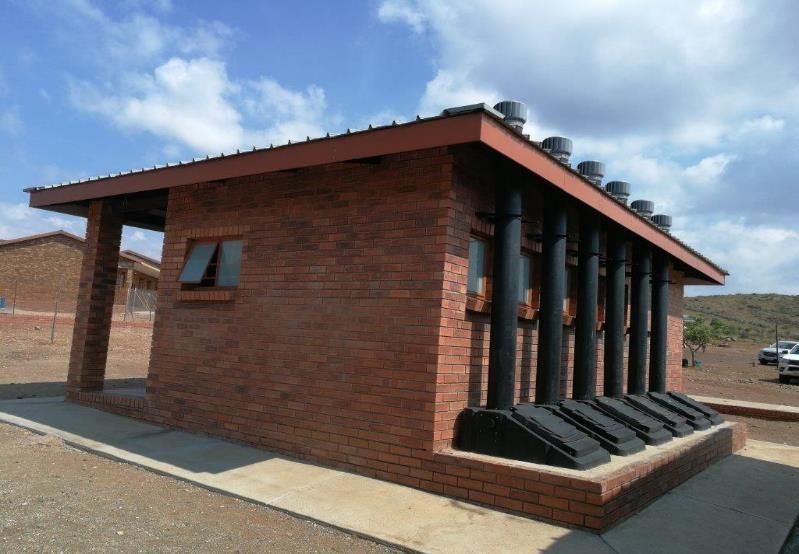
TOTAL INFRASTRUCTURE BUDGET
             – 2019/20 FY
                  SIBG,                                                SIBG
               R 2.027 bn                                             14.2%

              ES,                                                ES
          R 1.713 bn                                            12%
                                 EIG,
                             R 10.514 bn                                       EIG
                                                                              73.8%

                                   Total Budget = R 14. 255bn

EIG = Education Infrastructure Grant
ES   = Equitable Share
SIBG = Schools Infrastructure Backlog Grant

                                                                          9
PROVINCIAL
INFRASTRUCTURE
  PROGRAMME

             10
2019 EIG MTEF ALLOCATIONS
Provinces Allocation MTEF Estimates
2019/20 2020/21 2021/22
R'000 R'000 R'000
Eastern Cape 1 585 532 1 564 208 1 685 128
Free State 833 485 722 425 778 272
Gauteng 1 474 715 1 440 169 1 551 501
KwaZulu-Natal 2 187 162 2 013 405 2 169 050
Limpopo 1 050 160 1 175 467 1 266 336
Mpumalanga 731 792 819 111 882 432
Northern Cape 639 817 505 649 544 738
North West 902 484 1 010 169 1 088 260
Western Cape 1 109 331 1 031 186 1 110 902
Unallocated - 1 184 844 1 250 010
Total 10 514 478 11 466 632 12 326 629
11INFRASTRUCTURE ALLOCATIONS
2019/20
% of equitable share
Provinces EIG Equitable Share Total to total budget
Eastern Cape 1,585,532 0 1,585,532 0%
Free State 833,485 16,378 849,863 1.9%
Gauteng 1,474,715 474,821 1,949,536 24.4%
KwaZulu-Natal 2,187,162 359,210 2,546,372 14.1%
Limpopo 1,050,160 1,826 1,051,986 0.2%
Mpumalanga 731,792 202,727 934,519 21.7%
North West 902,484 2,228 904,712 0.2%
Northern Cape 639,817 7,720 647,537 1.2%
Western Cape 1,109,331 648,843 1,758,174 36.9%
10,514,478 1,713,753 12,228,231
12TARGETS FOR THE 2019/20 FY Target 2019/20
No. PROGRAMME
EC FS GP KZN LP MP NC NW WC
1 Full Service Schools 0 0 0 1 1 0 0 5 0
2 Provision/replacement of Sanitation 178 73 13 150 13 85 14 12 14
3 Provision/upgrade of Water 178 10 13 150 22 3 9 10 14
4 Provision/upgrade of Electricity 5 10 13 100 1 1 11 0 14
5 Maintenance Projects 20 27 40 370 34 29 36 48 173
6 Libraries Project 5 1 13 12 2 3 4 7 0
7 Laboratories Projects 5 4 13 12 0 1 8 7 0
8 School Halls 0 1 13 0 2 0 5 7 0
9 Technical Workshops 0 0 0 0 0 0 2 0 0
10 Nutrition Centres 5 7 13 10 9 3 5 5 15
11 Additional Classrooms 285 39 350 210 22 104 43 26 68
12 Grade R Classrooms 13 18 200 50 23 3 8 10 73
13 Administration Blocks 5 4 13 10 3 5 4 7 15
14 Provision/upgrade of fence 302 9 13 40 0 1 15 5 15
15 Provision/upgrade of sport field 0 0 13 9 1 3 5 8 15
16 Special Schools 0 0 1 2 0 1 0 0 0
17 Boarding Schools 0 0 0 2 19 0 0 0 0
18 Guard House 0 0 13 9 4 1 0 7 0
19 Natural Disasters Projects 2 0 0 150 0 0 0 0 0
13NEW & REPLACEMENT SCHOOLS –
5 YEAR PERIOD
FINANCIAL YEARS
PROVINCE 2019/20 2020/21 2021/22 2022/23 2023/24 TOTAL
Eastern Cape 0 1 5 3 0 9
Free State 6 3 2 4 2 17
Gauteng 7 8 7 6 6 34
KwaZulu-Natal 7 5 1 0 0 13
Limpopo 12 4 14 9 11 50
Mpumalanga 2 6 7 5 2 22
Northern Cape 3 2 11 3 5 24
North West 14 3 11 12 1 41
Western Cape 13 7 10 10 10 50
ASIDI 40 31 29 0 0 100
TOTAL 104 70 97 52 37 376
14OVERALL INFRASTRUCTURE
EXPENDITURE – SEPTEMBER 2019
Total Infrastructure Spending as at end September 2019
Allocated Budget Total Spent as at
% Spent of
PROVINCE 2019/20 end September
Allocated Budget
('000) 2019 ('000)
Eastern Cape 1,585,532 876,882 55%
Free State 849,863 337,569 40%
Gauteng 1,949,536 476,773 24%
KwaZulu-Natal 2,546,372 1,281,619 50%
Limpopo 1,051,986 254,945 24%
Mpumalanga 934,519 545,389 58%
North West 904,712 183,984 20%
Northern Cape 647,537 263,316 41%
Western Cape 1,758,174 781,989 44%
TOTAL 12 228 231 5 002 466 41%
15EDUCATION INFRASTRUCTURE GRANT
SEPTEMBER 2019
Education Infrastructure Grant Expenditure as at end September 2019
% Spent of
Allocated Budget EIG Transfers to Total Spent as at % Spent of
the
PROVINCE 2019/20 PEDs end September Allocated
transferred
('000) ('000) 2019 ('000) Budget
Amount
Eastern Cape 1,585,532 990,958 876,668 88% 55%
Free State 833,485 520,928 330,546 63% 40%
Gauteng 1,474,715 921,697 428,981 47% 29%
KwaZulu-Natal 2,187,162 1,367,157 1,164,205 85% 53%
Limpopo 1,050,160 656,350 254,937 39% 24%
Mpumalanga 731,792 457,370 504,643 110% 69%
North West 902,484 564,052 183,139 32% 20%
Northern Cape 639,817 399,886 260,064 65% 41%
Western Cape 1,109,331 693,332 453,018 65% 41%
TOTAL 10 514 478 6 571 730 4 456 201 68% 42%
16MAINTENANCE – SEPTEMBER 2019
Prov No. of Overall Maint’nce %ge Total %ge
Maint’nce Adjusted Budget Maint’nce Expenditure as Expenditure
Projects in Infrastructure ('000) Budget to at end on Maint’nce
2019/20 FY Budget Total September Relative to
('000) 2019 Maint’nce
('000) Budget
Eastern Cape 454 R 1,585,532 R 255,716 16% R 130,786 51%
Free State 27 R 849,863 R 158,668 19% R 39,540 25%
Gauteng 144 R 1,949,536 R 1,083,137 56% R 240,909 22%
KwaZulu-Natal 445 R 2,546,372 R 944,228 37% R 304,308 32%
Limpopo 119 R 1,051,986 R 360,106 34% R 27,249 8%
Mpumalanga 118 R 934,519 R 131,468 14% R 94,759 72%
North West 62 R 904,712 R 114,097 13% R 33,575 29%
Northern Cape 113 R 647,537 R 181,294 28% R 79,729 44%
Western Cape 173 R 1,758,174 R 646,215 37% R 287,283 44%
TOTAL 1 655 12 228 231 3 874 929 32% 1 238 138 32%
17PROGRESS – NEW AND REPLACEMENT
SCHOOLS SUMMARY OF PROJECTS COMPLTED FOR THE 2019/20 FINANCIAL YEAR
TOTAL COMPLETED
NEW SCHOOLS REPLACEMENT SCHOOLS
TOTAL SCHOOLS
TARGET 2018/19
TARGET 2018/19
FOURTH QUARTER
FOURTH QUARTER
PROGRESS
THIRD QUARTER
THIRD QUARTER
TARGETED
SECOND
SECOND
Province
TOTAL
TOTAL
FIRST
FIRST
QUARTER
QUARTER
QUARTER
QUARTER
Number of Schools
Eastern Cape 1 0 0 0 4 0 0 0 5 0 0%
Free State 7 2 1 3 3 0 0 0 10 3 30%
Gauteng 4 1 1 2 1 0 0 0 5 2 40%
Kwazulu Natal 5 0 1 1 2 0 1 1 7 2 29%
Limpopo 4 1 5 6 4 1 6 7 8 13 163%
Mpumalanga 3 3 0 3 1 1 0 1 4 4 100%
Northern Cape 2 0 0 0 2 0 0 0 4 0 0%
North West 2 0 0 0 5 0 0 0 7 0 0%
Western Cape 4 2 0 2 9 0 1 1 13 3 23%
32 9 8 0 0 17 31 2 8 0 0 10 63 27 43%
Total Number of
schools
18IDMS REPORT 2nd QUARTER OF 2019/20 PER PROVINCE
Total Targets for
Programme Q2
2019/20
EC FS GP KZN LP MP NC NW WC Total
Number of New Schools 32 0 1 1 1 5 0 0 0 0 8
Replacement schools 31 0 0 0 1 6 0 0 0 1 8
Full Service Schools 13 0 0 0 0 0 0 2 0 0 2
Provision/replacement of
776 0 2 2 19 46 23 11 0 0 103
Sanitation
Provision/upgrade of Water 515 0 2 2 64 17 5 1 0 0 91
Provision/upgrade of
133 0 0 2 2 0 0 1 0 0 5
Electricity
Maintenance Projects 727 0 0 2 25 4 14 9 0 15 69
Libraries Project 45 0 0 2 4 7 1 0 0 14
Laboratories Projects 51 0 0 2 3 2 0 0 0 9 16
School Halls 30 0 0 0 0 8 0 1 0 2 11
Technical Workshops 8 0 0 0 0 0 0 0 0 5 5
Nutrition Centres 51 0 0 0 4 0 1 0 0 0 5
Additional Classrooms 1020 0 12 0 69 34 21 7 0 15 158
Grade R Classrooms 266 0 3 4 4 5 4 4 0 2 26
Administration Blocks 52 0 0 1 6 55 1 2 0 65
Provision/upgrade of fence 387 0 1 1 30 16 2 3 0 0 53
Provision/upgrade of sport
28 0 0 0 0 0 0 0 0 0 0
field
Special Schools 3 0 0 0 0 0 0 0 0 0 0
Boarding Schools 31 0 0 0 1 0 0 0 0 0 1
Guard House 30 0 0 0 2 0 1 0 0 0 3
Natural Disasters Projects 185 0 0 0 17 0 4 0 0 0 21
19PROJECT DISTRIBUTION
Prov No. of Projects PROGRESS
Budgeted for
Planning Construction Close-out
EC 2,916 1,197 445 1274
FS 152 40 112 0
GT 290 216 61 13
KZ 1,311 520 420 371
LP 682 174 387 121
MP 624 409 140 75
NC 405 235 140 30
NW 265 93 64 108
WC 98 69 26 3
2,953 1,795 1,995
TOTAL
6,743 37% 35% 28%
20HUMAN RESOURCES
No of Approved
Provnce Posts Filled Not Filled Progress %
Eastern Cape 63 42 21 67%
Free State 78 50 28 64%
Gauteng 101 83 18 82%
KwaZulu-Natal 74 71 3 96%
Limpopo 65 49 16 75%
Mpumalanga 113 97 16 86%
North West 54 30 24 56%
Northern Cape 81 43 38 53%
Western Cape 54 45 9 83%
Total Weight 683 510 173 75%
21CAPACITATION PLANS – REQUIRED
SKILLS SET
Quantity
Surveyors
Finance and 11% Architects
administration 9%
27% Elec.Engineers
2%
Civil Engineers
3%
GIS Specialists
1%
Town &
Regional
Planners
5%
Works Ed. Facility
Inspectors Planners
33% 9%
22MONITORING OF THE PROVINCIAL
PROGRAMME
Reports Submission Date Compliance
Final U-AMP for 2019/20 Due 30 March 2019 This is the final plan for all programmes to be implemented over the
period of at least 10 years.
Monthly IRM reports 22 Day of each month This report captures all infrastructure projects being implemented in the
financial year and seeks to present the financial and non financial
progress of projects
End of Year Reports for 2018/19 Due 31 May 2019 The main purpose of the end-of-year report is to measure progress made
by the programme against the objectives and outcomes set, focusing
mainly on the previous financial year
Draft U-AMP 2020/21 Due 28 June 2019 This is a draft plan for all infrastructure programmes to be implemented
over the period of at least 10 years.
Infrastructure Programme Management Due 30 August 2019 The IPMP & CPS is an infrastructure programme management plan
Plan (IPMP) & CPS which includes the construction procurement strategy for infrastructure
programmes or projects envisaged to commence within the period for the
medium term expenditure framework (MTEF period). The plan specifies
how the infrastructure programme will be executed, monitored and
controlled.
Human Resource Reports 22 Days after end of each Quarter This report seeks to measure progress of the implementation of the
DoRA Human Resource Strategy. It report provides progress on the filling
of posts on the approved establishment for the infrastructure unit of the
affected provincial department
Non-Financial Performace Reports Due 30 days after end of each Quarter The purpose of this report is to measure quarterly progress made by the
programme against the objectives and outcomes set for the specific
financial year. 23PBS 2019/20 ASSESSMENT PROCESS
Weighting for the 2019/20 assessment process (R1.185 billion)
Focus Area Documents / Reports Weight
End of the year evaluation report 20%
Performance Human Resource Capacitation 5%
Infrastructure Reporting Model 40%
User-Asset Management Plans 15%
Infrastructure Programme Management Plans
Planning
and;
20%
Construction Procurement Strategy
TOTAL WEIGHT 100%
24PROJECT COMPLETIONS | STORMS
RIVER PRIMARY
Implementing Agent: Department of Public Works
Allocated budget: R 51.1 million
Construction Period: 33 months
Project completed: January 2019
25PROJECT COMPLETIONS | SIVE
SPECIAL SCHOOL
Implementing Agent: Independent Development Trust
Allocated budget: R124 million
Construction Period: 54 months
Project completed: June 2018
26NOKUTHULA LSEN SCHOOL
27OLIVENHOUTBOSCH SECONDARY
SCHOOL
28MANDLA MTHETHWA SCHOOL OF
EXCELLENCE
29COMMUNITY DISRUPTIONS
Thembisa Special School
• Project experiencing intermittent stoppages
3031
MTEF BUDGET ALLOCATIONS
           2019/20    2020/21     2021/22

           R'000       R'000       R'000

  ASIDI   1 327 048   996 036     1 038 937

  SAFE    700 000     800 000     1 300 000

  TOTAL   2 027 048   1 796 036   2 338 937

                                    32
OVERALL PERFORMANCE
Past Performance Current Financial Year 2019/20
Complete
Sub-
d since
Programme
Inception
2011/12 2012/13 2013/14 2014/15 2015/16 2016/17 2017/18 2018/19 TargetedCompleted Q1 Q2 Q3 Q4 Deviation
Inapp
- 17 36 59 52 16 14 21 229 40 14 8 6 -26
Structures
Sanitation 41 89 161 152 38 41 32 207 834 311 73 46 27 -238
Water 16 64 135 317 90 35 42 205 957 432 53 39 14 -379
Electricity 148 101 39 18 0 66 0 372 Electricity Scope Completed
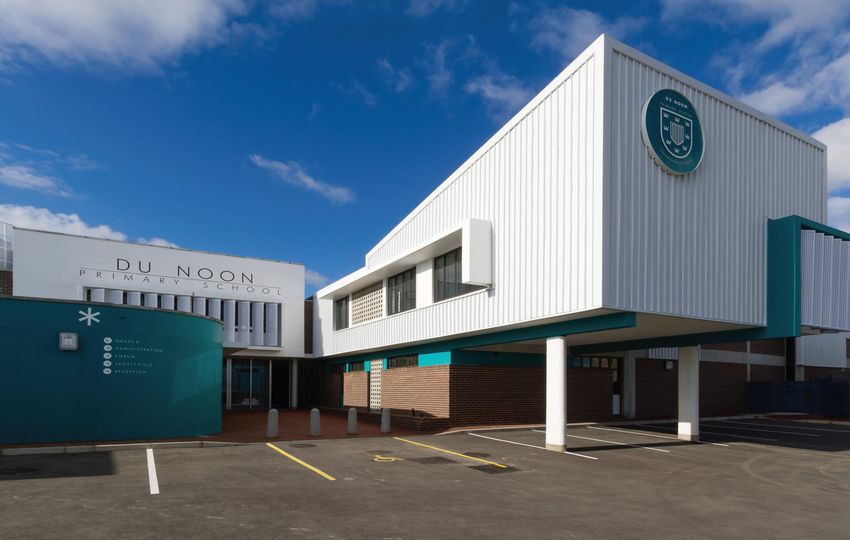
33DU NOON PRIMARY
34PHOTOS : CLARKSON/AMAMFENGU
35CONSTRUCTION PROGRESS – ASIDI 15
Sihlahleni JSS Mbekweni HS
Siyavuya JPS Sifonondile JPS
3
|
6CONSTRUCTION PROGRESS – ASIDI FREE STATE
EBENHAUSER
HERMANA PS
INTERMEDIATE
TWEESPRUIT PS
BHEKIZULU JSS
3
|
72019/20 APP : PROGRAMME 4
Strategic Objective Programme Performance Medium-term targets
Indicator 2019/20 2020/21 2021/22
4.2 Provide basic 4.2.1 Number of new schools built and
infrastructure services completed through ASIDI 40 31 29
(water, sanitation, 4.2.2 Number of schools provided with
electricity) and replace sanitation facilities through ASIDI. 717 691 995
schools built using 4.2.3 Number of schools provided with
inappropriate materials water through ASIDI. 225 125 0
on an annual basis in
order to improve the
conditions under which
learners are taught
382019/20 APP : PROGRAMME 4
QUARTERLY TARGETS
Quarterly Targets
Annual Target
Programme Performance Indicator 1st 2nd 3rd 4th
2019/20
Number of new schools built and completed through ASIDI 40 8 5 12 15
Number of schools provided with sanitation facilities through
717 120 147 210 240
ASIDI
Number of school provided with water through ASIDI 225 147 25 35 18
39INAPPROPRIATE STRUCTURES
Projects Design No of
Construction Progress
Provinces Implementing being & Projects in Projects
Agents (IA) Implement Procur Construction Complete
ed ement 75% d
DBSA 114 3 4 5 2 2 13 98
IDT 31 3 0 0 5 3 8 20
CDC 31 0 2 2 1 2 7 24
EC DRPW 16 0 0 0 0 0 0 16
NDPW 20 1 3 2 2 7 14 5
DBE# 29 29 29 Tender Cancelled. Projects to be Re-Tendered
DBE# 57 57 27 5 8 4 8 25 5
Sub-Total - 298 63 14 17 14 22 67 168
IDT 6 - - - - 2 2 4
FS DBSA 19 - - - 1 1 18
FSDoE 5 - 0 2 3 - 5 0
Sub-Total - 30 0 0 2 3 3 8 22
KZN Adopt-A-School 3 - - - - - - 3
WC WCED 25 - - - - - - 25
MP DBSA 5 - - - - - - 5
NW DBSA 2 - - - - - - 2
NC DBSA 1 - - - - - - 1
LP DBSA 3 - - - - - - 3
40
Total 367 63 14 19 17 25 75 229SANITATION PROGRESS
Projects Planning, Construction Progress No of
Projects in
PROVINCES being Design & Projects
Construction
Implemented Procurement 75% Completed
437 - - 2 18 37 57 380
LP
298 17 6 1 14 17 38 243
EC
39 27 - - - - - 12
FS
116 - 3 3 4 - 11 105
KZN
13 - - - - - - 13
NC
18 8 - - - - - 10
NW
14 - - - - - - 14
GP
38 - - - - - - 38
MP
19 - - - - - - 19
WC
TOTALS 992 52 9 6 36 54 106 834
41WATER PROGRESS
Planning, No of
Projects being Construction Progress Projects in
PROVINCES Design & Projects
implemented Construction
Procurement 75% Completed
520 21 1 - 7 150 158 341
EC
36 - - - - - - 36
MP
67 14 - - - - - 53
FS
0 - - - - - - -
GP
224 6 3 1 - - 4 214
KZN
364 - 2 14 12 35 62 302
LP
5 - - - - - 5
NC
3 - - - - - - 3
NW
3 - - - - - 3
WC
TOTALS 1 222 41 6 15 19 185 224 957
42MONITORING
• Effective monitoring of the provision of infrastructure Professional Service
Providers (PSP’s) and Implementing Agents (IA’s) that the Department of
Basic Education and provinces are utilizing for the implementation of the
infrastructure programme.
• Monitoring addresses planning, budgeting, expenditure, procurement and
project management. These are interrogated and a sample of projects are
visited. Based on the findings from these visits, remedial actions are
devised with the province and monitored by the DBE.
• Monitoring deals with both programme and project matters;
• Programme matters include:
- The pattern of overall expenditure being achieved;
- Comparisons of expenditure to projected cash flows;
- Progress being made with key groups of projects [eg. Water, sanitation,
libraries, laboratories, Grade R]
- Management of the portfolio of projects [ie evidence that the programme
of projects is being managed effectively through the project cycle];
43MONITORING (CONT.…)
• At the Project level the focus is on ensuring:
- that PSP appointments are being made;
- that planning and design processes are progressing;
- that the tender process for the appointment of contractors is progressing, that
construction is progressing satisfactorily, [i.e. on programme, on budget, at
acceptable quality…]; and
- that projects are being handed over and closed out and that final accounts are
being wrapped up.
44CHALLENGES & REMEDIAL ACTIONS
CHALLENGE NATURE OF REMEDIAL ACTION
CHALLENGE
• Declining/ no allocation of the Equitable Budget/ Finance • PEDs are to allocate Equitable Share.
Share toward Infrastructure Delivery poses • Delay projects on pre-construction stage to
1.
pressure on the Education Infrastructure commence to construction, whilst awaiting for
Grant. adjustments.
• Delay payment to contractors resulting in • Monitor the submission of the invoices of the
sites been abandon. work done by the IA to ensure that work on
ground is equivalent to the expenditure.
• PEDs and the IA to reconcile figures on monthly
bases.
• Lack of Programme Management System IT • Deployment and the implementation of a
with reliable data information to enhance transversal system (EFMS) by all the PEDs to
2.
the planning and delivery of the required manage the data.
Infrastructure timeously • PEDs to increase the IT capacity to house the
system.
• Excessive number of schools requiring Planning • Re-alignment and reprioritisation of all the
maintenance projects earmarked for maintenance to comply
3.
with the DoRA condition of the 30% allocation
towards the programme.
• PEDs to ensure that projects are assessed to
avoid duplications or over emphasis on the same
schools.
• Non- compliance with SCM processes Procurement • PEDs to conduct quarterly audits to ensure
resulting in irregular expenditure by the compliance on all the process.
4. 45
Implementing AgentCHALLENGES & REMEDIAL ACTION
(….CONTINUE)
CHALLENGE NATURE OF REMEDIAL ACTION
CHALLENGE
• Late appointment of service providers Programme/ Project • Approval of projects for implementation by the
(contractors) by the Implementing Agent Management PED’s prior to the commencement of
5.
for projects that were already planned and implementation.
designed in previous financial years. • The internal capacity through works inspectors
• IA’s lack of capacity resulting in extension closely monitors the projects under
of times, variations orders and delayed implementation.
occupation of the asset, • Monthly progress meeting with IA’s to improve on
• Inaccurate reporting and poor project and reporting and to mitigate any challenges.
programme management. • Stricter enforcement of timeframes as proposed
• Contractors lack of capacity resulting in by FIPDM schedule and the projects reassigned to
poor quality of infrastructure. IA’s that have the capacity to delivery.
• The IAs not meeting the milestone and • Amendment of the SLA’s to ensure that all
expenditure targets as per IPIPs engagements are regulated in order to be able to
• The contractual obligations not carried out enforce of penalties on non-performing.
as per the signed SLA with the • Withdrawing and re-allocation of projects to
implementing agents other performing Implementing Agents.
• Project disruptions by Business Forums Programme/ Project • Continuous engagement with Local Community
and Local Communities Management and Political Leadership to address the identified
• Volatility of the construction industry challenges.
leading to many companies going under • Effective and close project monitoring and
and others filing for Business Rescue forecasting of trends
46BACKGROUND
• The audit revealed that 3898 (desktop study) schools
still have inappropriate sanitation facilities.
• An allocation of R2.8 billion has been allocated for the
SAFE Initiative over the MTEF as follows:
– 2019/20 : R700 000 000.00
– 2010/21 : R800 000 000.00
– 2021/22 : R1 300 000 000.00
• The SAFE Initiative will be implemented through:
– Provincial EIG allocation
– Partnerships/Donations
– SAFE Initiative Allocation
48AUDIT (PIT LATRINES)
49AUDIT: KWAZULU-NATAL
AUDIT: EASTERN CAPE
FINANCIAL REPORT – SAFE ALLOCATION
IA        No. of     Estimated Total     Paid   Invoice at hand    Comments
          Projects   Budget              to
                                         date
DBSA      240        R 256, 197,789.95   R0     R 126 410 728.11   Awaiting supporting documents
                                                                   from the IA. (Tranche payment)

DEA       58         R 63 729 187.69     R0     R0                 DEA is awaiting for National
                                                                   Treasury to approve deviation
                                                                   from normal procurement
                                                                   process before any invoice can
                                                                   be generated.

The Mvula 187        R 268 531 197.17    R0     R 11 847 646.58    Awaiting supporting documents
Trust                                                              from the IA.
                                                                   (Assessment reports - Planning)

NECT      121        R 100 685 316.15    R0     R 40 274 126 .46   Awaiting National Treasury
                                                                   approval to extend the scope of
                                                                   work for NECT. (Tranche
                                                                   payment)
TOTAL     606        R 689 143 490.96    R0     R 178 532 501.15   26%52of invoice at hand
PROGRESS ON VERIFICATION
Province No. of Verification Balance Comments
Schools
Verified PIT Proper
Sanitation
EC 1598 359 305 54 1239 Further verification to commence mid
October.
FS 156 0 - - 156* No verification will be carried-out as the
province is implementing all the projects.
KZN 1365 335 255 80 668 362 Schools will not be verified, the province
(1030) has allocated the projects to be implemented
with EIG allocation.
LP 507 259 217 42 248 All the schools will be verified by the end of
October
MP 127 88 - - 39* 39 Schools will not be verified, the province is
implementing all the projects with EIG
allocation.
NW 145 137 66 71 8 Verification to be completed by 8 October.
TOTAL 3898 1205 843 247 2136
• FS & MP all the schools will be implemented with the EIG.
• 606 of the 843 schools are currently under implementation.
53PROJECTS UNDER IMPLEMENTATION
SAFE ALLOCATION & EIG
Province No. of Projects Planning Construction
EC 262 262 0
FS 148 80 68
KZN 402 372 30
LP 162 162 0
MP 33 4 29
Total 1007 880 127
• 880 Projects are currently under planning and design phase.
• 127 Projects are currently under construction.
54COMPLETED PROJECTS
Province No. of Projects Donor EIG & ASIDI
EC 11 4 7
FS 29 29
KZN 93 2 91
LP 35 3 32
MP 20 9 11
TOTAL 188 18 170
• To date 188 Schools have been provided with adequate sanitation.
55CHALLENGES / REMEDIAL ACTIONS
CHALLENGES REMEDIAL ACTION
• Planning and implementing within • All the projects for the next financial
the same year is the major cause of year will be allocated to the IAs at
delay. the beginning of the fourth quarter,
for planning to commence within the
current financial year.
• The procurement process is delaying
the commencement of construction.
• To ensure that implementation
commences at the beginning of the
financial year.
• Project monitoring to ensure that all • Increase the capacity to monitor
projects are completed in time and project implementation.
the quality is up to standard.PROJECT PHOTOS
SEKANEKAMOYI PRIMARY SCHOOL
57PROJECT PHOTOS
MAMAILA PRIMARY SCHOOL
58PROJECT PHOTOS
PAAPA PRIMARY SCHOOL
59PROJECT PHOTOS
TSHINANGE PRIMARY SCHOOL
60PROJECT PHOTOS
RAMOTLHATSWANE PRIMARY SCHOOL
61PROJECT PHOTOS
SEKANEKAMOYI PRIMARY SCHOOL
62DEDENI JSS - SANITATION
63ASSUPOL DONATION
Maaphoko LPS Govani
Ntlhodumela PS Govani PS
64PLANS TO IMPROVE INFRASTRUCTURE
PLANNING AND DELIVERY
PLANNING, DELIVERY AND MAINTANANCE
▪ Integrated National School Infrastructure Sector Plan: All schools in the country profiled in
terms of their infrastructure needs in line with Norms and Standards;
▪ Revise Education Infrastructure Delivery Model: This delivery model will address:
▪ Expediting delivery of infrastructure projects,
▪ Controlling the cost of providing education infrastructure and;
▪ Improve Contracts Management Processes;
• Standard Floor Layout Plans and Technical Specifications : Develop standardised plans
and specifications for all Education Facilities (Primary Schools, Secondary Schools, Learner
Boarding Facilities, District and Circuit Offices);
• Establishment of an Education Infrastructure Planning & Management Agency / Bureau:
Infra Bureau/Agency to be set up at national level to centrally facilitate and co-ordinate all the
macro and micro planning processes, implementation, monitoring and evaluation of all
65
infrastructure projects in the Basic Education Sector.PLANNING, DELIVERY AND
MAINTANANCE
• Revise project prioritization model to use condition
assessment as a determinant for Project Priority List.
• Utilization of data from STATS SA , like population trends
at a local level, to ensure that size of schools built
addresses the current and future population dynamics;
• Review of SLA’s/MOA’s with IA’s to impose penalties for
non-compliance with progress delivery, deduct management
fees for non compliance or withdraw projects as a result of
poor performance.
• Strengthen Contract Management and Monitoring
processes on infrastructure delivery.
66PLANNING, DELIVERY AND
MAINTANANCE
• Strengthen internal Technical Capacity to implement projects, ensuring:
- Qualified and Professionally Registered key personnel;
- Accredited Project Managers;
• Employee retention strategies for attracting and retention of built
environment professionals:
– Revise remuneration scales for professionals;
– Improve working conditions and provision of tools of trade;
• Increase the use of alternative building technologies for quicker
construction;
• Benchmark with other role players like independent schools to reduce
the cost of building schools;
67FUNDING AND PARTNERSHIPS
• Provinces to ensure that sufficient funding is allocated to the Equitable Share
and ring fence such funding for infrastructure;
• Condition Grant allocations (EIG) to be ring-fenced and used solely for the
intended purpose, as a condition of the grant;
• EIG Funding allocations to be per project on the basis of an approved Business
Case and progress on projects implemented;
• Diversified funding modalities for school infrastructure:
• Public-Private Partnerships (Build, Operate & Transfer – BOT);
• Donor and Grant funding;
• Rand-for-Rand Public-Private Partnerships;
• Partnerships with Institutions of Higher Learning and Non-governmental Organizations.
68RECOMMENDATION
It is recommended that the
Portfolio Committee discusses
the progress report on
Infrastructure planning and
delivery as well as SAFE.
6970
You can also read