University entry & the class of 2021 - Who is set to miss out An AccessHE Report
←
→
Page content transcription
If your browser does not render page correctly, please read the page content below

An AccessHE Report

                             University entry
                           & the class of 2021
                                           Who is set to miss out

                                                      AccessHE is part of London Higher

An AccessHE Report
Dr. Graeme Atherton and Dr. Tuba Mazhari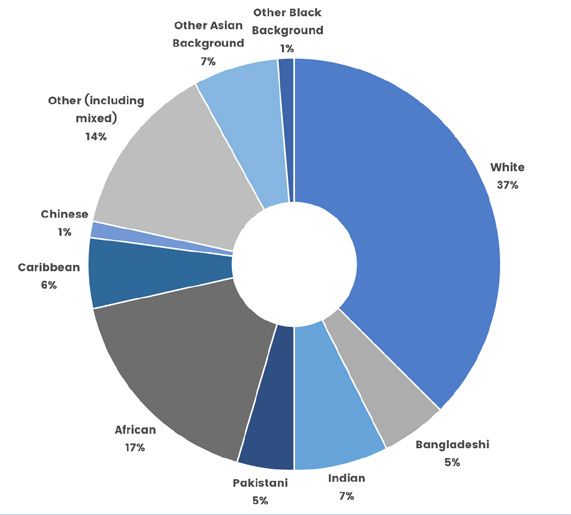
University entry and the class of 2021: Who is set to miss out

      Authored by: Dr. Graeme Atherton and Dr. Tuba Mazhari

                                                 02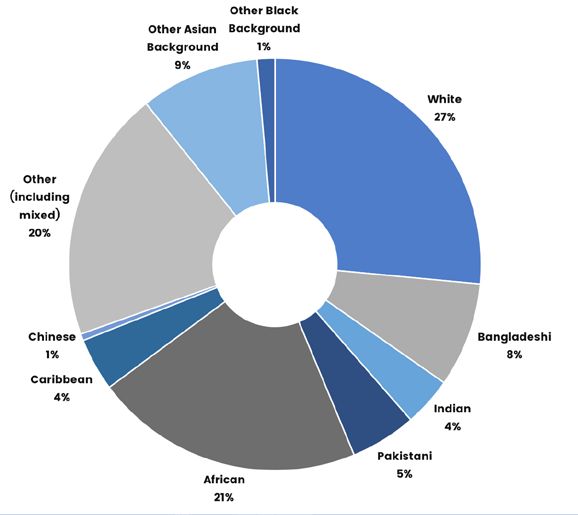
An AccessHE Report

     Contents
Executive Summary                                                    04

1. Introduction                                                      05

2. Higher Education in London – the extent of diversity              06

3. Data and Methods                                                   07

4. Progression to Higher Education in London –                       08
   qualification profiles and ethnicity

5. Progression to Higher Education in London –                        11
   qualification profiles and socio-economic background

6. Progression to Higher Education in London and the AAB Threshold    13

7. Progression to Higher Education nationally –                       16
   qualification profiles, BAME and socio-economic background

8. Key Findings                                                       17

9. Recommendations                                                    18

                                          03
University entry and the class of 2021: Who is set to miss out
Executive Summary
Background Key Findings
This report examines how students Due to the learning loss associated with COVID-19:
from different ethnic and lower socio- Finding 1: With a one grade decline in
economic backgrounds entering higher achievement over 5000 fewer students from
education in 2021 may have their London may be able to enter HE in 2021.
progression affected by the ‘learning Finding 2: Of these 5000 students, nearly 75%
loss’ associated with COVID-19. It looks are from BAME backgrounds and a quarter are
primarily at the entry qualification from Black African backgrounds.
profiles of students from London by Finding 3: With a one grade decline in
background and calculates what the achievement over 5200 students from BAME
impact on participation may be if backgrounds in London risk missing out on
students achieve lower A-level grades places at high tariff or Russell Group institutions.
because of the learning loss associated
Finding 4: Over 60% of the students who are
by COVID-19. It then uses the data for most at risk of losing a place in higher education
London students to extrapolate potential from London due to a one grade decline in
national progression scenarios. It achievement in 2021 are from the poorest areas
shows that as with the impact of COVID as measured by Index of Multiple Deprivation.
-19 on the health and educational Finding 5: If the grade profiles of BAME
achievement, those from lower socio- students nationally follow those in London with
economic and BAME backgrounds a one grade decline in achievement over 27,000
experience greater disadvantage. students are at risk of missing out on places
and nearly 11,000 from BAME backgrounds.
The data analysed in this report covers A-Level
Finding 6: With a two grade decline in
applicants domiciled in London aged 18-24
achievement a further 11,000 students from
covering the period 2015-16 to 2019-20. It
London would be at risk of losing out on higher
models the potential impact of learning loss
education places and a further nearly 50,000
in terms of a lowering of achievement of one
students nationally.
grade. Using this historical data which shows
qualification profiles by background the analysis
focuses on the potential impact of a one grade Recommendations
learning loss on students receiving E grade and
those at receiving AAB/ABB. For those with one Recommendation 1: Form a special cross
E grade a one grade loss in achievement would sector taskforce to include universities and
mean they would then have only 2 A Level schools/colleges and students to ensure that
passes thus heightening the risk of missing out the class of 2021 are not unfairly disadvantaged
on higher education entry. For those with AAB/ in progressing to higher education and receive
ABB a one grade loss in achievement would the support they need.
mean their chances of entering a higher tariff Recommendation 2: Universities to account
university would be significantly reduced. for potential learning loss in offer making to
students in 2021, particularly to BAME students,
considering how to measure potential in as
broad a way as possible.
Recommendation 3: Undertake detailed
analysis of national qualification entry profiles by
social background for students entering higher
education in 2021 and 2022 for all qualification
routes, including those not taking A-Levels.
Recommendation 4: Extend the recently
launched National Tutoring Programme to Level
3 learners post 16.
Recommendation 5: Fund additional higher
education information, advice and guidance for
the class of 2021.
Recommendation 6: Government to consult
with schools/colleges/universities and students
regarding using teacher predictions rather than
examinations to construct A Level grades in 2021.
04An AccessHE Report
1. Introduction
There is an emerging volume of evidence documenting the potential impact of
COVID-19 on the educational outcomes of pupils in compulsory schooling from lower
socio-economic backgrounds1. To the extent that pupils from Black and Minority
Ethnic backgrounds are disproportionately represented in low income groups
COVID-19 may have a greater impact on such pupils2. Pupils from BAME backgrounds
also have to contend with the greater impact of the disease on their families and
community3. A further area in which low income and BAME students may experience
potential greater disadvantage however, is in relation to their participation in higher
education (HE) in 2020-21 and subsequent years.
This report primarily examines how students The danger identified in this report is that
from different ethnic and lower socio-economic learners from BAME and lower socio-economic
backgrounds entering higher education from backgrounds are more likely to have their
London may have their progression affected HE progression opportunities constrained
by COVID-19. It looks at the entry qualification by COVID-19. In order to mitigate this threat
profiles of students by background and specific support measures need to be put in
calculates what the impact on participation place to support the attainment of this year’s
may be if students achieve lower A-level grades A-Level (and Level 2 vocational cohort) and
because of the learning loss associated by universities need to build into their offer making
COVID-19. This analysis builds on that undertaken strategies for 2020-21 the potential impact of
for the 2018 AccessHE report ‘Preparing for hyper- COVID-19.
diversity: London’s student population in 2030’4.
The insights from examining London learners
potential HE progression patterns is used to
explore national implications for progression by
BAME background.
1. Willis, C. (2020) The impact of Covid-19 on children’s learning, London: NFER – see https://www.nfer.ac.uk/news-events/nfer-blogs/the-impact-of-covid-19-on-children-
s-learning https://www.suttontrust.com/wp-content/uploads/2020/06/Early-Years-Impact-Brief.pdf
2. see Willis, C. (2020)
3. Public Health England (2020) Disparities in the risk and outcomes of COVID-19 - see
https://assets.publishing.service.gov.uk/government/uploads/system/uploads/attachment_data/file/908434/
4. Atherton, G. & Mazhari. T. (2020) ‘Preparing for hyper-diversity: London’s student population in 2030’, London: London Higher
05University entry and the class of 2021: Who is set to miss out
2. Higher Education in London –
the extent of diversity
Our first report in 2018 highlighted the ‘hyperdiversity’ amongst young students
entering higher education from London. This hyperdiversity is in part a function of
the high numbers of residents from different ethnic backgrounds relative to the rest
of the United Kingdom, but also reflects the high levels of attainment at GCSE level of
certain BAME groups.5, the higher proclivity to progress to higher education amongst
such groups6 and to an extent the concentration of higher education providers in
the capital. The consequence of these differences in demographic increase when
combined with a participation rate, which over time is increasing for most non-white
groups while is close to static for white young people, is increasing diversity amongst
students entering higher education from London as Diagram 1 below shows.
Diagram 1: A comparison of the composition of the student body (aged 18-24) by ethnicity, in 2016 and 2030
2016 2030
N=67020 N=105110
This diagram illustrates that white students The Preparing for Hyperdiversity report also
still constitute by some the largest single examined projected increases in participation
group of young students from London entering amongst those whose parents did/did not go
higher education. But by 2030 diversity to higher education and by free school meal
will have significantly increased with the background. These learner characteristics
number of students from other (including are not examined in this report. However, the
mixed) backgrounds and from Black African relationship between A level achievement and
backgrounds especially increasing markedly. Index of Multiple Deprivation is examined.
5. - see https://www.ethnicity-facts-figures.service.gov.uk/education-skills-and-training/11-to-16-years-old/gcse-results-attainment-8-for-children-aged-14-to-16-key-
stage-4/latest
6. Crawford, C. and Greaves, E. (2015) Socio-economic, ethnic and gender differences in HE participation BIS Research Paper 186 London: BIS
06An AccessHE Report
3. Data and Methods
The data to undertake the analysis in this report was purchased from UCAS. This
data includes A-Level applicants domiciled in London aged 18-24 covering the
period 2015-16 to 2019-20. Over the course of the report these students aged 18-24 are
described as young students.
Data on HE participation among older students It is also important to state that the data
is relatively limited. Moreover, projections of purchased from UCAS showed that there were
demographic change are less accurate when over 23,000 young students entering HE from
made for a wider age group. Data of this nature London who either did not take A-Levels or who
are also not available by disability status. Thus we do not have grade profile information on. So,
our decision to focus on younger students while this report looks at the majority of young
exclusively is based on data and methodological students entering HE from London there is a
constraints, rather than a reflection of greater large number whom we need to understand
importance placed on the HE progression of more about.
younger, able-bodied students.
07University entry and the class of 2021: Who is set to miss out
4. Progression to Higher Education
in London – qualification profiles
and ethnicity
There have been several attempts to estimate the magnitude of the loss of learning
amongst those in compulsory education from March to July 2020 as a result of
COVID-19 in terms of time. The National Foundation for Educational Research
(NFER) undertook a national survey in July 2020 sent to over 20,000 state-funded
mainstream primary and secondary schools in England receiving responses from
898 secondary schools. On the basis of the survey they estimated that the perceived
learning loss in the most deprived schools was approximately 3.7 months, compared
to 2.4 months in the least deprived schools.7 These time estimates have not been
equated to a potential impact on actual attainment – although research from the
Education Endowment Foundation produced in June 2020 estimated that the gap
between learners from different backgrounds will increase.8
It is difficult then at this point (in October 2020)
Table 1: The percentage of young students
to calculate a clear estimate of the impact of
entering higher education in 2019-20 from
COVID-19 on the grades that students might
London receiving at least one E grade
obtain at A-Level in summer 2020. Hence, for the
purposes of deriving an estimate of a change
in actual numbers entering higher education
% of students
from London due to COVID-19 it is assumed receiving
that the loss in learning will lead to students at least one
achieving one grade lower than what they Ethnic Group E grade
would have received. Given the amount of time
Asian - Bangladeshi 16
that learners have missed due to COVID-19
and the ongoing disruption that learners are Asian - Chinese 4
experiencing in academic year 2020-21 a one
grade decline in achievement would seem to be Asian - Indian 12
a suitable assumption, which if anything may be
conservative. Asian - Other Asian background 15
Asian - Pakistani 16
The analysis then concentrates on students
entering higher education receiving at least one
Black - African 20
E grade and what would happen if they then
went from a grade E to a U. This would leave Black - Caribbean 19
them with only 2 A Levels and E or above. It is
possible of course to enter higher education with Black – Other black background 15
2 A-Levels or less. Admission decision are at the
behest of the higher education provider. However, Mixed - Other mixed background 10
only 2 passes at A Level would significantly
disadvantage learners attempting to enter HE. Mixed – White & Asian 7
Mixed - White and Black African 15
In Table 1 below the percentage of young
students from London entering higher education Mixed – White & Black Caribbean 12
who have at least one E grade is outlined.
Other ethnic background 16
White 8
7. Sharp, C. (2020) The challenges facing schools and pupils in September 2020. London: NFER - see
https://www.nfer.ac.uk/media/4119/schools_responses_to_covid_19_the_challenges_facing_schools_and_pupils_in_september_2020.pdf
8. Education Endowment Foundation (2020) Rapid evidence assessment Impact of school closures on the attainment gap – see https://
educationendowmentfoundation.org.uk/public/files/REA_-_Impact_of_school_closures_on_the_attainment_gap_summary.pdf
08An AccessHE Report
As can be seen there are some quite significant Once the ‘learning loss’ is factored in the picture
differences by ethnic group with the percentage looks markedly different. Overall participation
of students with at least one E grade ranging from has reduced by over 5000 students compared
4% for Chinese young people to 20% for Black to the numbers of participants in 2019. At the
African young people. It is noticeable that white time of writing the numbers of students entering
students appear to have relatively fewer students higher education from London in 2020 is not
in this category than all the other groups with the available. However the data that is available
exception of the Chinese/White & Asian. nationally from UCAS shows that the numbers
of students entering higher education in 2020
In Table 2 below the potential impact of in England is likely to be higher than it was in
students with at least one E grade receiving an 201910. Therefore, it is reasonable to assume
ungraded/unclassified mark rather than an E that the fall in participation in 2021 may be even
grade on participation by ethnic group on 2021 larger when compared to 2020 than 2019 if
higher education entry is outlined. As described results return to the 2019 trend.
above the assumption is that the consequence
of moving to 2 A levels is that a student will not Where different ethnic groups are concerned
enter higher education. though the potential reduction in higher education
participation is even more striking. The reduction
The table shows the predicted change in in the number of Black African students is almost
participation by ethnic group that would occur the same as that of white students even though
without the COVID-19 learning loss as a result overall there are nearly three times as many white
of demographic change and changes in the as Black African students progressing to higher
higher education participation rate of the group. education. There also noticeable reductions in the
With the exception of Black Caribbean students number of Bangladeshi, Indian and other ethnic
there is a predicted increase in participation for group students entering higher education as a
every ethnic group and overall a slight rise of result of COVID-19.
around 600 students.
Table 2: Impact of Covid-19 on number of young students entering higher education from London in 2021
by ethnic group
loss of one grade )
‘learning loss’ 2021
HE entry rate from
after learning loss
(without learning
Projected number
obtaining at least
1 E grade 2019-20
change to 2020-
entry in 2021 (%)
Total number of
students in 2021
of students 2021
students due to
Total expected
Total expected
students 2019-
for 2020-21 (%)
demographic
% of students
change in HE
change in HE
Reduction in
entry in 2021
Numbers of
number of
2021(%)
Rate of
2020
Ethnicity
Asian – Bangladeshi 2795 3 0.05 3.05 85 2880 0.16 461 2419
Asian - Chinese 595 0.5 -0.02 0.49 3 597 0.04 24 573
Asian - Indian 3710 1.07 -0.01 1.07 40 3749 0.12 450 3300
Asian - Other Asian
3560 1.63 0.03 1.67 59 3619 0.15 543 3077
background
Asian - Pakistani 2360 2.5 0.03 2.53 59 2419 0.16 387 2032
Black - African 6830 1.9 0.03 1.95 133 6962 0.20 1393 5570
Black - Caribbean 1515 -0.003 -0.04 -0.04 -1 1514 0.19 288 1227
Black - Other Black
365 1.61 -0.02 -0.02 6 370 0.15 56 315
background
Mixed - Other mixed
1420 2.65 0.04 0.04 38 1458 0.10 146 1312
background
Mixed – White and Asian 1280 2.65 0.05 0.05 34 1314 0.07 92 1222
Mixed - White and
535 2.65 0.04 0.04 14 594 0.15 82 467
Black African
Mixed - White and
845 2.65 0.04 0.04 23 867 0.12 104 764
Black Caribbean
Other ethnic background 2920 2.65 -0.01 2.64 77 2997 0.16 480 2518
White 17680 0.79 -0.01 0.78 137 17817 0.08 1425 16392
All students 46410 707 47157 5931 41189
10. See – (UCAS 2020) More Students from the disadvantaged backgrounds across the UK are set to start degrees this autumn, 24th September 2020 - see
https://www.ucas.com/corporate/news-and-key-documents/news/more-students-most-disadvantaged-backgrounds-across-uk-are-set-start-degrees-autumn
09University entry and the class of 2021: Who is set to miss out
Widening the parameters of the model
The parameters of the model above could
Table 3: Average number of students per
be widened to identify what may happen
year 2015-16 to 2019-20 with one D grade
if learning loss was defined as a decline in
(no E grade)
achievement by 2 grades. Given the ongoing
disruption to present delivery of education and No of students
the extent of the time lost in 2020 already due with at least
to the pandemic such an outcome is certainly Ethnic Group one D grade
conceivable. Table 3 below shows the number Asian - Bangladeshi 710
of students who have received D grade only
(not including those who have received E Asian – Chinese 85
grades counted in Table 2 above). In the
event of a decline in achievement of 2 grades Asian - Indian 600
affecting their D grade these additional students
Asian - Other Asian background 825
would then fall into the 2 E only category and
be at greater risk of losing out on a higher
Asian - Pakistani 625
education place or having their choices severely
curtailed. Black - African 2170
Black - Caribbean 435
Black – Other black background 115
Mixed - Other mixed background 355
Mixed – White & Asian 195
Mixed - White and Black African 135
Mixed – White & Black Caribbean 265
Other ethnic background 610
White 2985
TOTAL 10,110
10An AccessHE Report
5. Progression to Higher Education
in London – qualification profiles
and socio-economic background
A range of indicators are used to understand differences in participation by socio-
economic background in England. The one favoured by the Office for Students is the
Participation in Local Areas (POLAR) measure. The POLAR measure classifies areas
across the UK based on the proportion of the young population that participates in
higher education. POLAR classifies local areas into five groups – or quintiles – based
on the proportion of 18-year olds who enter higher education ages 18 or 19 years
old.11 The use of POLAR as a metric to describe socio-economic disadvantage is
problematic anyway and research has suggested that the majority of young people
in the lowest POLAR participation quintiles may not be from the poorest households.12
It is stated by the Office for Students that as POLAR is a measure of educational
and not socio-economic disadvantage this may not be so relevant as it appears.13
Aside from this issue which is taken up in more detail in other reports produced
by AccessHE, the specific problem with POLAR for London is that as the capital
has relatively high levels of HE participation overall less than 2% of students are
progressing to HE from the lowest participation quintile. In order therefore to try and
understand the relative impact of any learning loss on HE participation by socio-
economic background in London another indicator is needed.
The Index of Multiple Deprivation 2015 is the In Table 3 below students from London entering
official measure of relative deprivation for HE for the period 2019-20 have been differentiated
small areas (or neighbourhoods) in England. by IMD quintile with IMD quintile 1 being the most
It ranks over 32,000 small areas in England deprived areas and then IMD 5 the least deprived.
in order of deprivation.14 It combines seven Table 4 shows that the percentage of students
different ‘domains’ of deprivation which are with at least one E grade in is highest for IMD 1
given different weights to reflect their relative learners and then decreases so that for IMD 5
importance. The domains are employment, learners they are almost a third as likely to enter
education, health, crime, barriers to Housing HE with one E grade.
and Services and living environment. IMD does
suffer from the same general critique levelled
at POLAR i.e. it is a geographical measure and Table 4: The percentage of students
therefore cannot offer any certainties regarding entering HE with at least one E grade by IMD
the actual economic situation of those who live quintile in 2019-20
in a particular IMD are no matter how small
they may be. However, it does allow in the % of
London case some form of differentiation of Index of Multiple students receiving
learners by a proxy measure of socio-economic Deprivation quintile at least one E grade
background. IMD quintile 1 17
IMD 2 15
IMD 3 12
IMD 4 8
IMD 5 6
11. Atherton, G., Boffey, R & Kazim T. (2019) POLAR Opposite: How the targeting of learners for widening access to HE work could be improved, London: London Higher
Atherton et al (2019)
12. Boliver, V, Gorard, S. & Siddiqui, N. (2019) Using contextualised admissions to widen access to higher education: a guide to the evidence base – see - https://www.dur.
ac.uk/resources/dece/ContextualisedHEadmissions.pdf
13. Atherton et at (2019)
14. see https://www.gov.uk/government/statistics/english-indices-of-deprivation-2019
11University entry and the class of 2021: Who is set to miss out
In Table 5 below the potential implications for the numbers of students from London entering HE
from different IMD quintiles who have at least one E grade of a loss of one grade is presented.
It shows that of the projected 5444 fewer students who it is predicted will enter HE in 2021-22 than
would have been the case without the impact of Covid-19, nearly 60% come from IMD quintiles 1
and 2.
Table 5: Impact of Covid-19 on number of young students entering higher education from
London in 2021 by IMD quntile
Total number of students in
2021 (without learning loss
% of students obtaining at
Number of applicants lost
Number of students 2019-
Total expected change in
due to drop in one grade
Total change - expected
least 1 E grade 2019-20
change in HE entry in
Rate of demographic
change to 2020-2021
Projected number of
students 2021 after
HE entry rate for
HE entry in 2021
of one grade )
2020-2021 (%)
learning loss
2021 (%)
2020
(%)
IMD Quintile
Overall 44435 714 45159 5444 39705
IMD1 6975 1.21 0.91 2.12 148 7123 0.17 1211 5912
IMD2 12895 1.21 1.38 2.59 334 13229 0.15 1984 11245
IMD3 9875 1.21 0.36 1.57 155 10030 0.12 1204 8826
IMD4 7915 1.21 -0.66 0.55 44 7959 0.08 637 7322
IMD5 6775 1.21 -0.72 0.49 33 6808 0.06 408 6400
12An AccessHE Report
6. Progression to Higher Education
nationally – qualification profiles,
BAME and socio-economic background
The focus of the report thus far has been on the progression of learners from London
into HE and the potential impact of learning loss associated with Covid-19. If the
data was obtained then it would be possible to do a similar analysis to model the
potential impact on HE participation nationally.
6.1 Participation of BAME students
Publicly available data does
Diagram 2: Average point score by ethnicity (all level 3 qualifications) 2019
suggest that though that it
is those learners from BAME
backgrounds overall, and in All 33.42
particular from certain non-
Asian 31.29
white ethnic groups who are
most at risk and also those from Bangladeshi 30.29
lower socio-economic groups.
Indian 33.69
Diagram 2 below is taken Pakistani 29.32
from data produced by
the Department of Education. Asian Other 31.69
It shows there are distinct
Black 28.74
differences in average point
scores for all Level Black African 28.98
3 qualifications.
Black Caribbean 27.89
Black Caribbean students Black Other 28.59
had the lowest average point
Chinese 37.98
score (27.89), excluding White
Irish Traveller students. Black Mixed 32.47
African students, a group
who the London analysis Mixed White/Asian 34.68
appeared more exposed to Mixed White/
31.06
Black African
a small decline in average
Mixed White/
performance at A Level Black Carribean
29.98
also had one of the lowest 32.81
Mixed other
average point scores. Data is
also available just for A Level White 32.65
performance. The picture here
White British 32.65
is similar to that for all Level
3 qualifications. Aside from White Irish 34.22
Gypsy Roma and Traveller
Gypsy/Roma 28.58
students, it is Black Caribbean,
Black African and Black other Irish Traveller 23.47
students who have the lowest
32.57
average point scores. White Other
Other 31.32
Although the data outlined in
Diagram 2 is not as granular Unknown 38.29
as that for London it does 0 5 10 15 20 25 30 35 40
show that Black students
in particular are those who
having the lowest average
scores are likely to be more
at risk of not achieving the
grades necessary to enter HE
in 2021-22.
13University entry and the class of 2021: Who is set to miss out
It is possible however to explore the potential less students in each group nationally with E
impact of a one grade decline in achievement grades than in London. It does establish though
on the progression of students from different that overall London is not significantly out-
ethnic backgrounds in more detail. In Table performing the country at A Level on average.
6 below the numbers of students who took A
Levels in 2018-19 are shown (data for this year is The other important point to note is the
shown as it is the most recent data available). If numbers of students from non-white ethnic
it is assumed that the same % of these students groups who are doing A Levels who come from
achieve one E grade as for London students, London. Table 6 also shows the numbers of
the impact of these students then achieving students entering HE by ethnic background
a grade less is shown. It would mean nearly from London. Comparing this to the number
28,000 students who fall into the 2 A-Level of students who completed A Levels by ethnic
group and hence are at much greater risk of not background in 2018 nationally in column 4
entering HE. Of this 28,000 over 11,000 are from it is clear that they represent a significant
BAME groups. percentage of all students taking A-Levels
for each non-white BAME group. In the case
In terms of the strength of these projections of Black African and other Asian background
there are clear limitations as the data on A students it is around 50%.
Level grade profiles nationally had not been
analysed as it was for London. What is known In addition, Table 6 includes the projected
is that the Average Point score for London additional impact of a reduction in 2 grades
students at A Level is slightly lower than the on participation nationally assuming that
national average15. It cannot be deduced from the different ethnic groups have the same
this information whether there are more or percentage of D grade students as in London.
Table 6: Possible impact of COVID-19 learning loss on national HE participation
% of students No of students No of students
in receiving at entering HE taking A–Levels Impact of a re- Impact of a
least one E grade 2018-19 2018-19 duction of reduction in 2
Ethnic Group (London) (London) (National) one grade grades
Asian - Bangladeshi 16 2310 6307 1,009 1576
Asian - Chinese 4 575 1,791 72 250
Asian - Indian 12 3570 11,155 1,339 1784
Asian - Other Asian background 15 3210 6,466 970 3815
Asian - Pakistani 16 2080 12,635 2021 925
Black - African 20 6075 11,923 2385 555
Black - Caribbean 19 1450 3,192 607 1264
Black – Other black background 15 295 1,792 269 498
Mixed - Other mixed background 10 1235 5,057 506 400
Mixed – White & Asian 7 1085 3,322 233 929
Mixed - White and Black African 15 445 1,600 240 1007
Mixed – White & Black Caribbean 12 730 2,997 360 34847
Other ethnic background 16 2520 5,200 832 1576
White 8 17,450 204,984 16,398 250
TOTAL 43,030 278,421 27,241 47850
15. Department of Education (2019) A level and other 16 to 18 results: 2018 to 2019 (provisional) London: Department of Education - see https://www.gov.uk/government/statistics/a-level-and-other-16-to-18-results-
2018-to-2019-provisional
14An AccessHE Report
6.2 Participation of students from lower socio-economic backgrounds
In terms of HE entry by proxy measures of socio-economic background nationally data is
available on achievement differences by learners from disadvantaged and non-disadvantaged
backgrounds.16 This data is available for learners taking A Levels and also applied general students.
As shown in Table 7 below, disadvantaged students have lower average point scores that non-
disadvantaged students – in particular those who are taking A Levels.17
Table 7: Grades by disadvantaged status 2018-19
Disadvantaged Non-Disadvantaged
Cohort Attainment measures Students Students
A-Level APS 28.70 33.58
Grade C C+
Applied General APS 27.72 29.26
Grade Merit+ Merit+
Tech Levels APS 26.80 29.20
Grade Merit+ Merit+
Given that the disadvantage measure used nationally and the IMD measure used in the analysis
clearly differ any kind of extrapolation of London qualification profiles to a national data set is not
possible. It is clear from Table 7 though that students from disadvantaged backgrounds are at
greater risk of either missing out on HE or having their choices restricted if there achievement levels
in 2021 fall further due to Covid-19.
16. Disadvantaged learner are defined as those who…
17. Revised A level and other 16-18 results in England, 2017/2018 – see
https://assets.publishing.service.gov.uk/government/uploads/system/uploads/attachment_data/file/859515/2019_revised_A-Level_and_
other_16_to_18_results_in_England.pdf
15University entry and the class of 2021: Who is set to miss out
7. Progression to Higher Education in
London and the AAB Threshold
Whilst a learning loss may have the most acute impact on those students whose
qualification profiles are likely to include E grades it will also impact on learners
across the qualification range. Of particular interest are those students who may
be achieving AAB/ABB at A Level as this is a critical level of achievement where
entry to more selective universities is concerned. The qualifications required to
enter such universities differ by institution and course. Previous work has identified
however the importance of these qualification levels in entry to high tariff and
Russell Group universities, therefore the impact of a one grade loss in attainment
on learners achieving these grade will be modelled for students from different
BAME backgrounds and IMD quintiles using these figures.
It is important to attempt to understand
the impact of a Covid-19 learning loss on Table 8: Number of young students with
participation in higher tariff universities. AAB and ABB grades entering higher
Evidence shows that BAME students, those education from London in 2019-20
from lower participation neighbourhoods and
those from free school meal backgrounds
are less likely to enter such universities than No with No with
other types of institution18. Table 8 below shows Ethnic Group AAB ABB
that it is white students who are most heavily
Asian - Bangladeshi 120 160
represented amongst the students achieving
AAB/ABB. While they represented only a quarter Asian - Chinese 50 50
of the students who were at risk due to having
one E grade in their qualification profile, they are Asian - Indian 210 240
nearly 50% of the students at risk here.
Asian - Other Asian background 170 215
However, there are particular groups,
especially Black African, Indian and other Asian Asian - Pakistani 115 140
background students, who have relatively large
Black - African 250 330
numbers of students who may miss out on
entry to these universities. This would only add Black - Caribbean 50 55
to the diversity challenges that this part of the
HE sector already faces. Table 8 below shows Black – Other black background 10 20
the numbers in 2019-20 achieving AAB/ABB
from London entering HE. Mixed - Other mixed background 55 80
Mixed – White & Asian 85 90
Mixed - White and Black African 30 35
Mixed – White & Black Caribbean 30 45
Other ethnic background 115 160
White 1125 1255
TOTAL 2415 2875
18. BBC News (2018) Five charts that tell the story of diversity in UK universities – see https://www.bbc.co.uk/news/education-44226434
16An AccessHE Report
8. Key Findings
There are limitations to the analysis presented by this paper as the focus is only on
those students for whom we have A-Level qualification profile data for. A significant
number of students entering HE from London who are aged 18-24 qualification
profile data is not available for with many of these entering with vocational
predominantly BTEC qualifications.
Nevertheless, the analysis above shows clearly that for the nearly 45,000 students we do have data
for, it is those from certain BAME backgrounds and those from areas of highest deprivation in London
are most at risk of missing out on higher education participation in 2021, or at best having their
choices further limited.
The potential implications for students from these backgrounds experiencing the impact of
Covid-19 on their learning most acutely are outlined here.
Finding 1: Finding 4:
With a one grade decline in achieivement over Over 60% of the students who are most at risk of
5000 fewer students from London may be able losing a place in higher education from London
to enter HE in 2021. due to a one grade decline in achievement in
2021 are from the poorest areas as measured
Finding 2: by Index of Multiple Deprivation.
Of these 5000 students, nearly 75% are from Finding 5:
BAME backgrounds and a quarter are from
Black African backgrounds. If the grade profiles of BAME students nationally
follow those in London with a one grade decline
Finding 3: in achievement over 27,000 students are at risk
of missing out on places and nearly 11,000 from
With a one grade decline in achievement over BAME backgrounds.
5200 students from BAME backgrounds in
London risk missing out on places at hjgh tariff Finding 6:
or Russell Group institutions.
With a two grade decline in achievement a
further 11,000 students from London would be
at risk of losing out on higher education places
and a further nearly 50,000 students nationally.
17University entry and the class of 2021: Who is set to miss out
9. Recommendations
The projections for London and certainly for England are estimates. Even if
students do achieve lower A Level grades they may still well be admitted to higher
education. According to the Universities UK are ready to be flexible19 and certainly
the majority of institutions will seek to admit as many students as they possibly
can – particularly assuming the impact of Covid-19 on international student
recruitment continues into 2021. However, this report has shown that certain
students are at a high risk of being unable to fulfil their aspirations regarding
entering HE in 2021. The A-Level results crisis of last year showed the problems that
can ensue when assumptions replace actions. Hence, there is a case for action now
to try and ensure that students from all social backgrounds who have the potential
and desire to enter HE in 2021 are definitely able to do so. It is unacceptable to
expose them to the uncertainty that their predecessors had to endure as part of
the 2020 HE admissions cycle. In order to achieve this goal this report makes the
following recommendations:
Recommendation 1: Recommendation 4:
Form a special cross sector taskforce to Extend the recently launched National Tutoring
include universities and schools/colleges and Programme to Level 3 learners post 16.
students to ensure that the class of 2021 are not
unfairly disadvantaged in progressing to higher Recommendation 5:
education and receive the support they need.
Fund additional higher education information,
Recommendation 2: advice and guidance for the class of 2021.
Universities to account for potential learning loss Recommendation 6:
in offer making to students in 2021, particularly
to BAME students and those from lower socio- Government to consult with schools/colleges/
economic groups, considering how to measure universities and students regarding using
potential in as broad a way as possible. teacher predictions rather than examinations
to construct A Level grades in 2021.
Recommendation 3:
Undertake detailed analysis of national
qualification entry profiles by social
background for students entering higher
education in 2021 and 2022 for all qualification
routes, including those not taking A-Levels.
19. UCAS (2020) Universities and Admissions Leaders encourage students to be ambitious with their 2021 applications - see https://www.ucas.com/
corporate/news-and-key-documents/news/universities-and-admissions-leaders-encourage-students-be-ambitious-their-2021-applications
18An AccessHE Report
London Higher, Tavistock House,
Tavistock Square, London WC1H 9JJ

E AccessHE@londonhigher.ac.uk
T 020 7391 0686
  @AccessHE

                                    AccessHE is part of London Higher

www.accesshe.ac.uk
You can also read