Mark Stolper Chief Financial Officer June 2021 NASDAQ: RDNT - RadNet

Page created by Darryl Reyes
 
CONTINUE READING
Mark Stolper Chief Financial Officer June 2021 NASDAQ: RDNT - RadNet
Mark Stolper
Chief Financial Officer
June 2021
NASDAQ: RDNT
Mark Stolper Chief Financial Officer June 2021 NASDAQ: RDNT - RadNet
Safe Harbor

This presentation contains forward-looking statements within the meaning of the U.S. Private Securities
Litigation Reform Act of 1995. Specifically, statements concerning RadNet’s ability to continue to grow the
business by generating patient referrals and contracts with radiology practices, integrate acquired businesses,
recruit and retain technologists, and receive third-party reimbursement for diagnostic imaging services, as
well as RadNet's financial guidance, among others, are forward-looking statements within the meaning of the
Safe Harbor. Forward-looking statements are based on management's current, preliminary expectations and
are subject to risks and uncertainties which may cause RadNet's actual results to differ materially from the
statements contained herein. These risks and uncertainties as well as those risks set forth in RadNet’s reports
filed with the SEC, including RadNet’s annual report on Form 10-K, for the year ended December 31, 2020.
Undue reliance should not be placed on forward-looking statements, especially guidance on future financial
performance, which speaks only as of the date it is made. RadNet undertakes no obligation to update publicly
any forward-looking statements to reflect new information, events or circumstances after the date they were
made, or to reflect the occurrence of unanticipated events.

                                                                                                                  1
Mark Stolper Chief Financial Officer June 2021 NASDAQ: RDNT - RadNet
1 Introduction

2 Diagnostic Imaging Industry Overview

3 Overview of RadNet

4 Financial Information and Core Strategy
Mark Stolper Chief Financial Officer June 2021 NASDAQ: RDNT - RadNet
RadNet Summary

Largest national owner and operator of fixed-site diagnostic imaging centers, with 331 locations
        • Founded as a one center CA operation in 1980
        • Major consolidator in the highly fragmented imaging industry
        • Approximately 25% of RadNet centers are held within joint ventures with large health systems
          (could grow to 50% over the next several years)
        • Ancillary revenue opportunities (Artificial Intelligence, Radiology Software, In-patient Staffing)

Quadrupled size of company since 2006
  • 2021E Revenue(1) = $1.3 billion
        • 2021E EBITDA(1) = $192 million
        • 8,300+ employees in 7 states

Concentrated regional networks in CA, MD/DE, NJ, NY and AZ (343 of our 346 sites)
  • This past quarter, we entered Phoenix, AZ marketplace with Dignity Health JV and Eight Center
    acquisition
        • Strategy is to be the clear leader in regional markets
        • Strategy provides operational efficiencies and marketing/contracting benefits with health plans

(1)
      Midpoint of 2021 revised guidance range.

                                                                                                               2
Mark Stolper Chief Financial Officer June 2021 NASDAQ: RDNT - RadNet
RadNet Summary (continued)

Emphasis placed on scale and “multi-modality” strategy
  • One-stop-shopping for referral sources
  • Lessens our exposure to reimbursement changes; diversifies revenue base

Best positioned company to capitalize on industry consolidation and organic growth opportunities
  • No other fixed site imaging center company is even half the size of RadNet in terms of revenue and
    number of centers

Only imaging center player to provide exclusive managed care capitation arrangements with
prominent medical groups and Independent Physician Associations (IPAs)
  • Over 11% (Pre-COVID) of RadNet Revenue/35+ capitation customers/1.7 million lives under
    management

Significant investments made in Artificial Intelligence solutions through RadNet’s DeepHealth sub
  • FDA approval granted in April for first of two mammography solutions
  • Future focus on algorithms targeting screening for prostate, lung and colon cancers
  • Expected to drive both revenue and cost reductions

                                                                                                         3
Mark Stolper Chief Financial Officer June 2021 NASDAQ: RDNT - RadNet
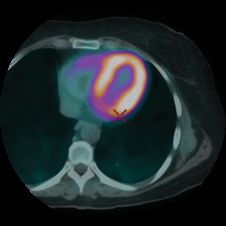
Types of Imaging Exams: Modalities
Advanced Imaging

                        MRI                                                  CT                                                     PET
Produces high-resolution cross-sectional images        Produces high-resolution cross-sectional images.        Determines metabolic activity. Applications:
of soft tissue. Applications: Assesses brain, spinal       Applications: Assesses tumors, strokes,            Assesses tumors, epilepsy and cardiac function.
            cord and interior ligaments.                        hemorrhages and infections.

Routine Imaging

                                          Nuclear Medicine                                             Fluoroscopy
                             Produces images of anatomical structures.                     Video viewing of organs. Applications:
                            Applications: Assesses organ function in heart,                        Real-time monitoring.
                                      kidney, thyroid and bones.

                   Ultrasound                                             Mammography                                                 X-Ray
    Produces visual images of internal organs.             Visualizes breast tissue. Applications: Primary                 Records images of organs and
        Applications: Viewing soft tissue.                        screening tool for breast cancer.                             structures on film.

                                                                                                                                                                5
Mark Stolper Chief Financial Officer June 2021 NASDAQ: RDNT - RadNet
1 Introduction

2 Diagnostic Imaging Industry Overview

3 Overview of RadNet

4 Financial Information and Core Strategy
Mark Stolper Chief Financial Officer June 2021 NASDAQ: RDNT - RadNet
Diagnostic Imaging: A Large and Growing Market

                  Diagnostic Imaging Procedure Volume (1)                                US Imaging Centers (by State and Region, 2013)

                                                                            730
                                                                    712
                                                             695
                                                      678
                                              663
                                635    648
                    622
596        608

                                                             2.5%   2.5%    2.7%
                    2.4%                      2.2%    2.3%
           1.9%                 2.1%   2.1%
1.8%

2014       2015     2016        2017   2018   2019    2020   2021   2022    2023
                     Annual Imaging Procedures (mm)           Growth Rate

National imaging market is estimated to be                                         Industry remains highly fragmented; vast
over $100 billion                                                                  number of mom-and-pops and hospitals
       • Approx. 40% is non-hospital imaging                                         • Believed to be over 6,000 imaging locations
         (i.e., freestanding centers – like RadNet and                                 across the U.S.
         imaging completed within doctor offices).                                   • Number peaked in 2012 and has been declining
       • Approx. 60% imaging occurs within hospitals.                                • RadNet has a meaningful, non-hospital based
           • More expensive for patients and their                                     market share within its geographies.
             insurance companies
           • Inferior service
           • More difficult access and parking
           • Often no sub-specialized radiologist readers

1. Source: Frost and Sullivan

                                                                                                                                          8
Diagnostic Imaging: A Large and Growing Market

Growth has resulted from …
     • Aging population – 65-year-old demographic is expected     Shift to Outpatient
        to increase significantly                                 Services driven by…
     • Growing population – particularly in California, our       • Referring MDs increasing
                                                                    concern about cost, outcomes,
        largest market                                              and patient experience
     • Technology advances – expanding cost-effective             • Payors steering volume to less
                                                                    costly outpatient providers
       applications for diagnostic imaging
                                                                  • Patients increasingly seeking
     • Wider physician and payor acceptance for imaging             cost effective care given shift to
     • Greater consumer and physician awareness of and
                                                                    high deductible health plans
                                                                    § Supplemented by growing
        demand for earlier intervention and preventive                demand for convenient care
        diagnostic screening                                          settings
     • Shift to outpatient services

Imaging has been shown to reduce costs of Healthcare
Delivery System from…
     • Earlier and more accurate detection/diagnosis of disease
        and injury
     • Preventative screening resulting in money saved during
        treatment phase

Source: Frost and Sullivan

                                                                                                         9
Industry Consolidation and Rationalization

“Mom-and-pop” lack necessary economies of scale
  • Not well capitalized and have a higher cost structure      In 2015–2019, we
  • Single-modality facilities that are more impacted by       completed over
    reimbursement changes and competition from                 $185mm of acquisitions
    multi-modality facilities                                  • New York Radiology Partners
                                                               • California Radiology
  • Unable to do network contracting or capitate with payors
                                                               • Diagnostic Imaging Group
Higher facility accreditation/quality standards                • Diagnostic Imaging Associates of
                                                                 Delaware
Fear of survival and many more sellers than buyers result in   • Medical Arts
attractive acquisition multiples                               • Kern Radiology
  • Marginal operators are choosing to close and others can
    be acquired at 3x–5x EBITDA
                                                               We have also been
  • Operators want to be consolidated into RadNet, which
                                                               expanding through
    offers long-term stability                                 health system joint
  • Few other acquirers in RadNet’s core markets
                                                               ventures, particularly
                                                               in CA
                                                               • Cedars Sinai
                                                               • MemorialCare
                                                               • Dignity Health

                                                                                                    11
1 Introduction

2 Diagnostic Imaging Industry Overview

3 Overview of RadNet

4 Financial Information and Core Strategy
Scale and Leverage Over Competitors

        Founded in 1980 and is the major consolidator                             Largest
          in the highly fragmented imaging industry.                         owner-operator of
                                                                             fixed-site imaging
                                                                             centers in the U.S.

                                                                                 346
                                                                             Imaging Centers
       RadNet operates in states with ~25% of the U.S. population.

                                                                                 NJ:  26
                                                                                 DE:  10
                                                                                 NY: 103
                                                                                 MD: 67
                                                                                 FL:   3
                                                                                 CA: 130
                                                                                 AZ:   7

   +8,300                       +750                             19
                             Radiologists with
     Employees                                              Joint Ventures
                              Subspecialties

                                                                                                   13
Favorable Revenue Mix Mitigates Reimbursement Risk

Emphasis placed on multi-modality strategy
    • “One-stop-shopping” for referral sources
    • Lessens exposure to reimbursement changes, diversifies revenue base

Extensive offering of all routine imaging procedures partially insulates us from reimbursement cuts,
which generally impact MRI, CT and PET/CT modalities disproportionately.

                    Q1 2021 Scan Volume by Modality                                   Q1 2021 Net Revenue by Modality

                    Nuclear Medicine
                                        MRI                                                         Nuclear Medicine
                 Other    0.5%                                                              Other
                                       13.9%                                                              1.1%
                 5.2%                                                                       4.3%
                                                               CT
        PET/CT                                                8.8%
         0.5%                                                                      PET/CT
                                                                                    5.7%                                  MRI
                                                          Mammo            X-Ray                                         35.1%
                                                           19.6%           6.9%

                                                                     Ultrasound
                                                                       12.9%

X-Ray
27.2%

                                                                              Mammo
                                                                               16.6%                                     CT
                                                 Ultrasound                                                             17.4%
                                                   24.3%

                                                                                                                                 14
Favorable Revenue Mix Mitigates Reimbursement Risk (continued)

Strong payor relationships – RadNet is a critical provider of diagnostic imaging solutions to healthcare
insurance providers
Payor diversity mitigates exposure to possible unfavorable reimbursement trends within any one
payor class
Exclusive capitation business decreases the Company’s exposure to potential pricing changes from
commercial payors
  • Capitation price escalators create “built-in” increasing reimbursement mechanism

                                             Q1 2021 Payor Mix1

                                  Medicaid
                                              Other
     Workers Compensation/Personal 2.7%
                                              3.3%
                Injury
                 3.3%
                                                                                Commercial
                    Capitation                                                   Insurance
                      11.3%                                                        59.3%

              Medicare
               20.2%

                                                                                                           15
Capitated Contracts Create a Barrier to Entry

RadNet has over 35 capitated medical groups California with whom we work
We receive a per-member-per-month fixed price for exclusively providing outpatient imaging to over
1,900,000 lives in CA (HMO commercial, Medicare Advantage and Managed Medicaid lives)
Began first east coast contract in Oct. 2018 with Emblem/AdvantageCare Physicians with over
150,000 lives
Exclusive nature of capitated contracts provides revenue stability and predictability
  • On average, RadNet’s arrangements are over 10 years old
  • RadNet has experienced extremely high contract renewal rate
  • History of rate increases (generally 1%–3% annual increases)
  • Eliminates costs associated with receivables, bad debt expense and billing costs

Capitation contracts create “pull-through” revenue
  • Doctors from capitated physician groups often refer to us their non-capitated patients
    (discretionary business)
Risk of utilization is borne by RadNet and managed through the Utilization Management Division

                                                                                                     16
RadNet Joint Venture Strategy

RadNet has 19 joint ventures with hospital and health system partners
     • Over 2/3 of the ventures are unconsolidated (RadNet’s ownership is between 35%–50%)
     • Remaining 1/3 of ventures are consolidated (RadNet’s ownership is between 50%–94%)
     • Notable partners include MemorialCare (34 centers), RWJ Barnabas in New Jersey (19 centers),
      Cedars Sinai (5 centers), Dignity Health (14 centers), MedStar Health System, etc.
JVs own and operate free-standing, non-hospital-based imaging centers
RadNet manages the day-to-day operations and performs most management services (billing,
marketing, staffing, credentialing, contracting, IT, HR, accounting, etc.)
     • RadNet receives management fees for its services

 Benefits to RadNet                                            Benefits to Hospital/Health System Partners
 • Eliminates major outpatient competitor in Market            • Can participate in volume trend towards freestanding providers
 • Hospital partners drive incremental volumes                 • Join forces with what otherwise would be a competitor
 • Provides more contracting leverage with private payors      • Provides more contracting leverage with private payors
 • Receives management fees                                    • Benefit from being part of a larger operation
 • Can stimulate other activities with partners (Breastlink,   • Can stimulate other activities with partners (Breastlink,
   Teleradiology,                                                Teleradiology,
 • In-house staffing of Radiology Dept)                        • In-house staffing of Radiology Dept)
 • Prepares RadNet for opportunities with population health    • Prepares hospital for opportunities with population health mgmt
   management

                                                                                                                                   17
Information Technology

 Provider of PACS/RIS products, and hired an industry-leading software development team

 • Completing the integration of RadNet centers for significant workflow improvements and cost
   reductions
 • Growing the eRAD solutions by continuing to sell them to other industry participants
 • Provides RadNet with international opportunities
 • Low capital requirements and high margins

                                                                                                 18
Opportunity of Artificial Intelligence

                         RadNet created an Artificial Intelligence subsidiary in 2019:

                         Acquired Deep Health in 2020
                            • Leading radiology AI and machine learning company
                            • Focused on interpretation of mammography
                            • Future development on other screening tools for chronic disease – prostate cancer
                            • Deep Health founder, Dr. Greg Sorensen, to direct all of RadNet’s AI activities

                         Acquired Nulogix in 2019
                            • Initial focus on improving collections, with ability to recoup previously unrecognized
                              revenue.
                            • Second phase models focus on other billing opportunities, as well as on clinical
                              improvements in workflow prioritization and consistent measuring.
                            • Other initiative aimed at building algorithms for image interpretation.

                         Artificial Intelligence subsidiary is also partnering with other AI companies, such as
                         Whiterabbit.ai, to license and collaborate on other algorithms.

                            •   Rolling out program with Whiterabbit.ai to increase volumes of mammography –
                                program to be in place in all markets by the end of Q2
                            •   Second phase of pilot will test mammography image interpretation
                            •   In discussion phases with partners focusing on image interpretation of routine x-ray
                                exams

       Almost 20% of all collected net global Revenue goes towards paying our radiologists

              Material opportunity to lower this cost through Artificial Intelligence

                                                                                                                       20
1 Introduction

2 Diagnostic Imaging Industry Overview

3 Overview of RadNet

4 Financial Information and Core Strategy
Strong Performance as Volumes Have Rebounded from COVID-19

             2019 Quarterly Net Revenue
  ($ in millions)
                                                                                2020 Quarterly Net Revenue
                                                $301                                                                         $309
320                     $293                                      $282                                 $292
270

220                                                                                $191
170
                        Q3'19                  Q4'19              Q1'20           Q2'20                Q3'20                Q4'20

             2019 Quarterly Adj. EBITDA                                          2020 Quarterly Adj. EBITDA
      ($ in millions)                                                                                                      $51
                                             $47                                                      $46
                   $41

                                                                $20              $23
                 14.0%                     15.6%                                                     15.7%                16.4%
                                                                7.2%            11.9%

                 Q3'19                      Q4'19               Q1'20           Q2'20                Q3'20                Q4'20

            2019 Quarterly
      ($ in millions)           Total Leverage                            (1)
                                                                                2020 Quarterly Total Leverage

                                                                4.40x           4.47x
                                                                                                     4.24x
                  3.96x                     3.93x                                                                         3.84x

                 Q3'19                      Q4'19               Q1'20           Q2'20                Q3'20                Q4'20
                                                                                                                Denotes period of significant
 Source: Company Filings and Covenant Compliance Certificate.                                                   COVID-19 impact
                                                                          (1)

                                                                                                                                                2
Record Results in Q1 2021

         Revenue                    EBITDA            Aggregate Procedures     Same Center Procedures
     ↑   12.0%
      Up from 1Q 2020
                              ↑   123.4%                  ↑   8.4%                   ↑    5.0%
                                  Up from 1Q 2021          Up from 1Q 2020           Up from 1Q 2020

• On strength of Q1, we increased our guidance levels for 2021 for Revenue, Adjusted EBITDA and Free
 Cash Flow
     • Performance was the result of a return to more normalized procedural volumes and cost
      savings measures instituted during the COVID period that continue to benefit business
• Completed refinancing transaction in April; lowered annual interest cost by 75 bps, extended
 maturity of term loan to Apr 2028
• Received FDA approval for first of two mammography Artificial Intelligence algorithms

• Adjusted EBITDA margin increased 1.7% as compared with 3Q 2019

                                                                                                        4
2021 Guidance
•     For 2021, we believe our business will continue to strengthen as COVID-19 restrictions are further lifted
      across the country and in our markets
•     2H 2020 Revenue and Adj. EBITDA of $600 million and $96 million, respectively
          o   Run rate greater than our conservative guidance recently released for 2021
          o   Record Q1 2021 performance (highest Q1 Revenue and EBITDA in Company’s history)

                                          Operating Metric                                                               2021 Guidance Range

                                          Total Net Revenue                                                       $1,275million - $1,325 million

                                           Adjusted EBITDA                                                           $187 million - $197 million

                                      Capital Expenditures (1)                                                         $72 million - $77 million

                                       Cash Paid for Interest                                                         $35 million - $40 million

                                Free Cash Flow Generation (2)                                                          $70 million - $80 million

                                                    * End of year 2021 targeted leverage below 3.25x *

    1. Net of proceeds from the sale of equipment, imaging centers and joint venture interests, and excludes New Jersey Imaging Network capital expenditures.
    2. Defined as Adjusted EBITDA less Capital Expenditures and Cash Paid for Interest.

                                                                                                                                                                7
Proven Track Record of EBITDA Growth and Cash Flow Generation
        o                                Over the past 11 years, RadNet has had a consistent track record of achieving profitable growth and generating significant cash flow
        o                                COVID-19 had a temporary impact during 2020

                                                                            Net Revenue                                                                                               Reported Adjusted EBITDA
                                                                      Net Revenue            COVID Impact                                                                                   Net Revenue           COVID Impact                           $192
                 $1,400                                                                                                           $1,300
                                                                                                                            $1,200                                $175                                                                            $170
                                                                                                    %              $1,154                                                                                                %                 $164
                 $1,200                                                                        : 8.2                                                                                                                : 4.8
                                                                                        C   AGR                 $975
                                                                                                                               $128
                                                                                                                                                                                                             C   AGR
                                                                                   ’21E            $885 $922
                                                                                                                                                                  $155                                  ’21E                                      $31
                 $1,000                                                       ‘09–                                                                                                               ‘09–                          $143 $144
($ in Millions)

                                                                                                                                                ($ in Millions)
                                                                                            $810
                                                                                                                                                                                                                        $133
                                $800                                        $703 $718                                                                             $135                                $127
                                                                     $647                                                                                                                                        $122
                                                              $585
                                $600             $495 $519                                                                                                                           $116 $114 $113
                                                                                                                                                                  $115   $106 $106
                                $400
                                                                                                                                                                   $95
                                $200

                                        $-                                                                                                                         $75
                                                 2009 2010 2011 2012 2013 2014 2015 2016 2017 2018 2019 2020 2021E                                                       2009 2010 2011 2012 2013 2014 2015 2016 2017 2018 2019 2020 2021E

                                                                                                                                 Procedure Volumes
                                       10,000                                                                                     Procedures    COVID Impact
                                                                                                                                                                                                                                       8,388
                                                                                                                                                                                                                         7,886
                                                                                                                                                            %                                           7,393
                                        8,000                                                                                                      CAGR: 7.6
           (Procedures in Thousands)

                                                                                                                                                                                         7,116
                                                                                                                                          ‘09–’21E                         6,937                                                       1,521
                                                                                                                                                    6,280
                                        6,000                                                                                         5,526
                                                                                                                       4,961
                                                                                                        4,587
                                                                                     4,122
                                                      3,544           3,679
                                        4,000

                                        2,000

                                             0
                                                      2009            2010            2011              2012           2013           2014                  2015            2016         2017           2018             2019          2020

        Source: Company Filings and Presentation.
        Note: 2021E illustrated at midpoint of the guidance ranges. Volumes include consolidated and non-consolidated Joint Ventures.

                                                                                                                                                                                                                                                                8
Current Capitalization and Equity Cushion

                                                                       Valuation Metrics
                                                                                                              1
                                       Equity Market Capitalization @ $29.6 per share                                  $ 1,559.9 mm
                                                                       2
                                       Net Debt -3/31/2021                                                                 623.0 mm
                                             Curent Enterprise Value                                                   $ 2,182.9 mm

                                       Midpoint of 2021 EBITDA of Guidance                                             $ 192.0 mm

                                       Enterprise Value / Midpoint of 2021 EBITDA Guidance                                11.4 x

Company Capitalization as of 03/31/21 (refinanced in April)
     • $31mm cash balance
     • Undrawn on revolving line of credit (L+350 bps) due July 2023 ($195mm capacity)
     • $601mm Senior Secured Term Loan at RadNet
     • $1mm equipment debt
     • $52mm New Jersey Imaging Network JV debt (RadNet is not the borrower or guarantor)

2021E Free Cash Flow (Adj. EBITDA less CapEx and Cash Interest) is expected to be $70-80mm,
representing an attractive Free Cash Flow Yield to equity holders and provides for deleveraging
Future earnings and cash flow shielded by Federal NOLs of $227.7 million as of 12/31/20
1. Per closing stock price on 6/7/2021.
2. Source: RadNet 10-Q ended 03/31/2021. Net Debt is Total Debt at par value less Cash and Cash Equivalents balance.

                                                                                                                                      10
You can also read