Digital Planet: Readying for the Rise of the e-Consumer
←
→
Page content transcription
If your browser does not render page correctly, please read the page content below

Digital Planet:
Readying for the Rise of the e-Consumer

Supported by MasterCard Worldwide and DataCash
The Internet has come of age. Twenty-one years since the marketplace first took notice, the World Wide Web
today is at the heart of the global economy, channeling interactions for nearly 40% of the world’s population.i
It took the Internet 12 years to gather its first billion users, and a third of that time to amass its third billion.ii
Meanwhile, the emerging world is leapfrogging towards mobile phones, opening more avenues to Internet
adoption. Broadband subscriptions on mobile phones, now 34% of global mobile phone subscriptions, have
tripled since 2008.iii The next billion Internet users, logging on in an era of near universal mobile connectivity,
offer promise of greater economic growth and increased business opportunities.
The next billion will be different. The current three billion started off primarily as Internet users, surfing and
emailing, before they became consumers of digital marketplaces. The next billion, already mobile customers
used to interacting and transacting – downloading ringtones, content etc., – in a mobile ecosystem on their
feature phones, will start off not as mere users but rather as e-consumers: internet enabled mobile devices will
vastly expand their access to downloadable content; buying and selling goods and services through a mobile
phone is a logical next step. This has profound implications for the future of global commerce and digital
marketplaces. Where the next billion e-consumers will come from, who they are, what they are like, and how
they will shape the digital marketplaces of the future are questions of great importance to businesses and
investors globally. The answers depend on how governments, businesses, and consumers co-evolve to face the
challenges and opportunities of the digital future. The hype surrounding the IPO of Alibaba, growing investor
interest in the potential of the Indian electronic shopping market, including local players such as Flipkart and
international giants, such as Amazon, together with the fast growth of e-commerce companies across Asia,
Latin America and sub-Saharan Africa – several enabled by the Rocket Internet platform -- are clear signals of
this growing phenomenon.
Understanding the systemic forces that drive digital evolution will help in strategic decision-making among
businesses, investors and policy-makers in steering innovation and allocating resources. To measure the
digital trajectories of countries and to provide actionable, data-informed insights for businesses, investors, and
policymakers, The Fletcher School, created the Digital Evolution Index (DEI), with support from MasterCard
World and DataCash. The DEI analyzes the key underlying drivers and barriers that govern a country’s evolution
into a digital economy: Demand, Supply, Institutional Environment, and Innovation. A longitudinal analysis of
these four drivers during the years 2008 to 2013 enables us to make sense of the evolving global digital
landscape, reveal patterns and provide insights into both current consumers and those to come. The index and
the corresponding analyses of the patterns reveal many broad conclusions – each of them has powerful
managerial, investment and policy implications.
Insights, Patterns, and Surprises
Each emerging e-commerce market will chart its own path…
Our research shows that there is very little about the digital past and present of the West that instructs
us about the digital present and future of the Rest.
Momentum and direction over time are determined primarily by the interplay between demand and
supply, institutional environments, and innovation within the country. While there isn’t one grand
pattern, to the extent that the four drivers are correlated, the evolution follows a linear path; when not
correlated, the trajectory is non linear, and more often a random walk. This is due to a system of
underlying drivers, some that move quickly (e.g. the spread of mobile communications and consumer
applications) while others that move very slowly (e.g. policy and regulations, infrastructure
improvements) which can keep certain states of evolution locked-in for arbitrary periods and then
unlocked due to a combination of factors that create enough leverage for change.
2
Catchy acronyms and “clubs” (BRICS, Fragile Five) that lump together disparate emerging economies -
while ignoring their underlying drivers - confuse rather than clarify our understanding of digital
trajectories.
… but neighborhoods matter.
Countries in close geographic proximity seem to display similar trajectories, as seen among the Nordics,
Central and Southern European states, and members of the ASEAN.
Shared cultural norms; a commonality in social, political, and economic environments; and
demonstration effects could all play a role in the neighborhood effect, giving regional trade a boost.
Regional economic grouping and related harmonization of institutions and supply chains have had a
positive impact on individual country scores over time, as seen in Poland, Estonia, and Malaysia.
In some highly innovative emerging economies, hybrid solutions are fostering vibrant digital
marketplaces …
Innovative hybrids combining two or more elements of the digital commerce value chain - access,
marketplaces, transaction, and delivery - are springing up to bridge infrastructure gaps.
Cash on delivery where electronic payments are thin; tablet-toting vendors where access is patchy; and
delivery personnel doubling up as sales persons to cross-sell or upsell are some of the strategies making
household names of marketplaces such as Lamoda in Russia, Flipkart in India, Kaymu in Africa, and
Lazada in South East Asia.
… despite the strong adherence to cash.
A combination of fledgling infrastructure, low payment card penetration, cultural preferences, and
distrust of electronic payments have entrenched cash into emerging digital commerce ecosystems.
Cash on delivery for e-commerce transactions is the preferred and growing payment method in some of
the fastest-moving economies in our index.
Attractive demographics and underinvestment represent untapped potential...
Some of the countries that are ready to break out and on the cusp are also some of the world’s most
populous nations, including China, India, Mexico, Indonesia, Brazil, and The Philippines. Since all our
components that measure demand are calculated on a per capita basis to allow for comparability, the
growing per capita demand score multiplied by the size of populations reveals immense demand
potential.
The Philippines, Chile, Colombia, Thailand, and Indonesia are among the fastest-evolving economies,
and yet have received relatively little investment in digital commerce ecosystems to date.
...which can be helped or hindered by embedded institutions.
Policy and regulatory environments that promote rather than restrict the digital economy are a
competitive advantage: Chile, Malaysia, and Estonia are reaping the benefits of their forward-looking
governments.
By contrast, the lack of effective institutions can stymie the growth potential of e-commerce in some of
the biggest emerging economies, including China, India, and Brazil.
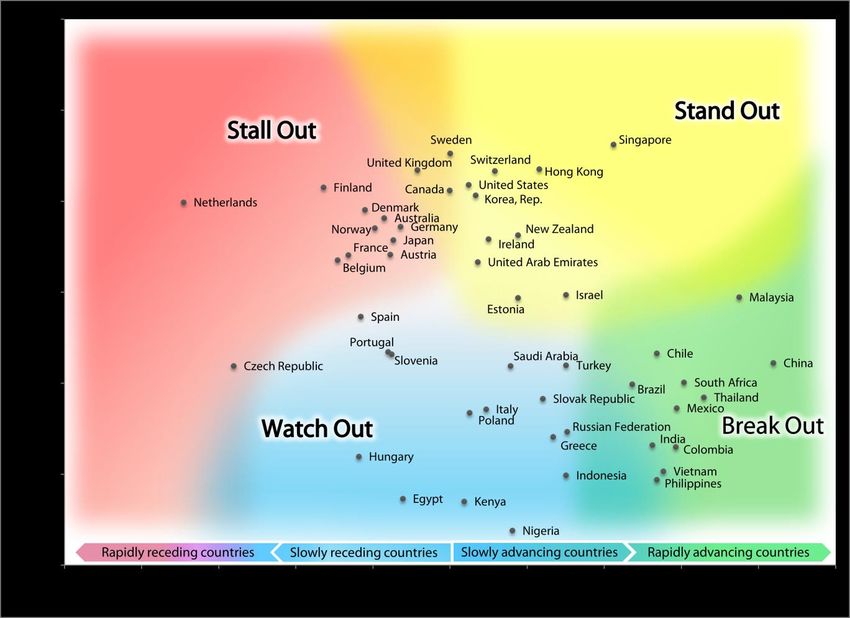
Evolving Digital Planet: Key Patterns
Whether and how the other 60% will participate in the internet economy will depend on the evolving
ecosystems around them. Using DEI data, the Trajectory Chart below illustrates how countries’ digital
ecosystems have been faring. We arrayed countries’ current (2013) status on the vertical axis against the five-
year rate of change of each country, positive or negative, on the horizontal axis. To classify the performance of
countries, we divided the trajectory chart into four distinct evolution zones, each of which is described next.
3Trajectory Chart
Stall Out countries are Stand Out countries have shown high
losing momentum. While levels of digital development in the
these countries have past, and continue to remain on an
achieved a high level of upward trajectory
development in the past,
they run a risk of falling
behind.
Break Out countries have the
potential to develop strong digital
Watch Out countries face both economies. They have displayed a
significant opportunities and consistently impressive upward
challenges. Some may be able to trajectory in improving their state
overcome limitations with clever of readiness and are well poised to
innovations and stopgap measures, break into the Stand Out ranks in
while others seem to be stuck. the years to come.
Decrease in score over time Increase in score over time
4Country Rankings at a Glance (2013)
The 50 countries we chose for our analysis span a wide range between developed and emerging economies,
and together represent almost three quarters of the global population (5.2 billion). These are where most of
the world’s current internet users live and where the next billion are likely to come from.
2013 Digital Evolution Index Total Score
Full Rankings - 2013 Change in Scores since 2008
Countries ranked on 2013 total scores across four Countries ranked by change in DEI scores from 2008 to
drivers: Demand, Supply, Institutional Environment, 2013. China has seen the highest increase in score, while
and Innovation the Netherlands have shown the largest decrease.
Rank Country Name Score Rank Country Name Score Rank Country Name Change Rank Country Name Change
1 Singapore 56.21 26 Portugal 33.41 1 China 8.39 26 Italy 0.94
2 Sweden 55.23 27 Chile 33.25 2 Malaysia 7.50 27 UAE 0.72
3 Hong Kong 53.52 28 Slovenia 33.17 3 Thailand 6.59 28 South Korea 0.67
4 United Kingdom 53.41 29 China 32.20 4 South Africa 6.07 29 Poland 0.51
5 Switzerland 53.32 30 Turkey 31.95 5 Mexico 5.88 30 United States 0.48
6 United States 51.79 31 Czech Republic 31.87 6 Colombia 5.85 31 Kenya 0.37
7 Finland 51.49 32 Saudi Arabia 31.87 7 Vietnam 5.54 32 Sweden 0.00
8 Canada 51.17 33 South Africa 30.06 8 Chile 5.37 33 Canada -0.01
9 South Korea 50.63 34 Brazil 29.86 9 Philippines 5.37 34 United Kingdom -0.85
10 Netherlands 49.86 35 Thailand 28.42 10 Brazil 5.34 35 Egypt -1.22
11 Denmark 49.03 36 Slovak Republic 28.27 11 India 5.25 36 Germany -1.28
12 Australia 48.14 37 Mexico 27.23 12 Singapore 4.24 37 Japan -1.47
13 Germany 47.18 38 Italy 27.12 13 Russia 3.04 38 Slovenia -1.52
14 Norway 47.04 39 Poland 26.73 14 Turkey 3.01 39 Austria -1.55
15 New Zealand 46.26 40 Russia 24.65 15 Indonesia 3.01 40 Portugal -1.60
16 Ireland 45.81 41 Greece 24.08 16 Israel 3.01 41 Australia -1.71
17 Japan 45.71 42 India 23.17 17 Greece 2.67 42 Norway -1.95
18 Austria 44.13 43 Colombia 22.97 18 Slovak Republic 2.41 43 Denmark -2.20
19 France 44.07 44 Hungary 21.92 19 Hong Kong 2.32 44 Spain -2.32
20 Belgium 43.49 45 Vietnam 20.29 20 Estonia 1.76 45 Hungary -2.36
21 United Arab Emirates 43.29 46 Indonesia 19.85 21 New Zealand 1.76 46 France -2.64
22 Israel 39.69 47 Philippines 19.38 22 Nigeria 1.62 47 Belgium -2.92
23 Malaysia 39.43 48 Egypt 17.28 23 Saudi Arabia 1.57 48 Finland -3.28
24 Estonia 39.36 49 Kenya 16.98 24 Switzerland 1.16 49 Czech Republic -5.61
25 Spain 37.29 50 Nigeria 13.77 25 Ireland 1.00 50 Netherlands -6.91
5Emerging Implications
The Digital Evolution Index is a comparative framework built to enable pattern recognition into how internet
technology is transforming marketplaces – a developing area of the global economy whose effects are
unfolding daily. Entrepreneurs, businesses, and investors would do well to act on the opportunities embedded
in the patterns revealed by the DEI. Governments and policymakers keen to see their countries reap economic
gains from digital evolution ought to benchmark against the best performers on the Index to create enabling
environments for their ecosystems to thrive.
Businesses will always seek out opportunities to fill gaps between supply and demand: they have the highest
leverage and payoffs in the short run here. It is their ability to innovate and navigate institutional constraints –
areas where their leverage is lower, and the payoffs distant – that will determine success in the long run. Our
research reveals the following broad patterns – each with very specific implications for businesses across the e-
commerce value chain, investors and policy-makers:
The biggest opportunities in Watch Out and Break Out markets in the near to medium term lie in
improving supply conditions. Digital ecosystems would benefit immensely from improvements in logistics
and transportation infrastructure, deeper financial inclusion, and better conditions of internet access.
Collaboration between proactive policymakers and the private sector could help fast track improvements
in access, transactions, and fulfillment.
Break Out markets and those on the cusp such as South Africa, Mexico, Vietnam and Indonesia registered
the highest gains in demand during 2008 - 2013 in spite of significant limitations in supply conditions.
Eliminating supply bottlenecks would enable them to realize the full potential of advantageous
demographic trends and robust consumer demand within these markets.
The large and attractive demographics of China and India will continue to draw investments into
marketplaces. Intensifying competition among internet retailers, while beneficial to the consumer, would
place increased pressure on already strained infrastructure. Hybrid solutions and short term fixes,
designed by innovative entrepreneurs to overcome gaps in supply, risk permanence as these businesses
become successful. There is a need for forward-looking policy making in both these markets to ensure that
infrastructure conditions can keep up with demand.
The increasingly integrated ASEAN economies, with their similar trajectories and 600+ million consumers,
are also compelling candidates for digital commerce investments. Yet despite their rapid evolution, the
Break Out countries of Indonesia, Thailand, the Philippines have received relatively little private equity
investment to date. ASEAN’s integration and tariff harmonization will generate opportunities for the
creation of regional marketplaces and delivery networks.
The Stall Out economies of Europe, including the Netherlands, Finland, Belgium and France, could
jumpstart their recovery by taking advantage of increased regional integration, selling goods across
national borders to the 500+ million consumers in the wider EU.
Stand Out markets offer a disproportionately high ROI in e-commerce. While their domestic markets are
highly competitive, they are also poised to transform into regional hubs for e-commerce. They can do so
by taking advantage of strong supply infrastructure and supportive institutional environments to absorb
demand from their neighborhoods. Entrepôts such as Singapore, Hong Kong, and Dubai stand to gain the
most by integrating more deeply with their neighbors.
6Each of these overarching findings have clear action implications for managers in retail, technology and
intermediary businesses, as well as in logistics and in the relevant infrastructure and supply chain sectors.
There are also implications for investors, particularly in private equity and venture capital as they make choices
on which e-commerce players in which markets they should invest in. Finally, there are implications for public-
private partnerships and coordination and broad public policy action. Each of these four categories of
implications will be detailed in the article.
_________________________________________________________________________________________
For more information on this study and related issues, please contact the authors:
Bhaskar Chakravorti: bhaskar.chakravorti@tufts.edu
Rusty Tunnard: christopher.tunnard@tufts.edu
Ravi Shankar Chaturvedi: ravi.chaturvedi@tufts.edu
i
“Number of Internet Users (2014) - Internet Live Stats” < http://www.internetlivestats.com/internet-users/>
ii
ibid
iii
ITU Statistics – Global ICT developments, 2001-2014
7You can also read