Classification of Pistachio Species Using Improved k-NN Classifier
←
→
Page content transcription
If your browser does not render page correctly, please read the page content below
Progress in Nutrition 2021; Vol. 23, N. 2: e2021044    DOI: 10.23751/pn.v23i2.9686                                    © Mattioli 1885

                                                      Original article

     Classification of Pistachio Species Using Improved k-NN
     Classifier
     İlker Ali Özkan1, Murat Köklü1, Rıdvan Saraçoğlu2,*
     1
         Selcuk University, Faculty of Technology, Department of Computuer Engineering 42100 Konya, Turkey
     2
         Van Yuzuncu Yil University, Faculty of Engineering, Department of Electrical and Electronics Engineering, 65080 Van, Turkey

     Abstract: In order to keep the economic value of pistachio nuts which have an important place in the agricul-
     tural economy, the efficiency of post-harvest industrial processes is very important. To provide this efficiency,
     new methods and technologies are needed for the separation and classification of pistachios. Different pista-
     chio species address different markets, which increases the need for the classification of pistachio species. In
     this study, it is aimed to develop a classification model different from traditional separation methods, based
     on image processing and artificial intelligence which are capable to provide the required classification. A
     computer vision system has been developed to distinguish two different species of pistachios with different
     characteristics that address different market types. 2148 sample image for these two kinds of pistachios were
     taken with a high-resolution camera. The image processing techniques, segmentation and feature extraction
     were applied on the obtained images of the pistachio samples. A pistachio dataset that has sixteen attributes
     was created. An advanced classifier based on k-NN method, which is a simple and successful classifier, and
     principal component analysis was designed on the obtained dataset. In this study; a multi-level system in-
     cluding feature extraction, dimension reduction and dimension weighting stages has been proposed. Experi-
     mental results showed that the proposed approach achieved a classification success of 94.18%. The presented
     high-performance classification model provides an important need for the separation of pistachio species and
     increases the economic value of species. In addition, the developed model is important in terms of its ap-
     plication to similar studies.

     Keywords: Classification, Image processing, k nearest neighbor classifier, Pistachio species.

Introduction                                                                  Turkey is ranked in the top three in World Pis-
                                                                         tachio production and pistachios are grown in 56
     Pistachio is one of the most nutritious products.                   provinces of Turkey. Fig. 1 shows a pistachio grain.
It provides 560 calories in 100 gr and is a rich source                  Kirmizi and Siirt species that have more prominent
of protein, dietary fiber, various dietary minerals and                  fruits and fewer tendencies to periodicity are often the
vitamins B, thiamine and vitamin B6(1). It is known                      preferred species to increase production of pistachio
that pistachio has many benefits especially heart                        in Turkey (1).
health. (2,3).
2 Progress in Nutrition 2021; Vol. 23, N. 2: e2021044
Omid et al. applied an algorithm based on com-
bined image processing and machine learning tech-
niques, including artificial neural networks (ANN) and
support vector machine (SVM) to classify peeled pis-
tachio beans into five classes (7). They first segmented
the images and obtained 72 chromatic and four shape
features from each sample. After feature selection and
PCS operations, they obtained the input vector size as
7. They achieved 99.4% accuracy with ANN classifier
and 99.88% accuracy with SVM classifier.
In order to increase the market value of pistachio,
automatic separation and classification is needed for
different types of products that come from different
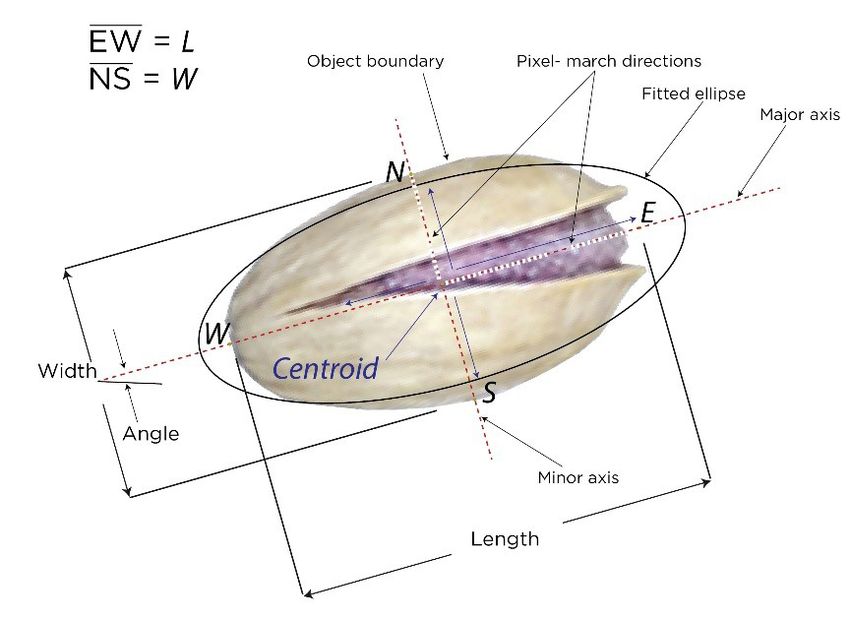
Figure 1. Morphological characteristics and appearance of suppliers. Therefore, new techniques and technologies
pistachio grain should be used to improve the methods used in post-
harvest mechanization processes of pistachio and to
increase the yield of the product which has high eco-
In addition, production is concentrated on Kirmi-
nomic value (8).
zi and Siirt species because of economic value. Kirmizi
In this study, it is aimed to develop a system that
species are preferred to use in sweet confectionery and
can classify the pistachio species which are needed to
pastry industry due to their dark green color, taste and
increase the efficiency of post harvest processes and
distinct aroma; Siirt species are preferred as a snack
address different market types. For this purpose, a
because of its high cracking rate and round shape (4).
computer vision system (CVS), image processing tech-
Therefore, these two types address different markets.
niques and appropriate artificial intelligence methods
The majority of the operations on pistachios are post-
were used together.
harvest processes.
With the proposed system and similar classifi-
There are different studies in the literature in or-
cation studies (9), improvements can be achieved in
der to evaluate the obtained product in an economic
production and marketing processes. This can contrib-
and high-quality way. Cetin et al. has developed an
ute to an increase in product quality and a decrease in
algorithm to distinguish between the close and open
product price. Facilitating access to pistachio and pis-
state of pistachio shell (5). In their study, they took
tachio products will provide many nutritional benefits.
into account that after the impact on a steel plate, the
pistachios in the closed state has a different sound than
the pistachios in the open state. In the classification of
Material and Methods
audio signals, a linear combination of mel-cepstrum
and PCA feature vectors were used. They have achieved
Image acquisition and forming pistachio dataset
99% success in determining the open and close states
of pistachios shells.
In this study, firstly images of licensed pista-
Casasent et al., performed classification using x-
chio species were obtained in order to form dataset.
ray images of pistachios. They used piecewise quad-
A CVS was used to obtain the pistachio images. The
ratic neural network (PQNN) in their classification
developed CVS consists of a lens socket and a Pros-
process (6). They indicated that X-ray imaging had the
ilica GT2000C image capture camera. In addition, a
potential to provide real-time inspection of similar ag-
special image shooting box was used to prevent shade
ricultural products. They have achieved a success rate
formation in pistachios and to eliminate outdoor light
of 88% in determining the quality of products.Progress in Nutrition 2021; Vol. 23, N. 2: e2021044 3
differences. The distance between the camera and pis- and F-score. Performance results obtained by the test
tachio samples is 15 cm. Furthermore, black is used as can be expressed by confusion matrix.
background surface to prevent unwanted noise. In order to evaluate and scale the model, success
The noise on obtained pistachio images were criteria such as accuracy, sensitivity, specificity, preci-
cleaned by using image processing methods. Histo- sion and F1-Score are calculated (15-17). Detail of the
gram information was obtained for contrast enhance- formulas of success criteria is given in Table 3. In here
ment and histogram equalization was performed. tp, fp, tn, and fn are true positive, false positive, true
With Otsu’s method, a threshold detection method negative and false negative respectively.
that can be applied on grayscale images, pistachio im- To prevent high bias and high variance while
ages are partitioned into two parts: background and testing pistachio classification algorithms, “10-fold
foreground. Otsu algorithm, computes the optimal cross validation” method was used (18). In the 10-fold
threshold value by processing the histogram informa- cross-validation method, the dataset is divided into
tion of the image (10). After segmentation, from each 10-folds and each fold is used once as a test set and
pistachio sample morphological and shape features the remaining 9-fold used as training set. After this
were extracted. process is repeated 10 times, the result is reached by
MATLAB was used for feature extraction and taking the average of the performance criteria of the
sixteen features were obtained for each pistachio test sets (18, 19).
sample, twelve of them morphological and four of
them shape information. The values found in all fea- Principial Component Analysis
tures are from pixel type. The morphological and
shape characteristics used are given in Table 1(11- Principal Component Analysis (PCA) is a use-
14): Kirmizi and Siirt pistachio species were used in ful statistical technique (20). The main purpose of this
this study. Of the total 2148 pistachio samples, 1232 technique is to reduce the feature vector size. PCA is
belong to Kirmizi and 916 belong to Siirt specie. now widely used in signal and image processing tech-
Samples were made by taking one kilogram of each niques. The PCA feature reduction method can be de-
species. Descriptive Statistics of Kirmizi and Siirt scribed as follows:
species are given in Table 2. Let M, be a t dimensional feature set. n basic axes
When the statistical values, given in Table 2, are G1, G2, . . . , Gn and 1 ≤ n ≤ t . These axes are also called
examined, the differences between the species in terms orthonormal axes. Where xk∈ M, m is the average of
of type are seen on the morphological features. Be- these samples and L the number of samples, the co-
tween two pistachio species, morphological feature variance matrix U is calculated as follows:
values of Siirt species are higher than Kirmizi species.
Despite this difference, morphological features of the
two species overlap in many value ranges. This conclu-
sion suggests that no feature alone will be sufficient for according to this:
decision-making or statistical classification. UGk=vkGk, k ∈ 1,…,n,
Performance Criteria. where vk is the largest eigen value of U. According to
this, n basic components of xk∈M are given as follows:
The success of the model used in the study is de-
termined by the number of samples assigned to the
right class and the number of samples assigned to the
wrong class.
The basic concepts used to evaluate model per- here, q is n basic component vector of x input fea-
formance are accuracy, error rate, precision, sensitivity ture vector.4 Progress in Nutrition 2021; Vol. 23, N. 2: e2021044
Table 1. Attributes and formulas used in this study
Type Feature Formula
Area (A):
Perimeter (P): Bean circumference is defined as the length of its border.
The distance between the ends of the longest line that can be drawn
Major axis length (L):
from a bean.
The longest line that can be drawn from the bean while standing
Minor axis length (l):
perpendicular to the main axis.
Eccentricity (Ec): Eccentricity of the ellipse having the same moments as the region.
Equivalent diameter (Ed):
Morphological Solidity (S):
Number of pixels in the smallest convex polygon that can contain the
Convex area (C):
area of a bean grain.
Extent (Ex):
Aspect ratio (K):
Roundness (R):
Compactness (CO):
Shape Factor 1 (SF1):
Shape Factor 2 (SF2):
Shapes
Shape Factor 3 (SF3):
Shape Factor 4 (SF4):Progress in Nutrition 2021; Vol. 23, N. 2: e2021044 5
Table 2. Descriptive Statistics of pistachio species
Kirmizi Siirt
No Features
Min Max Mean Std. Dev. Min Max Mean Std. Dev.
1 Area 29.808 96.582 73.285,43 11.049,99 55.000 124.008 88.915,24 9.973,60
2 Perimeter 858,363 2.755,05 1.378,93 341,5137 1.018,38 2.746,77 1.489,24 408,7394
3 Major axis length 320,3445 541,9661 442,4214 34,8984 336,944 535,6422 451,397 28,0239
4 Minor axis length 133,5096 305,8938 220,8538 22,4381 171,062 383,0461 261,7925 22,718
5 Eccentricity 0,6249 0,946 0,8632 0,0339 0,5049 0,9247 0,8093 0,0486
6 Equivalent diameter 194,8146 350,6737 304,5275 23,9449 264,6284 397,3561 335,9306 19,0103
7 Solidity 0,588 0,9936 0,9346 0,0501 0,6975 0,9951 0,9474 0,05
8 Convex area 37.935 109.071 78.386,02 11.079,02 59.754 132.478 93.932,81 10.106,46
9 Extent 0,4272 0,8123 0,7115 0,0542 0,5035 0,8204 0,7222 0,0496
10 Aspect ratio 1,281 3,0858 2,0185 0,2086 1,1585 2,6263 1,7363 0,1761
11 Roundness 0,0628 0,874 0,5498 0,1952 0,122 0,9336 0,5953 0,2319
12 Compactness 0,476 0,8082 0,6891 0,0333 0,6067 0,8779 0,7454 0,0366
13 Shape Factor 1 0,0047 0,0131 0,0061 0,0008 0,004 0,0077 0,0051 0,0004
14 Shape Factor 2 0,0024 0,0053 0,0031 0,0004 0,0024 0,0047 0,003 0,0003
15 Shape Factor 3 0,2266 0,6532 0,4759 0,0455 0,3681 0,7706 0,5569 0,0551
16 Shape Factor 4 0,6204 0,9987 0,9524 0,0489 0,6598 0,999 0,959 0,0553
Table 3. Calculation formulas and descriptions of two class K-NearestNeighborAlgorithm
metrics
The K-NN algorithm is among the most basic
Measure Formula example-based learning algorithms. In sample-based
Accuracy (acc) learning algorithms, the learning process is based on
the data in the training set. A new sample is classified
according to the similarity between the samples in the
Sensivitiy (se) training set (21). In the K-NN algorithm, the samples
in the training set have n-dimensional numerical at-
tributes. All training samples are held in an n-dimen-
Specificity (sp) sional sample space, with each sample representing a
point in the n-dimensional space. When an unknown
sample is encountered, the class label of the new sam-
Precision (p) ple is assigned by determining the k samples closest to
the relevant sample from the training set and deciding
by majority of the class labels of the nearest neighbor k
F1-Score (22). The K value is usually set as the square root of the
number of training samples (23).6 Progress in Nutrition 2021; Vol. 23, N. 2: e2021044
In the basic k-NN algorithm, determining the sion reduction process eliminates the high dimensional
class label with majority voting leads frequent classes data disadvantage of the classification algorithm used
in datasets with asymmetric distribution to have more in this study.
dominant role in idenfiying new samples class labels In the classification stage, one of the most popu-
(24). Therefore, there are methods such as weighted lar machine learning techniques, k-NN algorithm, was
k-NN that assign different weight values to the the used. The k-NN algorithm is easy to implement with
distance criterion of the basic k-NN algorithm (25). respect to the size of the obtained dataset and does not
In the K-NN algorithm, when an unlabeled require a training process. Since it is a sample-based
sample comes, various feature calculation criteria are algorithm, new samples can be added to the dataset
used to find the nearest sample. In this study Euclid- without any problems. It does not require too many
ean criterion is used. Euclidean distance is the most parameters which provides ease of application. It is
commonly used distance measure in classification and also preferred because it is robust against noisy data. In
clustering algorithms. Euclidean distance is the linear addition, weighted k-NN structure was employed in
distance between two points (26). order to use the contribution of neighboring samples
In Weighted k-NN, by assigning weight values to of k-NN model to voting.
neighbors, neighboring samples closer to the sample In the last stage, the models developed for the
being classified are intended to contribute more to the classification of pistachio varieties were evaluated
majority vote. The most commonly used methods of based on the confusion matrix and the performance
weight value assignment are that the weight of each criteria given in Table 3 and the model selection was
neighbor is taken as 1/d or 1/d2, where d, the distance made.
between neighbors (27). Actually, this weight assign-
ment can be explained as a conversion of distances to
weight value. For each class, the weight values of the Results
samples belonging to these classes are summed and a
value of membership to the class is determined. When In the study, MATLAB was used for model de-
these values are considered, the class with the largest velopment process. Modeling process was performed
value is determined as the result class (28). by using standard k-NN algorithm on the obtained
pistachio dataset. In the classification study, k-NN
models were developed by using all sixteen attributes.
Proposed Classification Model For the k-NN model, the Euclidean criterion was used
as the distance criteria. In addition, the best k value
The feature extraction and modeling steps used was determined using trial and error method starting
for pistachio classification are given in Fig. 2. First of from 1. As a result of the experiments, the best k value
all, images of pistachios were obtained using CVS de- was chosen as 43, equal to the square root of the train-
veloped in the image preparation step. An image ac- ing dataset, which is generally one of the k selection
quisition set was used to provide the same distance, method (29).
light, etc. environment characteristics in order to avoid Two different models have been developed on the
differences during image acquisition. The pistachio dataset, namely the k-NN model and the weighted
images obtained in the feature extraction stage were k-NN model. The confusion matrices are given in Ta-
subjected to segmentation. In this stage, for each pis- ble 4 and 5 have been obtained as the result of the
tachio sample morphological and shape features that 10-fold cross validation kNN models. In addition, the
are detailed in Table 1, were extracted. average values of the performance criteria obtained af-
Features of pistachio dataset are closely related to ter 30 runs for the k-NN models are given in Table 6.
each other. To find the basic structure and size of the The k-NN model has 83.38% accuracy and the
dataset with this relationship, PCA was performed on weighted k-NN model has 87.38% accuracy. Devel-
the dataset in the dimension reduction stage. Dimen- oped weighted k-NN model can estimate the class ofProgress in Nutrition 2021; Vol. 23, N. 2: e2021044 7
Table 6. Performance criteria for developed K-NN models
Measure k-NN Value Weighted k-NN Value
Sensivitiy 0.8589 0.8841
Specificity 0.8009 0.8595
Precision 0.8498 0.8977
F1 Score 0.8543 0.8909
Accuracy 0.8338 0.8738
being Siirt subspecies with the accuracy of 89.77%.
On the otherhand the model estimation success rate is
85.95% for Kirmizi subspecies.
PCA was used to increase accuracy performance
on pistachio dataset, to reduce the number of features
sizes and to improve the distribution of samples. PCA
yielded 4 features with 95% variance.
Weigthed k-NN model, which gave successful
results before, was used for classification on the data
set obtained by PCA. The confusion matrice is given
in Table 7. As the result of the classification, 94.18%
accuracy rate was obtained. In addition, performance
criteria for PCA based k-NN model (using 10-fold
cross validation) are given in Table 8.
The PCA-based weighted k-NN has of 94.18%
accuracy. Developed PCA based weighted k-NN
model can estimate the class of being Siirt subspecies
with the accuracy of 95.13%, while the same model es-
Figure 2. Flow chart of the proposed system for pistachio timation success rate is 93.41% for Kirmizi subspecies.
classification The PCA method is known to be successful for
independent variables that fit the normal distribu-
tion. The method was successful because the features
Table 4. Confusion matrix of k-NN model
in this study also fit the normal distribution. In addi-
Predicted Classes tion, PCA is used to overcome the noise problem in
Weighted k-NN Value the data. In this study, it can be interpreted that PCA
Kirmizi Siirt method reduces the noise in the data.
True Kirmizi 1047 185
Classes Siirt 172 744
Table 7. Confusion matrix of PCA based weighted k-NN
model
Table 5. Confusion matrix of Weighted k-NN model
Predicted Classes
Predicted Classes Weighted k-NN Value
Weighted k-NN Value
Kirmizi Siirt
Kirmizi Siirt
True Kirmizi 1172 60
True Kirmizi 1106 126 Classes
Classes Siirt 65 851
Siirt 145 7718 Progress in Nutrition 2021; Vol. 23, N. 2: e2021044
Table 8. Performance criteria for developed PCA based time and energy expenses of the enterprises will be
weighted k-NN performance less. By means of the system, it will be ensured that the
Measure Value nuts to be classified to the standard specifications. As
the result of all these factors, they will have price and
Sensivitiy 0.9475
sales advantages as the pistachio nuts are standard at
Specificity 0.9341
the marketing stage.
Precision 0.9513 The success of the developed system can be fur-
F1 Score 0.9494 ther enhanced by the hybrid use of machine learning
Accuracy 0.9418 methods. The resulting system can be combined with
ultrasonic sounds to make a complicated classifier that
considers open and close conditions of pistachios shells.
Conclusion
There is not any fundamental decisive feature REFERENCES
in the classification of pistachio varieties. This study
proposes an image-based approach to pistachios clas- 1. Ertürk YE. , Geçer MK., Gülsoy E, and Yalçın S. Produc-
tion and Marketing of Pistachio, Journal of the Institute of
sification process. According to our experience in im- Science and Technology of Igdir University 2011;5: 43–62.
age obtainment and processing, a CVS is needed to 2. Dreher ML. Pistachio nuts: composition and potential
prevent the noised data as much as possible. Properties health benefits, Nutrition Reviews 2012, 70(4): 234–240.
for obtained images should be similar for all samples. 3. Kay CD, Gebauer SK, West SG, Kris-Etherton PM. Pista-
chios Increase Serum Antioxidants and Lower Serum Oxi-
Dataset obtained with the image-based approach and
dized-LDL in Hypercholesterolemic Adults, The Journal of
the classification model can be considered successful Nutrition 2010, 140(6): 1093–1098
witout any optimization. This result shows that this 4. Tunalıoğlu R, and Taşkaya B. Antepfıstığı. Tarımsal Ekono-
image-based approach can be used to identify the mi Araştırma Enstitüsü Dergisi, 2003.
characteristics of pistachio species. 5. Cetin AE, Pearson TC, and Tewfik AH. Classification of
closed and open shell pistachio nuts using principal com-
In this study, it was seen that the PCA applied ponent analysis of impact acoustics. In 2004 IEEE Inter-
on pistachio dataset increased the classification per- national Conference on Acoustics, Speech, and Signal Pro-
formance. With this process, it is shown that none of cessing 2004; V–677.
its attributes alone is sufficient and PCA process gives 6. Casasent DA, Sipe MA, Schatzki TF, Keagy PM, Lee LC.
Neural net classification of X-ray pistachio nut data. LWT-
good results in expressing the basic factors in the data-
Food Science and Technology 1998, 31(2): 122–128.
set containing high dimensional structure. 7. Omid M, Firouz MS, Nouri-Ahmadabadi H, Mohtasebi
The dimension size reduction by PCA also re- SS. Classification of peeled pistachio kernels using com-
sulted in improved performance in the k-NN model. puter vision and color features, Engineering in Agriculture,
This system with k-NN algorithm, can be applied to Environment and Food 2017,10: 259–265.
8. Atay Ü. The investigation of classification systems used for
different species easly because it is sample-based. It pistahio and construction of an alternetive classification sys-
is possible to include different species in the model if tem, PhD Thesis Harran University, Sanliurfa, 2007.
necessary. In this respect, the proposed system has an 9. Sabanci K, Kayabasi A, and Toktas A. Computer vision-
expandable structure. based method for classification of wheat grains using arti-
ficial neural network, Journal of The Science of Food and
In addition, with the optimization of the k-NN Agriculture 2016, 97(8): 2588–2593.
algorithm in according to the model, the accuracy was 10. Otsu N. A threshold selection method from gray-level his-
increased from 83.38% to 94.18%. The preprocessing tograms, IEEE Transactions on Systems, Man, and Cyber-
for the dataset in the modeling stage and the use of the netics 1979, 9: 62–66.
11. Paliwal J, Visen NS, and Jayas DS, AE—Automation and
weighted k-NN algorithm resulted in a 10% increase
Emerging Technologies: Evaluation of Neural Network
in the accuracy. Architectures for Cereal Grain Classification using Mor-
With the developed system, it will be easier to phological Features, Journal of Agricultural Engineering
store and process the same kind of products and the Research 2001, 79: 361–370.Progress in Nutrition 2021; Vol. 23, N. 2: e2021044 9
12. Liu ZY, Cheng F, Ying YB, and Rao XQ, Identification of 22. Han J, Pei J, and Kamber M. Data mining: concepts and
rice seed varieties using neural network, Journal of Zhejiang techniques, Elsevier, 2011.
University Science. B 2005, 6: 1095–1100. 23. Duda RO, Hart PE, and Stork DG. Pattern classification,
13. Symons SJ, and Fulcher RG. Determination of wheat kernel John Wiley & Sons, 2012.
morphological variation by digital image analysis: I. Varia- 24. Coomans D, and Massart DL. Alternative k-nearest neigh-
tion in Eastern Canadian milling quality wheats, Journal of bour rules in supervised pattern recognition: Part 1. k-Near-
Cereal Science 1988, 8: 211–218. est neighbour classification by using alternative voting rules,
14. Pazoki A, Farokhi F, and Pazoki Z. Classification of rice Analytica Chimica Acta 1982,136: 15–27.
grain varieties using two Artificial Neural Networks (MLP 25. Gärtner T, Lloyd JW, and Flach PA. Kernels and distances
and Neuro-Fuzzy), The Journal of Animal & Plant Sciences for structured data, Machine Learning 2004, 57: 205–232.
2014, 24: 336–343. 26. Mohamed TM. Pulsar selection using fuzzy kNN classifier,
15. Hossin M, Sulaiman MN, Mustapha A, and Mustapha N. Future Computing and Informatics Journal 2018, 3: 1–6.
A Novel Performance Metric for Building an Optimized 27. Dudani SA. The distance-weighted k-nearest-neighbor
Classifier, Journal of Computer Science 2011, 7(4):582–590. rule, IEEE Transactions on Systems, Man, and Cybernetics
16. Hossin M, and Sulaiman M. A review on evaluation met- 1976, 325–327.
rics for data classification evaluations, International Jour- 28. Srivastava A., Singh MP, and Kumar P. Supervised semantic
nal of Data Mining & Knowledge Management Process analysis of product reviews using weighted k-NN classifier.
2015, 5: 1. 11th International Conference on Information Technology:
17. Sokolova M, and Lapalme G. A systematic analysis of per- New Generations 2014, 502–507.
formance measures for classification tasks, Information Pro- 29. Hassanat AB, Abbadi MA, Altarawneh GA, Alhasanat
cessing & Management 2009, 45: 427–437. AA. Solving the Problem of the K Parameter in the KNN
18. James G, Witten D, Hastie T, and Tibshirani R. An Intro- Classifier Using an Ensemble Learning Approach. Interna-
duction To Statistical Learning, Springer, 2013. tional Journal of Computer Science and Information Secu-
19. Kuhn M, and Johnson K. Applied predictive modeling, rity, 2014,. 12(8): 33–39.
Springer, 2013.
20. Chatterjee C, Roychowdhury VP, Chong EKP. On Relative
Convergence Properties of Principal Component Analysis Corresponding author: ridvansaracoglu@yyu.edu.tr
Algorithms, IEEE Transactions on Neural Networks 1998,
9(2): 319–329.
21. Mitchell TM. Machine learning, McGraw Hill, 1997.You can also read