A dynamic prediction model for prognosis of acute on chronic liver failure based on the trend of clinical indicators
←
→
Page content transcription
If your browser does not render page correctly, please read the page content below
www.nature.com/scientificreports
OPEN A dynamic prediction model
for prognosis of acute‑on‑chronic
liver failure based on the trend
of clinical indicators
Zhenjun Yu1,6, Yu Zhang1,6, Yingying Cao1, Manman Xu2, Shaoli You3, Yu Chen2, Bing Zhu3,
Ming Kong2, Fangjiao Song3, Shaojie Xin3*, Zhongping Duan2* & Tao Han1,4,5*
Acute-on-chronic liver failure (ACLF) is a dynamic syndrome, and sequential assessments can reflect
its prognosis more accurately. Our aim was to build and validate a new scoring system to predict
short-term prognosis using baseline and dynamic data in ACLF. We conducted a retrospective cohort
analysis of patients with ACLF from three different hospitals in China. To construct the model, we
analyzed a training set of 541 patients from two hospitals. The model’s performance was evaluated in
a validation set of 130 patients from another center. In the training set, multivariate Cox regression
analysis revealed that age, WGO type, basic etiology, total bilirubin, creatinine, prothrombin activity,
and hepatic encephalopathy stage were all independent prognostic factors in ACLF. We designed a
dynamic trend score table based on the changing trends of these indicators. Furthermore, a logistic
prediction model (DP-ACLF) was constructed by combining the sum of dynamic trend scores and
baseline prognostic parameters. All prognostic scores were calculated based on the clinical data
of patients at the third day, first week, and second week after admission, respectively, and were
correlated with the 90-day prognosis by ROC analysis. Comparative analysis showed that the AUC
value for DP-ACLF was higher than for other prognostic scores, including Child–Turcotte–Pugh, MELD,
MELD-Na, CLIF-SOFA, CLIF-C ACLF, and COSSH-ACLF. The new scoring model, which combined
baseline characteristics and dynamic changes in clinical indicators to predict the course of ACLF,
showed a better prognostic ability than current scoring systems. Prospective studies are needed to
validate these results.
Abbreviations
ACLF Acute-on-chronic liver failure
CTP Child–Turcotte–Pugh
MELD Model for End-stage Liver Disease score
CLIF-SOFA Chronic Liver Failure Sequential Organ Failure Assessment score
CLIF-C ACLF Chronic Liver Failure Consortium Acute-on-Chronic Liver Failure score
APASL Asian Pacific Association for the Study of the Liver
AARC APASL ACLF Research Consortium
WGO World Gastroenterology Organization
TB Serum total bilirubin
INR International normalized ratio
PTA Prothrombin activity
1
Department of Hepatology and Gastroenterology, The Third Central Clinical College of Tianjin Medical University,
No. 83, Jintang Road, Hedong District, Tianjin 300170, China. 2Liver Disease Center (Difficult & Complicated
Liver Diseases and Artificial Liver Center), Beijing You’an Hospital Affiliated to Capital Medical University, Beijing,
China. 3Liver Failure Treatment and Research Center, The Fifth Medical Center of Chinese, PLA General Hospital,
Beijing, China. 4Department of Hepatology and Gastroenterology, Tianjin Third Central Hospital Affiliated to
Nankai University, Tianjin, China. 5Tianjin Key Laboratory of Extracorporeal Life Support for Critical Diseases,
Artificial Cell Engineering Technology Research Center, Tianjin Institute of Hepatobiliary Disease, The Tianjin
Third Central Hospital, Tianjin, China. 6These authors contributed equally: Zhenjun Yu and Yu Zhang. *email:
xinshaojie302@163.com; duan2517@163.com; hantaomd@126.com
Scientific Reports | (2021) 11:1810 | https://doi.org/10.1038/s41598-021-81431-0 1
Vol.:(0123456789)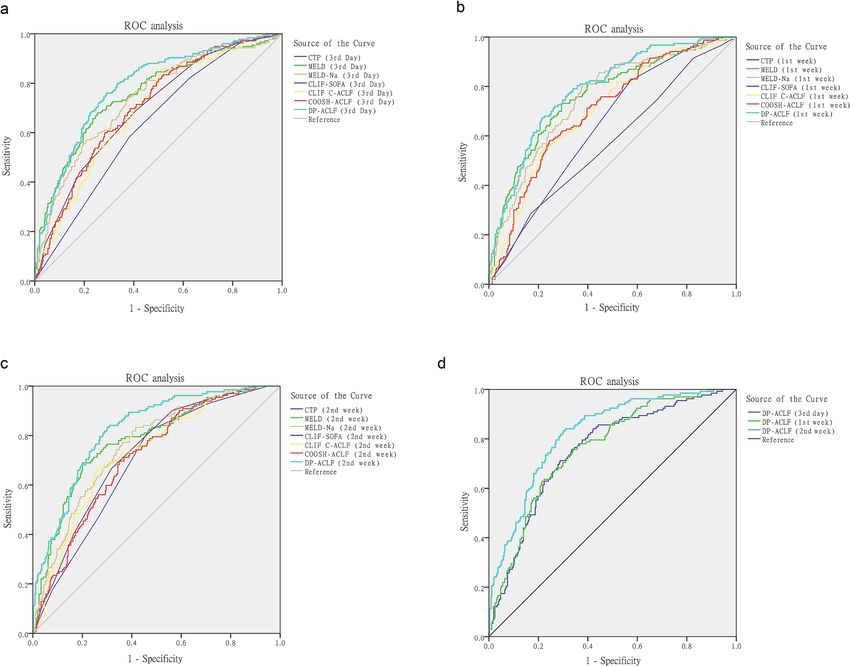
www.nature.com/scientificreports/
ALSS Artificial liver support system
MELD-Na MELD-sodium
HBV Hepatitis B virus
HBV-ACLF Hepatitis B virus-related ACLF
COSSH Chinese Group on the Study of Severe Hepatitis B
AUC Area under the ROC curve
Cr Serum creatinine
HE Hepatic encephalopathy
DP-ACLF The dynamic prediction model for prognosis of ACLF
SDTs Sum of dynamic trend score
Acute-on-chronic liver failure (ACLF) is a clinical syndrome characterized by acute decompensation of chronic
liver disease, and often triggered by acute strikes or precipitating e vents1. It can be accompanied by multiple organ
failures, and poses a major threat to public health2. Additionally, ACLF is an extraordinarily dynamic syndrome
that can either improve or even completely resolve in up to 50% of cases, while in others it may deteriorate to
a life-threatening condition due to disease progression3. Due to the high mortality rate, accurate prognosis
prediction in ACLF has always been a hot topic in liver research. Early recognition of the poor prognosis in
ACLF is not only helpful to minimize ineffective and expensive treatments, but also for rational allocation of
liver transplantation r esources4.
Although a variety of scoring systems have been developed to assess prognosis in ACLF, most of them are
based on clinical indicators at the time of diagnosis. Examples are the classic Child–Turcotte–Pugh (CTP) and
Model of End-stage Liver Disease (MELD) s core5,6, or the more recent Chronic Liver Failure Sequential Organ
Failure Assessment (CLIF-SOFA) and Chronic Liver Failure Consortium Acute-on-Chronic Liver Failure (CLIF-
C ACLF) score proposed by the European Association for the Study of Chronic Liver F ailure7,8. In recent years,
research has focused on dynamic assessments that reflect more accurately the clinical condition and prognosis of
ACLF. For example, Gustot et al.9 evaluated the clinical course by comparing the CLIF-C ACLF scores of patients
at different time points, and found a close correlation between prognosis and changes in clinical condition. Most
of the patients would have a clear prognosis between day 3 and 7 of hospital admission and clinical decisions
such as evaluation for liver transplant or discussion over goals of care could be tailored using clinical scores. The
ACLF guidelines proposed by the Asian Pacific Association for the Study of the Liver (APASL)10 recommend
that ACLF patients should be assessed with the APASL ACLF Research Consortium (AARC)-ACLF score on
admission and dynamically evaluated on the 4th and 7th day of treatment to predict progression. The cumulative
mortality increases with rises in the AARC-ACLF score in the first w eek10.
Due to its rapidly changing nature, both initial characteristics and dynamic trends of clinical indicators are
helpful to predict prognosis in A CLF11. Sequential assessment at multiple time-points may accurately reflect the
clinical course and the responsiveness to medical treatment, and theoretically improve the prognostic ability
compared to a single time-point12. This research aimed to build a dynamic prediction model of ACLF using
baseline and dynamic clinical indicators, with the purpose to provide a basis for the development of individual-
ized treatment.
Materials and methods
Study design, participants, and data collection. This was a multicenter retrospective cohort study
performed in China (ChiCTR1900021539). Two groups of patients were analyzed: one for building a predictive
model (training set) and the other for model validation (validation set). The training group included patients
admitted to the Tianjin Third Central Hospital and the Fifth Medical Center of PLA General Hospital between
November 1, 2012 and June 30, 2019. The validation group included patients admitted to Beijing You’an Hospital
Affiliated to Capital Medical University between January 1, 2015 and June 30, 2019.
Owing to the overlap of terminologies, more than a dozen definitions have emerged to describe ACLF, and the
most widely accepted ones are from the APASL and a joint conference of the European Association for the Study
of the Liver and the American Association for the Study of Liver Diseases13. Considering the differences between
Western and Eastern definitions, the World Gastroenterology Organization (WGO) established a new definition,
which divided ACLF into three categories based on the status of chronic liver disease: type-A for patients without
cirrhosis, type-B for well compensated cirrhosis and type-C for previous hepatic d ecompensation14. According
to the WGO classification, the inclusion criteria for ACLF cases in this study were as follows: on the basis of
chronic liver disease, a liver failure occurring and manifested as jaundice (serum total bilirubin [TB] ≥ 5 mg/dl)
and coagulation dysfunction (international normalized ratio [INR] ≥ 1.5 or prothrombin activity [PTA] < 40%)
within 4 weeks.
Exclusion criteria were as follows: (1) human immunodeficiency virus infection, (2) severe extrahepatic
chronic disease, mainly refers to primary heart failure, severe chronic pulmonary disease, and chronic kidney
disease requiring renal replacement therapy, etc. (3) Liver cancer or other malignancy, and (4) pregnancy.
Artificial liver support system (ALSS) treatment was performed in either single or combination mode. The
single-mode involved plasma exchange, and the combination mode consisted of plasma exchange together
with the double plasma molecular adsorption system treatment or with hemofiltration in patients with hepatic
encephalopathy or acute kidney injury. Depending on the patient’s condition, different treatment modalities for
ALSS were chosen, with treatment times ranging from one to three times per week.
All data on patients were retrieved from manual and electronic medical records. All study procedures fol-
lowed the principles of the Declaration of Helsinki. Being a retrospective study, this work was approved and the
Scientific Reports | (2021) 11:1810 | https://doi.org/10.1038/s41598-021-81431-0 2
Vol:.(1234567890)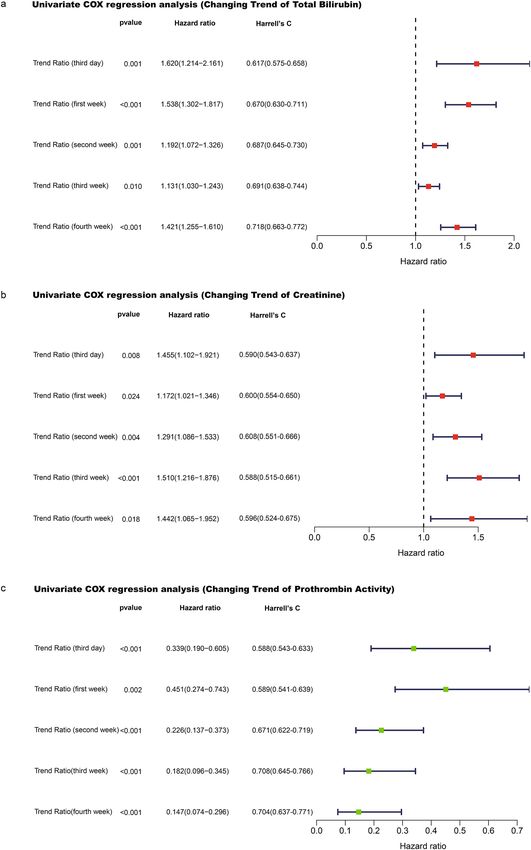
www.nature.com/scientificreports/
Figure 1. Flowchart of ACLF training and validation group cases screening.
need for informed consent was waived by the Ethics Committee of the Tianjin Third Central Hospital, Beijing
You’an Hospital Affiliated to Capital Medical University, and the Fifth Medical Center of PLA General Hospital.
Scoring models. Comparison with the following scoring models was performed: CTP5, MELD6,15, MELD-
sodium (MELD-Na)16, CLIF-SOFA7, CLIF-C A CLF8, and a prognostic scoring model for hepatitis B virus-related
ACLF (HBV-ACLF) proposed by the Chinese Group on the Study of Severe Hepatitis B (COSSH-ACLF)17. For a
detailed description of these scoring systems, please refer to Supplementary Information.
Statistical analysis. Continuous data were expressed as median (interquartile range), and properly ana-
lyzed by t-test, one-way Anova, and non-parametric Mann–Whitney U test. Categorical variables were expressed
in frequency (percentage) and compared by chi-square or Fisher precision tests. Multivariate Cox regression
analysis was used to determine the independent prognostic factors. In multivariate analysis, the binary logis-
tic regression equation was constructed according to the forward likelihood ratio test. The areas under the
ROC curve (AUC) of various prognostic scoring systems were compared using Delong’s z-test. Univariate Cox
regression of Harrell’s C /Somer’s D indexes was used to judge the fitting degree of survival model, and the
Kaplan–Meier method was used to compare the cumulative survival rate. All tests were double-tailed, and a p
value < 0.05 was considered statistically significant. Statistical analysis and mapping were performed using IBM
SPSS Statistics (version 22.0) (IBMCorp, North Castle, New York, USA), R (version 3.6.3)18, with rms and sur-
vival packages (Foundation for Statistical Computing, Vienna, Austria) (https://www.R-project.org), and Python
(version 3.7.6), with matplotlib and sklearn packages (Python Software Foundation, Beaverton, USA) (https://
www.python.org).
Results
Baseline characteristics of training set cases. A total of 592 cases meeting the inclusion and exclu-
sion criteria were collected, 40 cases with incomplete data and 11 cases with liver transplantation within 90 days
were further excluded. The remaining 541 patients (356 patients from the Tianjin Third Central Hospital and
185 patients from the Fifth Medical Center of PLA General Hospital), were enrolled in the training group.
Among them, there were a total of 453 patients with cirrhosis (83.7%), and 183 cases (33.8%) died within 90 days
(Fig. 1). Supplementary Table S1 describes the baseline characteristics of the training group upon admission.
Most patients were males and had a history of cirrhosis, with HBV infection as the most frequent etiology, fol-
lowed by alcoholic liver disease. More than half of patients had unclear or no obvious precipitating events.
Enrolled ACLF cases were classified into three different types: type A (without cirrhosis), type B (compensated
cirrhosis), and type C (decompensated cirrhosis). Prognosis at 90 days differed significantly depending on the
WGO type (χ2 = 20.800, p < 0.001), with the mortality rates of 44.4% in type C ACLF cases and 25.0%, 26.0%
in type A and B ACLF cases, respectively. Notably, we found that prognosis of type C patients with alcoholic
liver disease alone was significantly better than that of patients with HBV infection or HBV infection combined
with alcoholic liver disease (χ2 = 9.799, p = 0.007); while similar differences were absent in patients with type
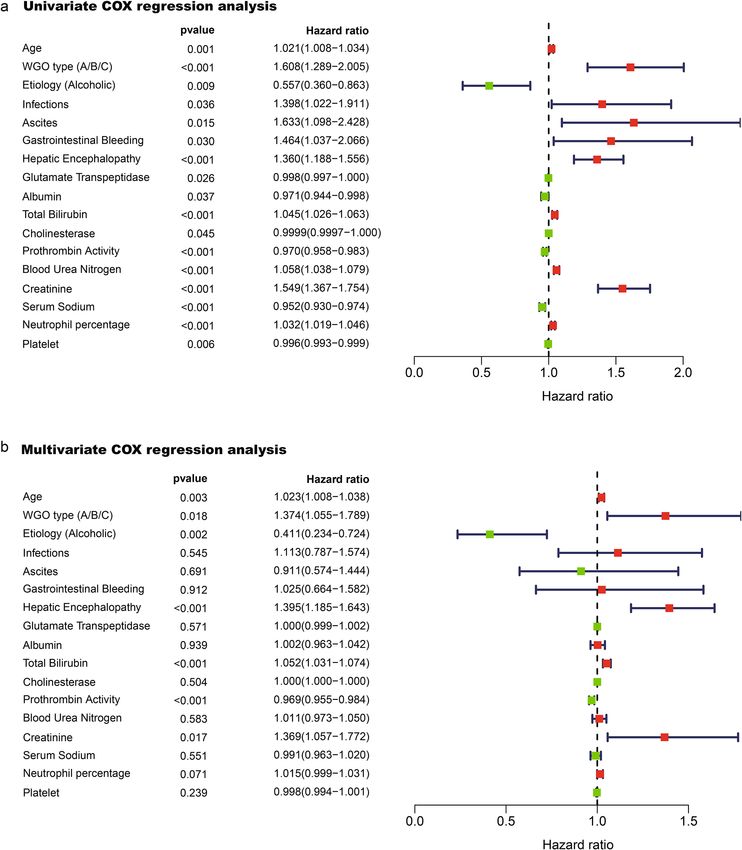
A or B ACLF (Table 1). Factors related to ACLF prognosis in Univariate Cox analysis were shown in Fig. 2a.
Multivariate Cox regression analysis showed that age, WGO type, alcoholic etiology, TB, serum creatinine (Cr),
PTA, and hepatic encephalopathy (HE) (defined by the West-Haven c riteria19) were all independent prognostic
factors of ACLF (Fig. 2b).
In the training set, 37.9% of the patients were treated with an ALSS treatment. Regarding the effect of ALSS
on prognosis, we performed the Univariate Cox regression analysis, which uncovered no significant difference
Scientific Reports | (2021) 11:1810 | https://doi.org/10.1038/s41598-021-81431-0 3
Vol.:(0123456789)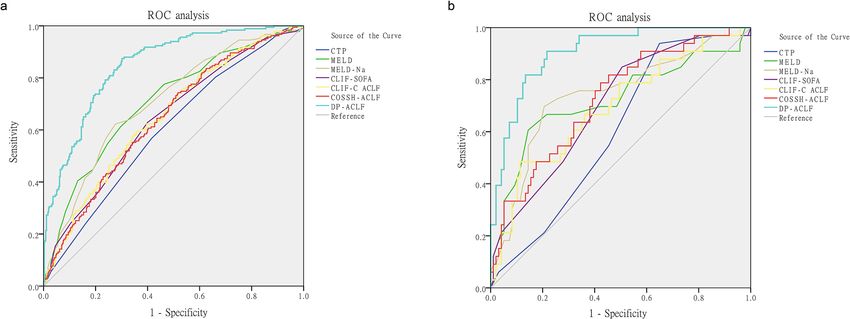
www.nature.com/scientificreports/

                                             WGO type    Etiology                  Survivor     Non-survivor   χ2 value   p value
                                                         Alcoholic, n(%)           6 (75.0%)    2 (25.0%)
                                             A           HBV, n(%)                 45 (75.0%)   15 (25.0%)     1.475      0.559
                                                         HBV and Alcoholic, n(%)   2 (50.0%)    2 (50.0%)
                                                         Alcoholic, n(%)           40 (78.4%)   11 (21.6%)
                                             B           HBV, n(%)                 80 (72.1%)   31 (27.9%)     1.199      0.576
                                                         HBV and Alcoholic, n(%)   10 (66.7%)   5 (33.3%)
                                                         Alcoholic, n(%)           33 (76.7%)   10 (23.3%)
                                             C           HBV, n(%)                 66 (50.0%)   66 (50.0%)     9.799      0.007
                                                         HBV and Alcoholic, n(%)   13 (50.0%)   13 (50.0%)

                                            Table 1.  Prognostic impact of HBV infection and alcoholic liver disease as basic etiologies in patients with
                                            ACLF, stratified by WGO types A, B, and C. HBV Hepatitis B virus.

                                            in short-term prognosis of ACLF patients (p > 0.05). Further stratified analysis was performed according to the
                                            age, sex, etiology, WGO type, MELD score and complications, the statistical results showed that there was no
                                            significant difference in the mortality of cases in each group with or without ALSS treatment (p > 0.05, respec-
                                            tively) (Supplementary Table S2).

                                            Development of the dynamic prediction model for prognosis of ACLF (DP‑ACLF). To determine
                                            whether the evolution of clinical indicators was related to the prognosis of ACLF, we analyzed the dynamic
                                            changes in independent prognostic factors (TB, Cr, and PTA). Temporal variation of these parameters was
                                            assessed at the third day and first, second, third, and fourth weeks after admission; Univariate Cox regression
                                            analysis was performed. We found that increases in TB and Cr and decreases in PTA at all time points were risk
                                            factors of death (Fig. 3a–c). Considering that 3–4 weeks may be an excessively long period for clinical observa-
                                            tion, we chose the third day, first week, and second week as the time nodes for calculating the changing trends
                                            of the parameters.
                                                In order to facilitate trend analysis of prognostic variables, we developed a dynamic trend score table. An
                                            increase in TB or Cr, a decrease in PTA of more than 30%, and the aggravation of HE stage were assigned 3
                                            points; a decrease in TB or Cr, an increase in PTA of more than 30%, and the improvement of HE stage were
                                            assigned 1 point. The detailed scoring criterias were shown in Table 2. To obtain a dynamic trend score model
                                            with the best fitting degree of survival time, the variation ranges of TB, Cr, and PTA were set at 10–50%, and the
                                            variation range of HE stage was set at 1–3 levels previously. Univariate Cox regression was used to calculate the
                                            corresponding variation range when each model of parameter score reached the best: most Harrell’s C indexes
                                            were at their best when variation ranges were set at 30% for TB, Cr, and PTA, and when HE stage variated one
                                            level (Supplementary Tables S3–5). Multivariate Cox regression analysis showed that the dynamic trend scores
                                            of TB, Cr, PTA and HE were all independent prognostic factors of ACLF (Supplementary Fig. S1).
                                                To develop a new 90-day prognosis prediction model, we calculated the sum of dynamic trend scores (SDTs)
                                            of each patient, performed binary logistic regression analysis in combination with other independent prognostic
                                            factors, and obtained the optimal prediction model parameters and OR values through a forward progressive
                                            elimination process: age (1.034), WGO type (1.385), alcoholic etiology (0.511), TB (1.085), Cr (2.492), PTA
                                            (0.960), and SDTs (2.263) (Table 3). The obtained formula for DP-ACLF was as follows: DP-ACLF = 0.033 × age
                                            (years) + 0.326 × WGO type + 0.082 × TB (mg/dL) + 0.913 × Cr (mg/dL) + 0.817 × SDTs − 0.04 × PTA
                                            (%) − 0.672 × Etiology.
                                                (Etiology was assigned 1 for alcoholic liver disease alone, and 0 for others).
                                                In patients with a survival time of more than 3 days (n = 533), each score was assessed at the third day after
                                            admission, and ROC curve comparisons showed AUC values as follows: DP-ACLF(0.787), CTP (0.632), MELD
                                            (0.756), MELD-Na (0.733), CLIF-SOFA (0.697), CLIF C ACLF (0.693), and COSSH-ACLF (0.706). The DP-
                                            ACLF had significantly higher AUCs than other scores at the third day (p < 0.05, respectively) (Table 4, Fig. 4a).
                                            And in patients with a survival time of more than 7 days (n = 511), each score was assessed at the first week after
                                            admission, and ROC curve comparisons showed AUC values as follows: DP-ACLF(0.788), CTP (0.642), MELD
                                            (0.760), MELD-Na (0.752), CLIF-SOFA (0.572), CLIF C ACLF (0.703), and COSSH-ACLF (0.703). The prognos-
                                            tic efficacy for DP-ACLF was significantly higher than for other scores at the first week (p < 0.05, respectively),
                                            except for the MELD and MELD-Na scores. (Table 4, Fig. 4b).
                                                In patients with a survival time of more than 14 days (n = 490), each score was assessed at the second week
                                            after admission, and ROC curve comparisons showed AUC values as follows: DP-ACLF(0.823), CTP (0.691),
                                            MELD (0.779), MELD-Na (0.759), CLIF-SOFA (0.728), CLIF C ACLF (0.729), and COSSH-ACLF (0.712). The
                                            DP-ACLF had significantly higher AUCs than other scores at the second week (p < 0.05, respectively) (Table 4,
                                            Fig. 4c). Furthermore, comparing the predictive efficacy of DP-ACLF scores at different time points in patients
                                            showed that the AUC values for DP-ACLF (2nd week) were significantly higher than those for DP-ACLF (3rd
                                            day) (z = 3.524, p < 0.001) and DP-ACLF (1st week) (z = 3.449, p < 0.001) (Fig. 4d).
                                                The ROC analysis of all patients in the training set showed that the AUC values and accuracy of DP-ACLF
                                            and the baseline data of other prognostic scores were as follows: DP-ACLF (0.850/76.3%), CTP (0.601/66.2%),
                                            MELD (0.706/69.7%), MELD-Na (0.706/68.2%), CLIF-SOFA (0.645/68.4%), CLIF-C ACLF (0.651/66.5%), and

          Scientific Reports |   (2021) 11:1810 |                   https://doi.org/10.1038/s41598-021-81431-0                                               4

Vol:.(1234567890)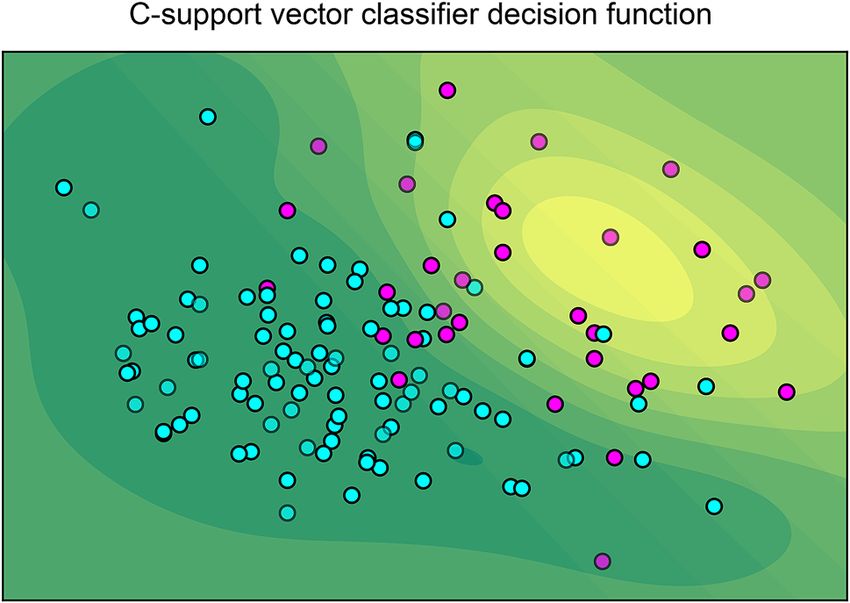
www.nature.com/scientificreports/

                                  Figure 2.  (a) Univariate Cox regression analysis showing that the factors related to ACLF prognosis were
                                  age, WGO type, basic etiology, bacterial infection, ascites, gastrointestinal bleeding, hepatic encephalopathy
                                  stage, glutamate transpeptidase, albumin, total bilirubin, cholinesterase, prothrombin activity, blood urea
                                  nitrogen, creatinine, serum sodium, neutrophil ratio, and platelets. (b), Multivariate Cox regression analysis
                                  confirmed that age, WGO type, alcoholic etiology, total bilirubin, creatinine, prothrombin activity, and hepatic
                                  encephalopathy stage remained associated with prognosis of ACLF. (Assignment of indexes in COX regression
                                  analysis was as follows: WGO type A, B, and C of ACLF were assigned 1, 2, and 3 respectively; basic etiology
                                  was assigned 1 for the alcoholic liver disease alone, and 0 for others; positive complications including bacterial
                                  infection, gastrointestinal bleeding, ascites were all assigned 1, no complications 0; hepatic encephalopathy
                                  was assigned 0, 1, 2, 3, and 4 according to the West Haven stages 0, I, II, III, and IV, respectively; artificial liver
                                  system support (ALSS) was assigned 1, no ALSS 0).

Scientific Reports |   (2021) 11:1810 |                 https://doi.org/10.1038/s41598-021-81431-0                                                          5

                                                                                                                                                    Vol.:(0123456789)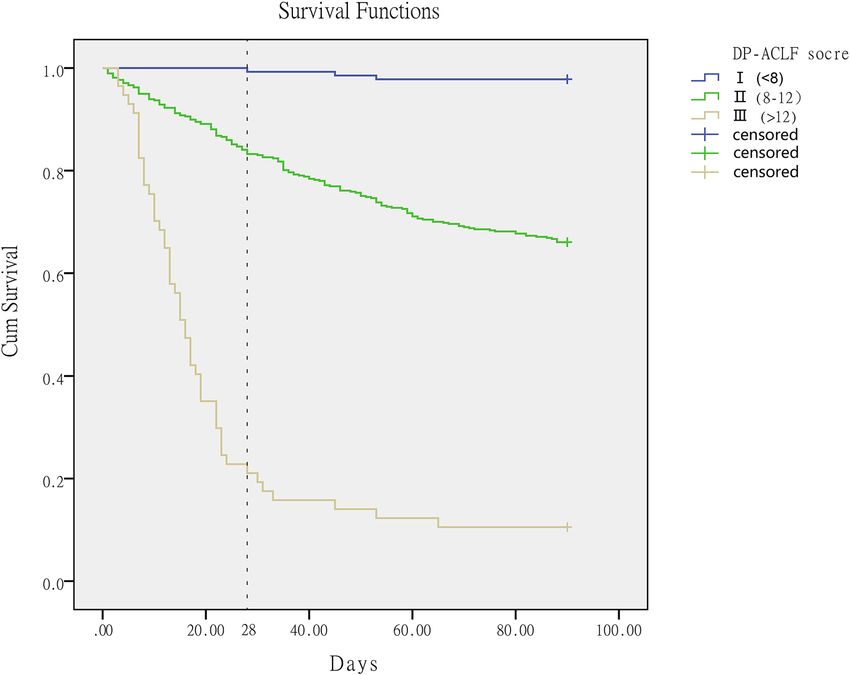
www.nature.com/scientificreports/

                                            Figure 3.  (a) Elevated levels of total bilirubin at the third day and first, second, third, and fourth weeks after
                                            admission were risk factors for death. The Harrell’s C index of model fitting degree showed an increasing trend
                                            with the extension of time. (b) Elevated levels of creatinine at the third day and first, second, third, and fourth
                                            weeks after admission were risk factors for death. The Harrell’s C index of model fitting degree increased to the
                                            highest value at the second week, and decreased slightly at other time points. (c) Declined levels of prothrombin
                                            activity at the third day and first, second, third, and fourth weeks after admission were all risk factors for death.
                                            The Harrell’s C index of model fitting degree showed an increasing trend with the extension of time.

          Scientific Reports |   (2021) 11:1810 |                https://doi.org/10.1038/s41598-021-81431-0                                                     6

Vol:.(1234567890)
www.nature.com/scientificreports/
Dynamic trend score 1 2 3
Total Bilirubin trend Decreased level > 30% Increased or decreased level ≤ 30% Increased level > 30%
Creatinine trend Decreased level > 30% Increased or decreased level ≤ 30% Increased level > 30%
Prothrombin activity trend Increased level > 30% Increased or decreased level ≤ 30% Decreased level > 30%
Hepatic Encephalopathy trend (West Haven stage) Improved level ≥ 1 Unchanged Aggravated level ≥ 1
Table 2. Dynamic trend scores based on the changing trends of total bilirubin, creatinine, prothrombin
activity, and hepatic encephalopathy stage.
Variable B SE Wald χ2 p value OR (95% CI)
Age 0.033 0.010 10.353 0.001 1.034 (1.013–1.055)
WGO type (A/B/C) 0.326 0.162 4.040 0.044 1.385 (1.008–1.902)
Etiology (alcoholic) − 0.672 0.314 4.586 0.032 0.511 (0.276–0.945)
Total bilirubin 0.082 0.015 31.545 < 0.001 1.085 (1.054–1.116)
Creatinine 0.913 0.211 18.727 < 0.001 2.492 (1.648–3.768)
Prothrombin activity − 0.040 0.010 18.075 < 0.001 0.960 (0.943–0.978)
Sum of dynamic trend scores (SDTs) 0.817 0.093 77.088 < 0.001 2.263 (1.886–2.715)
Constant − 10.441 1.128 85.702 < 0.001
Table 3. Logistic regression analysis of 90-day survival rates. SDTs Sum of dynamic trend scores.
COSSH-ACLF (0.644/66.7%). The DP-ACLF had significantly higher AUCs than other models (p < 0.001, respec-
tively), and its predictive accuracy was the best (Table 5 and Fig. 5a).
External validation of the DP‑ACLF (validation set cases). Overall, 142 cases of ACLF who met
the inclusion and exclusion criteria were collected from Beijing You’an Hospital Affiliated to Capital Medi-
cal University. Three cases with incomplete data and nine cases who underwent liver transplantation within
90 days were further excluded. The remaining 130 patients constituted the validation group, in which 97 cases
survived and 33 cases died within 90 days (Fig. 1). Supplementary Table S6 describes the baseline character-
istics of these patients. Compared with the training group, the median age in the validation group was lower
(t = 5.644, p < 0.001) and the proportion of male patients was higher (χ2 = 28.951, p = 0.003). The validation
group also had a higher proportion of patients with a basic etiology due to HBV infection and alcoholic liver
disease (χ2 = 210.991, p < 0.001). No significant differences were found between the training and validation
groups with regard to 90-day mortality or requirement of ALSS. ROC analysis showed that the predictive accu-
racy of DP-ACLF on ACLF prognosis was better in the validation group, with an AUC value of 0.907 and an
accuracy rate of 85.4%. These values were significantly higher than the baseline values of CTP (0.601/74.6%),
MELD (0.721/76.2%), MELD-Na (0.740/73.8%), CLIF-SOFA (0.701/76.9%), CLIF-C ACLF (0.694/74.6%), and
COSSH-ACLF (0.724/77.7%) (p < 0.001, respectively) (Table 6 and Fig. 5b).
Based on the DP-ACLF scores, C-support vector classifier function was used to predict the decision function
value of each case. Python software with sklearn packages revealed that DP-ACLF had an excellent ability to
discriminate survival and non-survival cases (Fig. 6). Univariate Cox analysis was used to evaluate the model
fit of each prognostic model for the survival time and state of patients. The results showed that the Harrell’s
C and Somer’s D values of each model were as follows: DP-ACLF (0.877/0.754), CTP (0.580/0.160), MELD
(0.700/0.400), MELD-Na (0.715/0.430), CLIF-SOFA (0.683/0.366), CLIF-C ACLF (0.683/0.366), and COSSH-
ACLF (0.714/0.428). Harrell’s C and Somer’s D indexes for DP-ACLF were higher than for other models (Table 7).
The DP-ACLF scores in the two groups ranged from 4 to 15. The 28-day and 90-day survival rates of
patients with different DP-ACLF scores can be found in the supplementary Figure S2. When categorizing ACLF
patients into grade I (DP-ACLF < 8), grade II (DP-ACLF between 8 and 12), and grade III (DP-ACLF > 12),
Kaplan–Meier analysis showed that the 90-day cumulative survival rate was 97.8% for grade I patients, 66.0% for
grade II patients, and 10.5% for grade III patients; these differences were all statistically significant (χ2 = 270.194,
p < 0.001). Additionally, 28-day cumulative survival rates were also significantly different in grade I, II, and III
patients (99.3%, 83.2%, and 21.1%, respectively) (χ2 = 238.411, p < 0.001) (Fig. 7).
Discussion
Main findings. Using a large multi-center group of ACLF patients (training set), we identified that age,
WGO type, basic etiology, and clinical indicators such as TB, Cr, PTA, and HE stage were independent prog-
nostic factors in ACLF. Furthermore, we found that the dynamic trends of TB, Cr, PTA, and HE stage were
also independent prognostic factors. On this basis, we constructed a new logistic dynamic prognosis prediction
model: DP-ACLF. This model showed better predictive efficacy than other prognostic scoring systems at differ-
Scientific Reports | (2021) 11:1810 | https://doi.org/10.1038/s41598-021-81431-0 7
Vol.:(0123456789)www.nature.com/scientificreports/
Time point (cases, *z statistic (p
n) Variable AUC (95% CI) St Cut-off value Sensitivity Specificity value)
CTP (3rd day) 0.632 (0.590–0.673) 0.024 12 0.583 0.617 5.595 (p < 0.001)
MELD (3rd day) 0.756 (0.717–0.791) 0.023 25 0.680 0.746 2.171 (p = 0.030)
MELD-Na (3rd
0.733 (0.694–0.770) 0.023 26 0.743 0.620 2.975 (p = 0.003)
day)
CLIF-SOFA (3rd
The third day after 0.697 (0.656–0.736) 0.023 8 0.691 0.589 4.209 (p < 0.001)
day)
admission (n = 533)
CLIF-C ACLF (3rd
0.693 (0.652–0.732) 0.024 39 0.857 0.480 3.944 (p < 0.001)
day)
COSSH-ACLF (3rd
0.706 (0.665–0.744) 0.023 6 0.817 0.500 3.549 (p < 0.001)
day)
DP-ACLF (3rd day) 0.787 (0.749–0.821) 0.021 9.7 0.760 0.710 NA
CTP (1st week) 0.642 (0.598–0.683) 0.025 11 0.824 0.427 5.229 (p < 0.001)
MELD (1st week) 0.760 (0.721–0.797) 0.024 23 0.732 0.704 1.702 (p = 0.089)
MELD-Na (1st
0.752 (0.712–0.789) 0.023 25 0.811 0.620 1.796 (p = 0.073)
week)
CLIF-SOFA (1st
0.572 (0.528–0.615) 0.027 9 0.288 0.830 6.514 (p < 0.001)
The first week after week)
admission (n = 511)
CLIF-C ACLF (1st
0.703 (0.661–0.742) 0.025 44 0.556 0.771 3.446 (p < 0.001)
week)
COSSH-ACLF (1st
0.703 (0.662–0.743) 0.024 6 0.582 0.754 3.614 (p < 0.001)
week)
DP-ACLF (1st
0.788 (0.750–0.823) 0.021 10 0.673 0.785 NA
week)
CTP (2nd week) 0.691 (0.648–0.732) 0.025 11 0.818 0.534 6.044 (p < 0.001)
MELD (2nd week) 0.779 (0.739–0.815) 0.024 24 0.689 0.799 2.482 (p = 0.013)
MELD-Na (2nd
0.759 (0.718–0.796) 0.023 23 0.833 0.584 3.017 (p = 0.003)
week)
CLIF-SOFA (2nd
The second week 0.728 (0.687–0.767) 0.024 8 0.667 0.682 5.230 (p < 0.001)
week)
after admission
(n = 490) CLIF-C ACLF (2nd
0.729 (0.687–0.768) 0.025 42 0.667 0.740 4.814 (p < 0.001)
week)
COSSH-ACLF (2nd
0.712 (0.669–0.752) 0.025 6 0.697 0.651 5.089 (p < 0.001)
week)
DP-ACLF (2nd
0.823 (0.786–0.856) 0.020 9.4 0.833 0.698 NA
week)
Table 4. Training group: ROC correlation analysis and comparison of DP-ACLF and other prognostic scores
at the third day, first week and second week after admission.
ent time points. Classifications of ACLF based on DP-ACLF helped discriminate patients concerning 28- and
90-day mortalities.
Comparison with previous research. In our study, we confirmed that prognosis varied depending on
WGO ACLF type, and type C was a risk factor for short-term mortality in ACLF. A recent Chinese research on
the tri-typing of HBV-ACLF in accordance with the WGO definition also showed that type-C ACLF obtained the
highest 28-day (65.2%) and 90-day (75.3%) mortalities, compared with type-A (48.7% and 54.4%, respectively)
and type-B (48.4% and 62.8% respectively) ACLF cases; tri-typing of HBV-ACLF was able to distinguish clini-
cal characteristics, including precipitating events, organ failure, and short-term prognosis in ACLF p atients20.
In addition, stratified analysis based on WGO type revealed significant prognostic differences in type C
ACLF with regard to etiology (HBV infection or alcohol). The MELD score6,15 included the basic etiology in the
calculation formula, patients with cholestasis and alcoholic liver disease might have better prognoses than those
with other etiologies. It was also suggested that liver failure due to viral hepatitis might have a poorer prognosis.
However, in type A and B ACLF in our study, the prognosis of HBV-ACLF was not significantly worse than that
of ACLF with alcoholic liver disease. The prognostic impact of different etiologies, such as HBV infection, alcohol,
autoimmune, or other underlying liver diseases, were also not found in the APASL-AARC guidelines, in which
the diagnostic criteria for ACLF only include non-cirrhotic or compensated cirrhosis p atients21. Therefore, the
effect of etiology on short-term prognosis might be more pronounced in type C ACLF.
Due to significant differences in the definition of ACLF between Eastern and Western countries, the underly-
ing etiology, precipitating events, and prognosis of ACLF differ in different regions22. Therefore, many researches
recently had been devoted to the development of diagnostic criteria and prognostic models for single-etiology
ACLF. The COSSH study from China, for example, provided a useful exploration of the diagnostic criteria and
prognosis of HBV-ACLF17. However, there is still a need in clinical practice for prognostic models that can
identify high-risk ACLF populations in patients with different etiologies and states of chronic liver diseases. In
Scientific Reports | (2021) 11:1810 | https://doi.org/10.1038/s41598-021-81431-0 8
Vol:.(1234567890)www.nature.com/scientificreports/
Figure 4. (a–c) DP-ACLF scores based on the patients of the training set at the third day, first week, and second
week after admission, respectively, and comparison of ROC curves with other prognostic scores at the same time
point. (d) ROC curve comparisons of DP-ACLF scores at different time points.
Positive likelihood Negative likelihood
Variable AUC (95% CI) St Cut-off value Sensitivity Specificity ratio ratio Accuracy *z statistic (p value)
CTP 0.601 (0.558–0.643) 0.025 12 0.568 0.584 0.058 0.029 66.2% 8.616 (p < 0.001)
MELD 0.706 (0.666–0.744) 0.024 25 0.612 0.704 0.326 0.078 69.7% 6.777 (p < 0.001)
MELD-Na 0.706 (0.666–0.744) 0.023 28 0.623 0.724 0.376 0.122 68.2% 6.363 (p < 0.001)
CLIF-SOFA 0.645 (0.603–0.685) 0.024 8 0.628 0.601 0.181 0.047 68.4% 8.174 (p < 0.001)
CLIF-C ACLF 0.651 (0.610–0.692) 0.025 43 0.579 0.656 0.212 0.091 66.5% 7.612 (p < 0.001)
COSSH-ACLF 0.644 (0.602–0.685) 0.025 6 0.743 0.483 0.151 0.062 66.7% 7.871 (p < 0.001)
DP-ACLF 0.850 (0.817–0.879) 0.017 9.4 0.874 0.698 1.259 0.151 76.3% NA
Table 5. Training group: ROC correlation analysis and comparison of DP-ACLF and other prognostic scores.
this study, both WGO type and basic etiology were included in the new model, which significantly expanded
the clinical applicability of the model.
ALSS is an important treatment for patients with ACLF, however, the results of current studies on whether
treatment with ALSS can improve the prognosis of ACLF are not consistent. Andreas et al.23 conducted a pro-
spective study in 10 university hospitals in 7 European countries and found that the prometheus system did
not improve the short-term prognosis of ACLF patients, but it could improve the 90-day survival rate of ACLF
patients with MELD > 30 points. A meta-analysis that included 25 randomized controlled studies of 738 patients
with ALF and 1040 with ACLF found that ALSS reduced mortality by 16% in patients with liver failure, with a
particularly significant effect on ACLF24. However, in this study, due to the fact that only 37.9% of cases were
treated with ALSS, the sample size was small, and there were numerous factors influencing the prognosis of
Scientific Reports | (2021) 11:1810 | https://doi.org/10.1038/s41598-021-81431-0 9
Vol.:(0123456789)www.nature.com/scientificreports/
Figure 5. The DP-ACLF score was compared with the baseline data of other prognostic scoring systems, and
ROC curves were performed to determine prognostic accuracy. (a) Training group. (b) Validation group.
Positive likelihood Negative likelihood
Variable AUC (95% CI) St Cut-off value Sensitivity Specificity ratio ratio Accuracy *z statistic (p value)
CTP 0.601 (0.511–0.685) 0.051 11 0.939 0.351 0.031 0.010 74.6% 5.647 (p < 0.001)
MELD 0.721 (0.636–0.796) 0.059 26 0.606 0.856 0.269 0.054 76.2% 3.637 (p < 0.001)
MELD-Na 0.740 (0.655–0.813) 0.054 27 0.697 0.794 0.222 0.078 73.8% 3.571 (p < 0.001)
CLIF-SOFA 0.701 (0.615–0.778) 0.050 8 0.849 0.495 0.138 0.010 76.9% 4.596 (p < 0.001)
CLIF-C ACLF 0.694 (0.607–0.771) 0.055 48 0.485 0.887 0.138 0.043 74.6% 4.534 (p < 0.001)
COSSH-ACLF 0.724 (0.639–0.799) 0.051 6 0.788 0.577 0.320 0.043 77.7% 4.446 (p < 0.001)
DP-ACLF 0.907 (0.843–0.951) 0.027 9.7 0.909 0.784 1.75 0.078 85.4% NA
Table 6. Validation group: ROC correlation analysis and comparison of DP-ACLF and other prognostic
scores.
Figure 6. According to the DP-ACLF scores, C-support vector classifier function was used to predict the
decision function value of each case in the validation group. Python software with matplotlib and sklearn
packages was used to show that 90 cases of survivors (blue) (survival time ≥ 90 days) and 21 cases of non-
survivors (red) (survival time < 90 days) were distributed in the green and yellow areas, respectively. The darker
the color of the region in which the dots were located, the more accurate the prediction was.
ACLF, resulting in failure to find a statistically significant difference in the effect of ALSS on prognosis. In the
future, a definitive stratified analysis of ACLF patients with a single cause, same severity and stage may help to
further clarify the role of ALSS interventions on the prognosis.
It is well known that ACLF is a dynamic syndrome which is reversible in a considerable proportion of patients,
and this feature is closely related to improvement of prognosis, suggesting the importance of sequential dynamic
Scientific Reports | (2021) 11:1810 | https://doi.org/10.1038/s41598-021-81431-0 10
Vol:.(1234567890)www.nature.com/scientificreports/
Variable p value Hazard ratio (95% CI) Harrell’s C (95% CI) Somer’s D (95% CI)
CTP 0.106 1.214 (0.959–1.540) 0.580 (0.504–0.664) 0.160 (0.008–0.328)
MELD p < 0.001 1.148 (1.079–1.220) 0.700 (0.603–0.799) 0.400 (0.206–0.598)
MELD-Na p < 0.001 1.072 (1.038–1.108) 0.715 (0.626–0.805) 0.430 (0.252–0.610)
CLIF-SOFA p < 0.001 1.612 (1.270–2.047) 0.683 (0.630–0.773) 0.366 (0.260–0.546)
CLIF-C ACLF p < 0.001 1.093 (1.042–1.147) 0.683 (0.590–0.780) 0.366 (0.180–0.560)
COSSH-ACLF p < 0.001 2.736 (1.799–4.162) 0.714 (0.630–0.800) 0.428 (0.260–0.600)
DP-ACLF p < 0.001 2.564 (2.008–3.274) 0.877 (0.832–0.923) 0.754 (0.664–0.846)
Table 7. Validation group: univariate Cox regression analysis of survival time and ACLF status with DP-ACLF
and other prognostic scoring systems.
Figure 7. Kaplan–Meier survival analysis showing a significant difference in 28-day (χ2 = 238.411, p < 0.001)
and 90-day cumulative survival rates (χ2 = 270.194, p < 0.001) in patients with ACLF who were graded according
to the DP-ACLF score.
assessment25,26. Moreau et al.7 reported that when the CLIF-C ACLF score was computed at 48 h, 3–7 days, and
8–15 days after the diagnosis of ACLF, the predictive accuracy of 28-day mortality was significantly better than
when the score was calculated at the diagnosis. Many studies had chosen the 3rd to 7th day after diagnosis as the
evaluation time-point. For example, previous research reported that there were significant differences in clinical
characteristics and risk factors of ACLF between day 1 and 7, and ACLF classification at days 3–7, rather than at
diagnosis, was the best predictor of prognosis9. However, it had also been argued that the duration of the ACLF
should be 12 weeks, since the data on ACLF in patients with cirrhosis who had undergone surgery showed a
12-week period of increased risk of mortality2. Clinically, some ACLF patients either recover or deteriorate
rapidly within 3–7 days, while others show a protracted course, with good or poor prognosis in 1–3 months;
those patients with late deterioration still need to be considered for liver transplantation. Thus, much attention
should be paid to changes occurring in ACLF at days 3–7 after admission, as well as the other time points; this
would not only help determine prognosis, but also aid in the proper design of liver transplantation protocols.
For instance, it had been reported that change in MELD score at the second week provided an early opportunity
for prognostication in ACLF. A MELD score that did not deteriorate by week 2 would predict 93.8% chance of
survival for the next 60 days27.
Although the levels of clinical indicators such as TB, Cr, PTA, and HE at diagnosis were closely correlated
with ACLF prognosis, and were relatively common in previous ACLF scoring systems, their changing trends
Scientific Reports | (2021) 11:1810 | https://doi.org/10.1038/s41598-021-81431-0 11
Vol.:(0123456789)www.nature.com/scientificreports/
during clinical course were also important determinants of short-term mortality. Herein, the dynamic trends of
ACLF indicators were combined with baseline data to obtain a new model, DP-ACLF, which could accurately
reflect the clinical course and the responsiveness to medical treatment. At the third day, first week, and second
week after admission for patients with ACLF, the short-term prognostic performance of DP-ACLF was superior
to other prognostic scores, including CTP, MELD, MELD-Na, CLIF-SOFA, CLIF-C ACLF, and COSSH-ACLF.
And for patients with survived time longer than 2 weeks, the second week of DP-ACLF score had the highest
predictive efficacy. Additionally, classification of ACLF into grades I, II, and III based on the DP-ACLF score
could be evaluated to discriminate patients concerning 28- and 90-day mortalities more accurately, and thus
facilitated timely clinical decision-making and healthcare resource allocation.
Limitations. This was a retrospective study and selective bias might be present. However, its multicentric
nature, objective inclusion and exclusion criteria, and low data loss helped to mitigate the potential for such bias.
Conclusion
In patients with ACLF, initial baseline characteristics as well as dynamic trends in clinical indicators are benefit
for predicting clinical course and short-term prognosis. The dynamic prediction model proposed in this study
was superior to other established scoring models in predicting ACLF prognosis. Prospective studies should be
conducted to further validate the predictive performance of the DP-ACLF. We hope our findings may help clini-
cians to better identify high-risk ACLF patients and optimize clinical decision-making.
Received: 24 August 2020; Accepted: 6 January 2021
References
1. Hernaez, R., Solà, E., Moreau, R. & Ginès, P. Acute-on-chronic liver failure: An update. Gut 66, 541–553. https://doi.org/10.1136/
gutjnl-2016-312670 (2017).
2. Bajaj, J. S. et al. Acute-on-chronic liver failure: Getting ready for prime time?. Hepatology (Baltimore, MD) 68, 1621–1632 (2018).
3. Jalan, R. et al. Role of predisposition, injury, response and organ failure in the prognosis of patients with acute-on-chronic liver
failure: A prospective cohort study. Crit. Care (London, England) 16, R227. https://doi.org/10.1186/cc11882 (2012).
4. Bajaj, J. S. et al. Survival in infection-related acute-on-chronic liver failure is defined by extrahepatic organ failures. Hepatology
(Baltimore, MD) 60, 250–256. https://doi.org/10.1002/hep.27077 (2014).
5. Pugh, R., Murray-Lyon, I., Dawson, J., Pietroni, M. & Williams, R. Transection of the oesophagus for bleeding oesophageal varices.
Br. J. Surg. 60, 646–649 (1973).
6. Kamath, P. S. & Kim, W. R. The model for end-stage liver disease (MELD). Hepatology (Baltimore, MD) 45, 797–805 (2007).
7. Moreau, R. et al. Acute-on-chronic liver failure is a distinct syndrome that develops in patients with acute decompensation of
cirrhosis. Gastroenterology 144, 1426–1437 (2013).
8. Jalan, R. et al. Development and validation of a prognostic score to predict mortality in patients with acute-on-chronic liver failure.
J. Hepatol. 61, 1038–1047 (2014).
9. Gustot, T. et al. Clinical Course of acute-on-chronic liver failure syndrome and effects on prognosis. Hepatology (Baltimore, MD)
62, 243–252 (2015).
10. Choudhury, A. et al. Liver failure determines the outcome in patients of acute-on-chronic liver failure (ACLF): Comparison of
APASL ACLF research consortium (AARC) and CLIF-SOFA models. Hep. Int. 11, 461–471. https://doi.org/10.1007/s12072-017-
9816-z (2017).
11. Ha, J. M. et al. Static and dynamic prognostic factors for hepatitis-B-related acute-on-chronic liver failure. Clin. Mol. Hepatol. 21,
232 (2015).
12. Pereira, G. et al. Combination and sequential evaluation of acute-on-chronic liver failure (ACLF) and hyponatremia and prognosis
in cirrhotic patients. Digest. Liver Dis. 52, 91–97. https://doi.org/10.1016/j.dld.2019.08.013 (2020).
13. Sarin, S. K. & Choudhury, A. Acute-on-chronic liver failure: Terminology, mechanisms and management. Nat. Rev. Gastroenterol.
Hepatol. 13, 131–149. https://doi.org/10.1038/nrgastro.2015.219 (2016).
14. Jalan, R. et al. Toward an improved definition of acute-on-chronic liver failure. Gastroenterology 147, 4–10 (2014).
15. Kamath, P. S. et al. A model to predict survival in patients with end-stage liver disease. Hepatology (Baltimore, MD) 33, 464–470.
https://doi.org/10.1053/jhep.2001.22172 (2001).
16. Biggins, S. W. et al. Evidence-based incorporation of serum sodium concentration into MELD. Gastroenterology 130, 1652–1660.
https://doi.org/10.1053/j.gastro.2006.02.010 (2006).
17. Wu, T. et al. Development of diagnostic criteria and a prognostic score for hepatitis B virus-related acute-on-chronic liver failure.
Gut 67, 2181–2191 (2018).
18. R Development Core Team. R: A Language and Environment for Statistical Computing. (R Foundation for Statistical Computing,
2020).
19. Ferenci, P. et al. Hepatic encephalopathy—definition, nomenclature, diagnosis, and quantification: Final report of the working
party at the 11th World Congresses of Gastroenterology, Vienna, 1998. Hepatology (Baltimore, MD) 35, 716–721 (2002).
20. Tang, X. et al. Tri‐typing of Hepatitis B‐related acute‐on‐chronic liver failure defined by the World Gastroenterology Organization.
J. Gastroenterol. Hepatol. (2020).
21. Sarin, S. K. et al. Acute-on-chronic liver failure: consensus recommendations of the Asian Pacific association for the study of the
liver (APASL): An update. Hep. Int. 13, 353–390 (2019).
22. Wu, D. et al. HINT: A novel prognostic model for patients with hepatitis B virus-related acute-on-chronic liver failure. Aliment.
Pharmacol. Ther. 48, 750–760 (2018).
23. Kribben, A. et al. Effects of fractionated plasma separation and adsorption on survival in patients with acute-on-chronic liver
failure. Gastroenterology 142, 782–789 (2012).
24. Alshamsi, F. et al. Extracorporeal liver support in patients with liver failure: A systematic review and meta-analysis of randomized
trials. Intensive Care Med. 46, 1–16 (2019).
25. Yoon, E. L. et al. Long-term prognosis of acute-on-chronic liver failure survivors. J. Clin. Gastroenterol. 53, 134–141. https://doi.
org/10.1097/mcg.0000000000000987 (2019).
26. Hernaez, R. et al. Considerations for prognosis, goals of care, and specialty palliative care for hospitalized patients with acute-on-
chronic liver failure. Hepatology (Baltimore, MD) 72, 1109–1116 (2020).
Scientific Reports | (2021) 11:1810 | https://doi.org/10.1038/s41598-021-81431-0 12
Vol:.(1234567890)www.nature.com/scientificreports/
27. Kumar, R., Krishnamoorthy, T. L., Tan, H. K., Lui, H. F. & Chow, W. C. Change in model for end-stage liver disease score at two
weeks, as an indicator of mortality or liver transplantation at 60 days in acute-on-chronic liver failure. Gastroenterol. Rep. 3,
122–127. https://doi.org/10.1093/gastro/gou075 (2015).
Acknowledgements
The authors wish to thank all members of the China Network for Severe Liver Diseases for their continued sup-
port with data collection.
Author contributions
Z.Y. and Y.Z. collected data, performed statistical analysis, and drafted the final manuscript. Y.C. collected data,
performed statistical analysis, and helped to draft the final manuscript. M.X., S.Y., Y.C., B.Z., M.K., and F.S. helped
to collect data and draft the final manuscript. T.H., Z.D., and S.X. conceived the idea of the study, collected data,
and revise the final manuscript. All authors approved the final version of the manuscript.
Funding
This research was supported primarily by research grants from the National 13th 5-Year Plan for Hepatitis
Research (No.2017ZX10203201-007), the National Natural Science Foundation of China (No.81870429), the
Natural Science Foundation of Tianjin (No.19JCZDJC36700), and Tianjin Public Health Bureau Key Research
Program (No. 2015KZ013).
Competing interests
The authors declare no competing interests.
Additional information
Supplementary Information The online version contains supplementary material available at https://doi.
org/10.1038/s41598-021-81431-0.
Correspondence and requests for materials should be addressed to S.X., Z.D. or T.H.
Reprints and permissions information is available at www.nature.com/reprints.
Publisher’s note Springer Nature remains neutral with regard to jurisdictional claims in published maps and
institutional affiliations.
Open Access This article is licensed under a Creative Commons Attribution 4.0 International
License, which permits use, sharing, adaptation, distribution and reproduction in any medium or
format, as long as you give appropriate credit to the original author(s) and the source, provide a link to the
Creative Commons licence, and indicate if changes were made. The images or other third party material in this
article are included in the article’s Creative Commons licence, unless indicated otherwise in a credit line to the
material. If material is not included in the article’s Creative Commons licence and your intended use is not
permitted by statutory regulation or exceeds the permitted use, you will need to obtain permission directly from
the copyright holder. To view a copy of this licence, visit http://creativecommons.org/licenses/by/4.0/.
© The Author(s) 2021
Scientific Reports | (2021) 11:1810 | https://doi.org/10.1038/s41598-021-81431-0 13
Vol.:(0123456789)You can also read