Impact of Non-steroidal Anti-inflammatory Drug Administration for 12 Months on Renal Function
←
→
Page content transcription
If your browser does not render page correctly, please read the page content below
ORIGINAL RESEARCH
                                                                                                                                                  published: 26 May 2021
                                                                                                                                         doi: 10.3389/fpain.2021.644391

                                             Impact of Non-steroidal
                                             Anti-inflammatory Drug
                                             Administration for 12 Months on
                                             Renal Function
                                             Kazuhiro Hayashi 1 , Kenji Miki 2,3*, Hiroshi Kajiyama 4 , Tatsunori Ikemoto 5 and
                                             Masao Yukioka 3
                                             1
                                              Multidisciplinary Pain Center, Aichi Medical University, Nagakute, Japan, 2 Center for Pain Management, Hayaishi Hospital,
                                             Osaka, Japan, 3 Faculty of Health Science, Osaka Yukioka College of Health Science, Osaka, Japan, 4 Department of
                                             Rheumatology and Applied Immunology, Saitama Medical University, Saitama, Japan, 5 Department of Orthopedic Surgery,
                                             Aichi Medical University, Nagakute, Japan

                                             Background: The use of non-steroidal anti-inflammatory drugs (NSAIDs) is associated
                                             with an increased risk of renal complications. Resolution of renal adverse effects
                                             after NSAID administration has been observed after short-term use. Thus, the
                            Edited by:
                        Kok-Yuen Ho,         present study aimed to investigate a series of patients with chronic musculoskeletal
            The Pain Clinic, Singapore       pain who underwent long-term NSAID administration followed by switching to
                        Reviewed by:         tramadol hydrochloride/acetaminophen (TA) combination tablets to study the impact of
                    Armen N. Akopian,
The University of Texas Health Science
                                             NSAID-induced renal adverse effects.
 Center at San Antonio, United States        Methods: This was a longitudinal retrospective study of 99 patients with chronic
                        Wenqiang Cui,
               Shandong First Medical        musculoskeletal pain. The patients were administrated with NSAIDs daily during the
                      University, China      first 12 months, followed by daily TA combination tablets for 12 months. Estimated
                  *Correspondence:           glomerular filtration rate (eGFR) and serum levels of aspartate aminotransferase and
                             Kenji Miki
                 kenji-miki@umin.ac.jp
                                             alanine transaminase were measured at baseline, after NSAID administration and after
                                             TA administration.
                   Specialty section:
                                             Results: eGFR was significantly reduced after 12-month NSAID administration (median,
         This article was submitted to
                 Musculoskeletal Pain,       from 84.0 to 72.8 ml/min/1.73 m2 ), and the reduction was not shown after the
               a section of the journal      subsequent 12-month TA administration (median, 71.5 ml/min/1.73 m2 ). Reduction in
           Frontiers in Pain Research
                                             eGFR was less in patients who received celecoxib (median, −1.8 ml/min/1.73 m2 ) during
       Received: 23 December 2020
           Accepted: 13 April 2021
                                             the first 12 months. There was no significant difference in aspartate aminotransferase and
           Published: 26 May 2021            alanine transaminase in each period.
                              Citation:      Conclusions: Thus, patients receiving NSAIDs for 12 months displayed both reversible
         Hayashi K, Miki K, Kajiyama H,
      Ikemoto T and Yukioka M (2021)         and irreversible reduction of eGFR upon cessation of NSAIDs and switching to TA. Our
               Impact of Non-steroidal       data highlight the potential safety benefit of utilizing multimodal analgesic therapies to
Anti-inflammatory Drug Administration
                                             minimize the chronic administration of NSAIDs.
     for 12 Months on Renal Function.
            Front. Pain Res. 2:644391.       Keywords: anti-inflammatory agents, analgesics, drug-related side effects and adverse reactions, longitudinal
      doi: 10.3389/fpain.2021.644391         studies, kidney, musculoskeletal pain

Frontiers in Pain Research | www.frontiersin.org                                    1                                               May 2021 | Volume 2 | Article 644391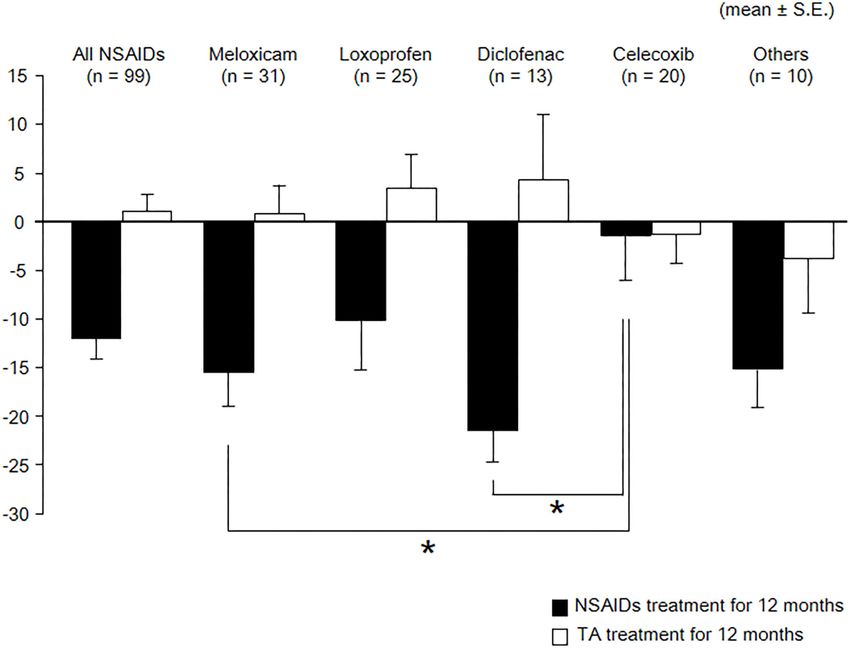
Hayashi et al.                                                                                                   Impact of NSAIDs Administration

INTRODUCTION                                                             during the first 12 months followed by receiving daily TA
                                                                         combination tablets for 12 months. Chronic musculoskeletal
The administration of non-steroidal anti-inflammatory drugs              pain was defined as persisting, continuous, or intermittent
(NSAIDs) to treat chronic musculoskeletal pain has become                pain for longer than 3 months (14). Exclusion criteria were
widely used in the clinic due to its ability to provide effective        cancer-related pain, presence of neurological signs, evidence
levels of pain relief (1–6). However, regular administration of          of bone fractures, recent surgery within the past 6 months,
NSAIDs has an increased risk of gastrointestinal, cardiovascular,        positive pregnancy test, American Society of Anesthesiologists’
and renal complications (1–6). There is a linear relationship            physical status ≥ 3, allergy or contraindication to the tested
between NSAID cumulative dose and change in renal function               substances, severe kidney [estimated glomerular filtration
over a 2-year period (7). Despite the high incidence of                  rate (eGFR) < 30] or liver function disorders (Child–Pugh
dose/duration-dependent renal adverse effects (estimated at 1–           classes A, B, and C), acute duodenal or ventricular ulcer, or
5%) (7, 8), there is a paucity of data regarding the long-               laboratory data outside of normal ranges. Finally, 99 patients
term safety of NSAID therapy, and the risk of renal damage               receiving daily NSAIDs during the first 12 months followed
has prompted an increasing appreciation in the value of                  by receiving daily TA combination tablets for 12 months were
multimodal analgesia in the management of moderate-to-severe             analyzed in this study (Figure 1). The patients were included
pain. For example, tramadol hydrochloride/acetaminophen (TA)             regardless of administration dose. Concomitant medications
combination tablets have emerged as a particularly useful option         were not permitted.
for chronic pain management (5, 6).                                         The number of subjects was determined by a sample size
    Previous studies have demonstrated that the renal adverse            estimation using G∗ Power software (v 3.0.10; Franz Faul, Kiel
effects of NSAIDs are usually reversible (8–10), but such studies        University, Kiel, Germany). On the basis of the effect size of 0.3,
have several limitations. For example, Chou et al. showed the risk       the minimum number of subjects was estimated to be 90 for an
of kidney injury is higher in current NSAID users than in past           α-level of 0.05 and a power (1–β) of 0.80.
NSAID users vs. control (9), which suggests the renal risks from
NSAIDs could be reversible. However, they defined past NSAID             Treatment Characteristics
users as having a termination date of 31–180 days before the             NSAIDs used in the study included meloxicam, loxoprofen,
index date, regardless of the administration period. Moreover,           diclofenac, celecoxib, and others. During the latter 12 month
Shukla et al. reported that rises in kidney injury biomarkers            period, all study participants were administrated daily TA
resulting from regular NSAID therapy for spondyloarthritis are           combination tablets (Ultracet R ). Change of administration
seen as early as 1 week and continue to rise up to 6 weeks               dose was permitted. The initial dosage and administration
(10). Notably, the same study also showed reversibility in the           of TA was one tablet (tramadol hydrochloride 37.5 mg and
rise of kidney injury biomarkers at 12 weeks upon stopping               acetaminophen 325 mg) given orally four times per day (15).
the drug (10). Taken together, these studies show that regular           The dose could be increased or decreased depending on patients’
administration of NSAIDs results in chronic renal failure (8),           symptoms, but no more than two tablets per administration
but patients taking NSAIDs for 6 weeks or less may have a                were permitted (up to a maximum of eight tablets daily). No
chance of recovery (10). Based on the potentially intolerable            other supplementary analgesic medications were given during
adverse effects or suboptimal pain relief, substantial proportions       the study. Discontinuation of medication for the treatment of
of musculoskeletal pain patients are often switched to a different       internal comorbidities was not required.
treatment within 12 months of initiating NSAID treatment (11–
13). However, no study to date has evaluated the potential safety        Outcomes
benefit of this common practice: reversing renal adverse effects         Patient characteristics included age, sex, major diagnosis,
after cessation of long-term NSAID therapy.                              comorbidities, number of medications for comorbidities, and
    Thus, the present study aimed to investigate a series of             administration dose. Laboratory values were routinely collected
patients with chronic musculoskeletal pain who underwent                 at baseline, after 12-month NSAID administration and after
long-term NSAID administration followed by switching to TA               12-month TA administration. Comparisons of laboratory
combination tablets to study the impact of NSAID-induced renal           results during the 12 months with daily NSAIDs and during
adverse effects.                                                         the following 12 months with daily administration of TA
                                                                         combination tablets were made in the same patient.
MATERIALS AND METHODS                                                       The primary outcome measure was serum levels of eGFR.
                                                                         eGFR was calculated as follows (16): 194 × age-0.287 ×
Subjects                                                                 serum creatinine-1.094 (if female, ×0.739). The eGFR values
The Research Ethics Committee of Amagasaki Central Hospital              (ml/min/1.73 m2 ) in a given range were stratified into one of
approved this study (no. H23022501). Data were retrospectively           the following published chronic kidney disease (CKD) categories
collected from medical records of 602 consecutive outpatients            (17): grade 1, normal or high, ≥90; grade 2, mildly decreased,
with chronic musculoskeletal pain from July 2011 to February             60–89; grade 3a, mildly to moderately decreased, 45–59; grade
2012 at a primary care clinic. Inclusion criteria included age ≥         3b, moderately to severely decreased, 30–44; grade 4, severely
20 years old, the existence of chronic musculoskeletal pain over         decreased, 15–29; grade 5, kidney failure,
Hayashi et al.                                                                                                               Impact of NSAIDs Administration

 FIGURE 1 | Flowchart of participants through the study. Ninety-nine patients were analyzed in this study.

one grade in the CKD category were enrolled for NSAID and                              Statistical Analysis
TA administration.                                                                     Relative change in eGFR, AST, and ALT from baseline (xb)
   Secondary outcome measures were serum levels of aspartate                           and measurements was calculated using the equation (x–xb)/xb,
transaminase (AST) and alanine transaminase (ALT). Other                               where x is the measured value. The normality of distribution for
information regarding adverse events during treatment was also                         each measurement was evaluated using the Shapiro–Wilk test for
collected. Treatment outcome measures were assessed at baseline                        continuous variables. The outcome variables were not normally
and after treatment, in each treatment, by using a pain-Numeric                        distributed; thus, continuous data are expressed as medians and
Rating Scale (NRS) (18). The pain-NRS was used to measure pain                         interquartile ranges (IQRs). Categorical variables were analyzed
severity at each assessment, where 0 = no pain and 10 = worst                          using the chi-square test. Continuous variables were analyzed
pain imaginable (18).                                                                  using the Mann–Whitney U-test, the Kruskal–Wallis test, the

Frontiers in Pain Research | www.frontiersin.org                                   3                                     May 2021 | Volume 2 | Article 644391
Hayashi et al.                                                                                                                                  Impact of NSAIDs Administration

Friedman test, the Steel–Dwass test, and the Spearman’s rank                                 patient characteristics, pain conditions, comorbidities, number
correlation coefficient test.                                                                of medications for comorbidities, and pain-NRS were observed
   All data were statistically analyzed using the SPSS 25.0J                                 based on the particular NSAIDs used (Tables 1, 2). No other
program, and P < 0.05 were considered significant.                                           serious and minor complications occurred during the 2-year
                                                                                             research period.
RESULTS                                                                                         The median baseline for eGFR was 84.0 ml/min/1.73 m2 (IQR,
                                                                                             67.6–102.0), the median baseline for AST was 20.0 U/L (IQR,
Of the 99 patients, 70 (71%) were female (Table 1). The                                      17.0–24.0), and the median baseline for ALT was 16.0 U/L (IQR,
median age was 73 years (IQR, 47–81). Major diagnoses                                        11.0–22.0) (Table 3). eGFR level was significantly correlated with
(multiple allowed) of the patients included lumbago (n =                                     age at baseline (r = −0.606), after NSAID administration for
45), osteoarthritis (n = 28), and rheumatoid arthritis (n                                    12 months (r = −0.682) and after TA administration for 12
= 3). NSAIDs taken during the first 12 months included                                       months (r = −0.645).
meloxicam (n = 31), loxoprofen (n = 25), diclofenac (n                                          As shown in Table 3 and Figure 2, eGFR levels after
= 13), and celecoxib (n = 20). No significant difference in                                  NSAID administration for 12 months followed by TA for 12

TABLE 1 | Patient characteristics.

                                           Overall               Meloxicam                  Loxoprofen             Diclofenac                Celecoxib                  Other
                                          (n = 99)                (n = 31)                    (n = 25)              (n = 13)                  (n = 20)                 (n = 10)

Demographics
Age [year]                               73 [47–81]               68 [45–81]                80 [59–83]              73 [45–82]               71 [47–80]               77 [68–83]
Female, n (%)                             70 (71%)                 23 (74%)                  17 (68%)                8 (62%)                  16 (80%)                 6 (60%)
Major diagnoses (multiple allowed)
Lumbago, n (%)                            45 (45%)                 11 (35%)                  17 (68%)                5 (38%)                  8 (40%)                  4 (40%)
Osteoarthritis, n (%)                     28 (28%)                  7 (23%)                  4 (16%)                 4 (31%)                  9 (45%)                  4 (40%)
Rheumatoid arthritis, n (%)                 3 (3%)                  3 (10%)                   0 (0%)                  0 (0%)                   0 (0%)                   0 (0%)
Comorbidities
Diabetes, n (%)                             4 (4%)                  0 (0%)                    2 (8%)                  1 (8%)                   0 (0%)                  1 (10%)
Hypertension, n (%)                       22 (22%)                  4 (13%)                  9 (36%)                 4 (31%)                  3 (15%)                  2 (20%)
Chronic heart failure, n (%)                3 (3%)                  0 (0%)                    2 (8%)                  0 (0%)                   1 (5%)                   0 (0%)
Dyslipidemia, n (%)                         1 (1%)                  0 (0%)                    1 (4%)                  0 (0%)                   0 (0%)                   0 (0%)
Hypothyroidism, n (%)                       2 (2%)                  2 (6%)                    0 (0%)                  0 (0%)                   0 (0%)                   0 (0%)
Osteoporosis, n (%)                         5 (5%)                  2 (6%)                    1 (4%)                  0 (0%)                  2 (10%)                   0 (0%)
Migraine, n (%)                             1 (1%)                  0 (0%)                    0 (0%)                  0 (0%)                   0 (0%)                  1 (10%)
Depression, n (%)                           2 (2%)                  0 (0%)                    1 (4%)                  0 (0%)                   0 (0%)                  1 (10%)
Number of medications for comorbidities, n (%)
0                                         61 (62%)                 21 (68%)                  11 (44%)                9 (69%)                  14 (70%)                 6 (60%)
1                                         24 (24%)                  9 (29%)                  9 (36%)                  1 (8%)                  4 (20%)                  1 (10%)
2                                           9 (9%)                  1 (3%)                   4 (16%)                  1 (8%)                  2 (10%)                  1 (10%)
3                                           3 (3%)                  0 (0%)                    1 (4%)                  1 (8%)                   0 (0%)                  1 (10%)
4                                           2 (2%)                  0 (0%)                    0 (0%)                  1 (8%)                   0 (0%)                  1 (10%)
Administration dose per day
NSAIDs [mg]                              75 [10–180]              10 [10–10]              180 [75–180]            62.5 [75–110]                 200                 62.5 [12–450]
                                                                                                                                             [200–200]
TA [tablets]                               2 [1–4]                  3 [2–4]                   2 [1–3]                 2 [2–4]                  2 [1–4]                  2 [1–3]
Pain-NRS [points]
Baseline                                   6 [5–7]                  7 [5–7]                   5 [5–7]                 6 [5–7]                  5 [4–6]                  6 [4–6]
After NSAIDs for 12 months                 5 [4–6]                  5 [4–7]                   4 [4–6]                 5 [3–7]                  4 [3–5]                  6 [4–6]
After TA for 12 months                     4 [3–5]                  5 [3–7]                   4 [3–5]                 4 [3–5]                  3 [2–5]                  4 [2–6]

NRS, Numeric Rating Scale; NSAIDs, non-steroidal anti-inflammatory drugs; TA, tramadol hydrochloride/acetaminophen.
Data of sex, major diagnoses, and comorbidities are number and (%) of patients. Data of age, administration dose, and pain-NRS are medians and interquartile ranges [IQR].

Frontiers in Pain Research | www.frontiersin.org                                        4                                                  May 2021 | Volume 2 | Article 644391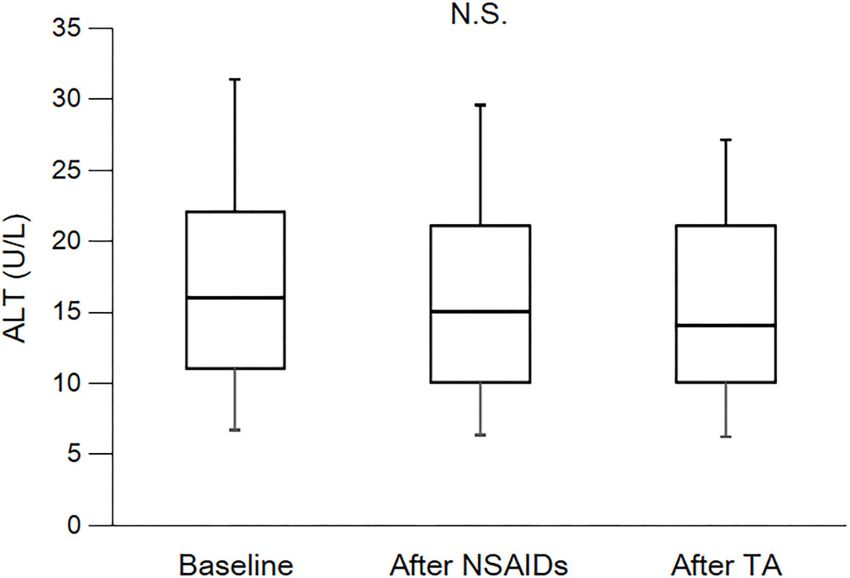
Hayashi et al. Impact of NSAIDs Administration
months were significantly reduced compared with baseline. ml/min/1.73 m2 ), whereas the reduction was not shown during
eGFR was significantly reduced during the first 12 months the following 12 months with TA administration (median,
with NSAID administration (median, from 84.0 to 72.8 71.5 ml/min/1.73 m2 ). Some patients showed an increase
of eGFR after cessation of NSAIDs and switching to TA.
There was no significant difference in eGFR between after
TABLE 2 | Course of pain-NRS. the 12-month NSAIDs period and after the 12-month TA
period. With respect to the four specific NSAIDs, reduction
Lumbago Osteoarthritis Rheumatoid
of eGFR was significantly less in patients taking celecoxib
arthritis
(median, −1.8 ml/min/1.73 m2 ) than those on meloxicam
Baseline 5 [5–6] 5 [6–7] 7 [7–7] or diclofenac (Figure 3). As shown in Table 3 and Figures 4,
After NSAIDs for 12 months 4 [4–6] 3 [4–6] 5 [5–5] 5, there was no significant difference in AST or ALT in
After TA for 12 months 3 [4–5] 2 [3–4] 3 [4–5] each period.
Table 4 shows the number of patients for each grade of the
NRS, Numeric Rating Scale; NSAIDs, non-steroidal anti-inflammatory drugs; TA, CKD category. Of the 99 patients, 37 patients (37%) experienced
tramadol hydrochloride/acetaminophen.
Data of pain-NRS are medians and interquartile ranges [IQR].
an increase in severity of at least one grade in the CKD
TABLE 3 | Course of laboratory levels.
Overall Meloxicam Loxoprofen Diclofenac Celecoxib Other
(n = 99) (n = 31) (n = 25) (n = 13) (n = 20) (n = 10)
eGFR [ml/min/1.73 m2 ]
Baseline 84.0 86.0 84.0 92.1 83.1 74.6
[67.6–102.0] [75.7–104.0] [65.1–93.8] [65.0–116.5] [57.1–98.1] [64.3–88.3]
After NSAIDs for 12 72.8 73.8 72.1 72.6 76.2 66.7
months [57.5–89.6]* [60.9–89.6]* [49.3–92.2] [48.2–85.7] [61.4–90.5] [50.8–75.5]
After TA for 12 months 71.5 72.9 71.7 71.3 75.3 57.5
[57.7–88.7]* [64.1–92.7]* [53.7–90.4] [56.2–97.5] [58.0–84.5] [43.8–77.3]
Changes during −13.8 −18.8 [−28.7 −2.7 −21.5 [−31.2 −1.8 −14.8 [−27.6
† †
NSAIDs use [−25.0–0.0] to −5.9] [−19.3–0.0] to −12.5] [−14.1–0.0] to −5.8]
Changes during TA use 0.4 4.0 1.9 1.5 −2.8 −8.5
[−7.5–11.8] [−7.5–14.0] [−6.6–13.5] [−1.1–15.0] [−9.9–11.0] [18.6–8.7]
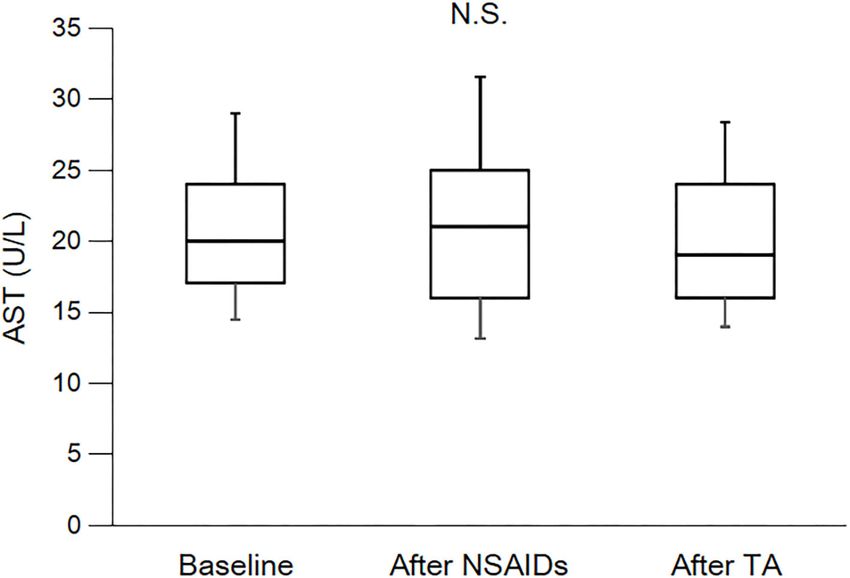
AST [U/L]
Baseline 20.0 20.0 22.0 21.0 19.0 22.5
[17.0–24.0] [17.0–22.0] [18.5–26.5] [15.5–30.0] [16.0–28.8] [15.0–25.3]
After NSAIDs for 12 21.0 21.0 22.0 18.0 23.0 20.0
months [16.0–25.0] [16.0–24.0] [16.5–26.0] [15.5–21.0] [15.0–31.0] [16.5–22.5]
After TA for 12 months 19.0 19.0 22.0 18.0 19.5 17.0
[16.0–24.0] [16.0–22.0] [19.0–27.0] [15.0–21.5] [17.0–28.0] [15.8–21.8]
Changes during 0.0 5.0 −4.3 −4.5 1.6 0.0
NSAIDs use [−12.5–17.6] [−6.3–17.6] [−15.0–16.3] [−22.8–6.7] [−16.9–18.5] [−18.2–19.1]
Changes during TA use −5.6 −6.7 0.0 −5.3 −10.2 −16.7
[−17.1–5.9] [−20.0–4.8] [−7.7–14.4] [−14.8–0.0] [−16.6–6.5] [−20.0–3.3]
ALT [U/L]
Baseline 16.0 15.0 17.0 15.0 17.5 16.5
[11.0–22.0] [11.0–20.0] [11.0–27.5] [10.5–29.5] [10.3–23.5] [10.0–25.0]
After NSAIDs for 12 15.0 14.0 16.0 12.0 15.0 15.0
months [10.0–21.0] [10.0–19.0] [9.0–28.5] [9.0–24.5] [11.0–25.0] [10.5–20.3]
After TA for 12 months 14.0 12.0 17.0 12.0 14.5 13.5
[10.0–21.0] [9.0–16.0] [12.0–23.0] [8.0–19.5] [11.0–25.8] [10.0–21.0]
Changes during 0.0 8.3 −10.0 −10.0 6.5 −9.2
NSAIDs use [−25.0–23.5] [−20.0–23.5] [−38.7–17.7] [−33.9−1.8] [−29.6–37.2] [−25.3–19.8]
Changes during TA use −9.1 −11.1 0.0 −12.5 −8.1 −10.1
[−27.6–8.3] [−40.0–7.7] [−26.1–20.8] [−28.1–17.8] [−27.3–8.4] [−34.2–5.0]
eGFR, estimated glomerular filtration rate; AST, aspartate transaminase; ALT, alanine transaminase; NSAIDs, non-steroidal anti-inflammatory drugs; TA,
tramadol hydrochloride/acetaminophen.
Data are medians and interquartile ranges [IQR]. These data were analyzed using Kruskal–Wallis test and Steel–Dwass test. Significance level was set atHayashi et al. Impact of NSAIDs Administration FIGURE 2 | Course of eGFR. eGFR, estimated glomerular filtration rate; NSAIDs, non-steroidal anti-inflammatory drugs; TA, tramadol hydrochloride/acetaminophen. Each box plot represents the 75 percentile, median, and 25 percentile. Error bar shows standard deviation. eGFR after NSAIDs for 12 months and after TA for 12 months were significantly decreased than baseline. There was no significant difference between after NSAIDs for 12 months and after TA for 12 months. These data were analyzed using Friedman test and Steel–Dwass test. Significance level was set at
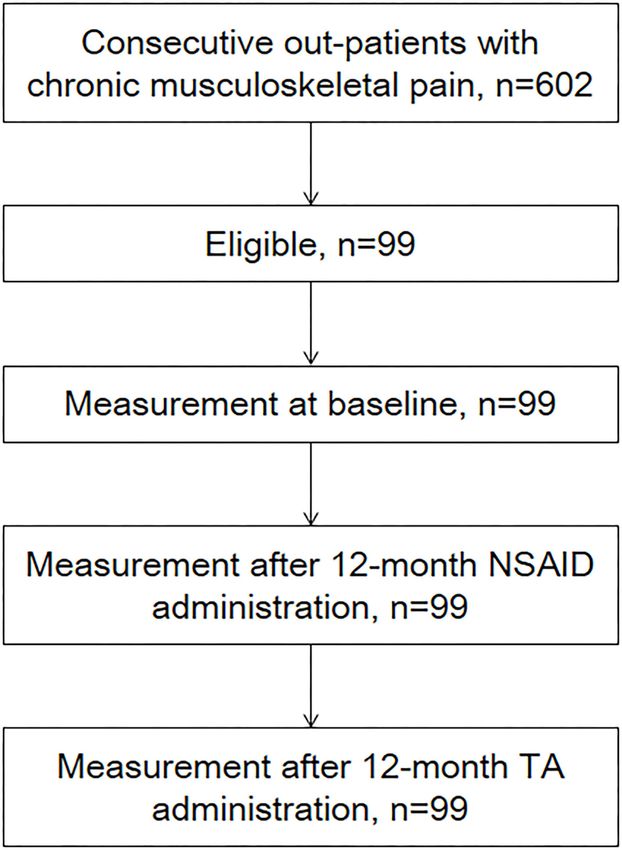
Hayashi et al.                                                                                                                      Impact of NSAIDs Administration

 FIGURE 3 | Course of eGFR among specific NSAIDs. eGFR, estimated glomerular filtration rate; TA, tramadol hydrochloride/acetaminophen. Values are means of
 change of eGFR, and the error bar shows standard error. Reduction of eGFR was significantly lesser in patients with celecoxib than those with meloxicam and
 diclofenac. These data were analyzed using Kruskal–Wallis test and Steel–Dwass test. Significance level was set at
Hayashi et al.                                                                                                                        Impact of NSAIDs Administration

 FIGURE 4 | Course of AST. AST, aspartate transaminase; NSAIDs, non-steroidal anti-inflammatory drugs; TA, tramadol hydrochloride/acetaminophen. Each box plot
 represents the 75 percentile, median, and 25 percentile. Error bar shows standard deviation. There was no significant difference in each period. These data were
 analyzed using Friedman test and Steel–Dwass test. Significance level was set at
Hayashi et al.                                                                                                                                 Impact of NSAIDs Administration

TABLE 4 | Number of patients each grade of CKD category.

                                       Overall                Meloxicam                Loxoprofen                Diclofenac                Celecoxib                   Other
                                      (n = 99)                 (n = 31)                 (n = 25)                  (n = 13)                  (n = 20)                  (n = 10)

Baseline, n (%)
1                                     38 (38%)                 13 (42%)                     8 (32%)                8 (62%)                  7 (35%)                   2 (20%)
2                                     43 (43%)                 16 (52%)                  12 (48%)                  2 (15%)                  7 (35%)                   6 (60%)
3a                                    13 (13%)                   1 (3%)                     3 (12%)                3 (23%)                  5 (25%)                   1 (10%)
3b                                     5 (5%)                    1 (3%)                     2 (8%)                  0 (0%)                   1 (5%)                   1 (10%)
4                                      0 (0%)                    0 (0%)                     0 (0%)                  0 (0%)                   0 (0%)                    0 (0%)
5                                      0 (0%)                    0 (0%)                     0 (0%)                  0 (0%)                   0 (0%)                    0 (0%)
After NSAIDs for 12 months, n (%)
1                                     23 (23%)                  7 (23%)                     8 (32%)                2 (15%)                  5 (25%)                   1 (10%)
2                                     46 (46%)                 17 (55%)                     7 (28%)                6 (46%)                  11 (55%)                  5 (50%)
3a                                    19 (19%)                  5 (16%)                     5 (20%)                3 (23%)                  3 (15%)                   3 (30%)
3b                                     9 (9%)                    2 (6%)                     4 (16%)                2 (15%)                   1 (5%)                    0 (0%)
4                                      2 (2%)                    0 (0%)                     1 (4%)                  0 (0%)                   0 (0%)                   1 (10%)
5                                      0 (0%)                    0 (0%)                     0 (0%)                  0 (0%)                   0 (0%)                    0 (0%)
After TA for 12 months, n (%)
1                                     22 (22%)                  8 (26%)                     6 (24%)                3 (23%)                  4 (20%)                   1 (10%)
2                                     49 (49%)                 18 (58%)                  12 (48%)                  5 (38%)                  11 (55%)                  3 (30%)
3a                                    16 (16%)                  3 (10%)                     2 (8%)                 4 (31%)                  4 (20%)                   3 (30%)
3b                                     9 (9%)                    1 (3%)                     4 (16%)                 0 (0%)                   1 (5%)                   3 (30%)
4                                      3 (3%)                    1 (3%)                     1 (4%)                  1 (3%)                   0 (0%)                    0 (0%)
5                                      0 (0%)                    0 (0%)                     0 (0%)                  0 (0%)                   0 (0%)                    0 (0%)
Fell into at least worse one grade of CKD category, n (%)
                                                                                                                             †
during NSAIDs use (12                 37 (37%)                 13 (42%)                     7 (28%)               10 (77%)                  3 (15%)*                  4 (40%)
months)
during NSAIDs and TA                  35 (35%)                 11 (35%)                     7 (28%)                8 (62%)                  4 (20%)                   5 (50%)
use (24 months)

NSAIDs, non-steroidal anti-inflammatory drugs; TA, tramadol hydrochloride/acetaminophen; CKD, chronic kidney disease.
Data are number and (%) of patients. Of 99 patients, 37 patients (37%) experienced an increase in severity of at least one grade in CKD category during first 12 months with NSAID
administration. On the other hand, during 24 months with NSAIDs and TA administration, 35 patients (35%) increased severity by at least one grade of CKD category. These data were
                                                                                                             †
analyzed using chi-square test. Significance level was set at < 5%. * Significantly fewer number of patients. Significantly more number of patients.

not lead to an elevation of liver enzyme levels (36). Similarly,                             of eGFR could be overestimated. Finally, we included only a
in our study, we did not observe any significant elevations in                               small number of participants with different pain conditions
liver enzymes.                                                                               at a single medical center. Further studies that investigate
    There are several limitations in the present study. First,                               larger patient cohorts and additional treatment regimens are
the present study is a retrospective study limited only to                                   required to clarify the effects of long-term use of NSAIDs on
patients receiving daily NSAIDs during the first 12 months                                   serum levels.
followed by 12 months of administration of TA combination
tablets daily. There is no group receiving only daily NSAIDs
or TA combination tablets during the 24-month periods. The                                   CONCLUSIONS
renal function might already have reached a stable but lower
plateau in the present study. In addition, many patients had                                 The present study suggests that patients who have undergone
concomitant medications. Thus, our observations must be                                      long-term NSAID therapy for 12 months can experience
interpreted with caution. Second, the administration protocol                                reversible or irreversible renal damage after the cessation of
was variable, and the overall impact of administration dose                                  NSAIDs and switching to TA, as determined by measuring eGFR.
on serum levels was not determined. Third, patients were                                     Given this risk identified in our current series of patients, our data
mostly of advanced age in the present study. The reduction                                   highlight the potential safety of utilizing multimodal analgesic

Frontiers in Pain Research | www.frontiersin.org                                        9                                                 May 2021 | Volume 2 | Article 644391
Hayashi et al. Impact of NSAIDs Administration
TABLE 5 | Comparison between patients with fell into at least worse one grade of CKD category or not.
During NSAIDs use During NSAIDs and TA use
(12 months) (24 months)
Fell category Not fell category Fell category Not fell category
(n = 37) (n = 62) (n = 35) (n = 64)
Demographics
Age [year] 76 [61–84] 72 [47–80] 73 [60–83] 73 [46–80]
Female, n (%) 11 (30%) 18 (29%) 12 (34%) 17 (27%)
Major diagnoses (multiple allowed)
Lumbago, n (%) 21 (57%) 24 (39%) 18 (51%) 27 (42%)
Osteoarthritis, n (%) 7 (19%) 21 (34%) 9 (26%) 19 (30%)
Rheumatoid arthritis, n (%) 1 (3%) 2 (3%) 1 (3%) 2 (3%)
Comorbidities
Diabetes, n (%) 3 (8%) 1 (2%) 2 (6%) 2 (3%)
Hypertension, n (%) 11 (30%) 11 (18%) 8 (23%) 14 (22%)
Chronic heart failure, n (%) 2 (5%) 1 (2%) 2 (6%) 1 (2%)
Dyslipidemia, n (%) 1 (3%) 0 (0%) 0 (0%) 1 (2%)
Hypothyroidism, n (%) 0 (0%) 2 (3%) 0 (0%) 2 (3%)
Osteoporosis, n (%) 1 (3%) 4 (6%) 1 (3%) 4 (6%)
Migraine, n (%) 0 (0%) 1 (2%) 0 (0%) 1 (2%)
Depression, n (%) 1 (3%) 1 (2%) 1 (3%) 1 (2%)
Number of medications for comorbidities
0, n (%) 21 (57%) 40 (65%) 23 (66%) 38 (59%)
1, n (%) 9 (24%) 15 (24%) 6 (17%) 18 (28%)
2, n (%) 4 (11%) 5 (8%) 4 (11%) 5 (8%)
3, n (%) 1 (3%) 2 (3%) 1 (3%) 2 (3%)
4, n (%) 2 (5%) 0 (0%) 1 (3%) 1 (2%)
Type of NSAIDs
Meloxicam, n (%) 13 (35%) 18 (29%) 11 (31%) 20 (31%)
Loxoprofen, n (%) 7 (19%) 18 (29%) 7 (20%) 18 (28%)
†
Diclofenac, n (%) 10 (27%) 3 (5%)* 8 (23%) 5 (8%)
†
Celecoxib, n (%) 3 (8%)* 17 (27%) 4 (11%) 16 (25%)
Other, n (%) 4 (11%) 6 (10%) 5 (14%) 5 (8%)
Administration dose per day
NSAIDs [mg] 75 [10–150] 160 [10–200] 75 [10–180] 100 [10–180]
TA [tablets] 2 [1–4] 2 [1–3] 2 [1–4] 2 [1–4]
NSAIDs, non-steroidal anti-inflammatory drugs; TA, tramadol hydrochloride/acetaminophen; CKD, chronic kidney disease.
Data of sex, major diagnoses, and comorbidities are number and (%) of patients. Data of age and administration doses are medians and interquartile ranges [IQR]. Of 99 patients, 37
patients (37%) experienced an increase in severity of at least one grade in CKD category during first 12 months with NSAID administration. On the other hand, during 24 months with
NSAIDs and TA administration, 35 patients (35%) increased severity by at least one grade of CKD category. These data were analyzed using chi-square test or Mann–Whitney U-test.
Significance level was set atHayashi et al. Impact of NSAIDs Administration
REFERENCES 17. Stevens PE, Levin A, Kidney Disease: Improving Global Outcomes Chronic
Kidney Disease Guideline Development Work Group Members. Evaluation
1. da Costa BR, Reichenbach S, Keller N, Nartey L, Wandel S, Jüni P, and management of chronic kidney disease: synopsis of the kidney
et al. Effectiveness of non-steroidal anti-inflammatory drugs for the disease: improving global outcomes 2012 clinical practice guideline. Ann
treatment of pain in knee and hip osteoarthritis: a network meta- Intern Med. (2013) 158:825–30. doi: 10.7326/0003-4819-158-11-201306040-
analysis. Lancet. (2017) 390:e21–33. doi: 10.1016/S0140-6736(17) 00007
31744-0 18. Farrar JT, Young JP Jr, LaMoreaux L, Werth JL, Poole MR. Clinical importance
2. McAlindon TE, Bannuru RR, Sullivan MC, Arden NK, Berenbaum of changes in chronic pain intensity measured on an 11-point numerical
F, Bierma-Zeinstra SM, et al. OARSI guidelines for the non-surgical pain rating scale. Pain. (2001) 94:149–58. doi: 10.1016/S0304-3959(01)0
management of knee osteoarthritis. Osteoarthritis Cartilage. (2014) 22:363– 0349-9
88. doi: 10.1016/j.joca.2014.01.003 19. Nderitu P, Doos L, Jones PW, Davies SJ, Kadam UT. Non-steroidal anti-
3. Wong JJ, Côté P, Sutton DA, Randhawa K, Yu H, Varatharajan S, et al. inflammatory drugs and chronic kidney disease progression: a systematic
Clinical practice guidelines for the noninvasive management of low back pain: review. Fam Prac. (2013) 30:247–55. doi: 10.1093/fampra/cms086
a systematic review by the Ontario Protocol for Traffic Injury Management 20. Kleinknecht D. Interstitial nephritis, the nephritic syndrome and chronic
(OPTIMa) Collaboration. Eur J Pain. (2017) 21:201–16. doi: 10.1002/ejp.931 renal failure secondary to non-steroidal anti-inflammatory drugs. Semin
4. Koes BW, van Tulder M, Lin CW, Macedo LG, McAuley J, Maher C. Nephrol. (1995) 15:228–35.
An updated overview of clinical guidelines for the management of non- 21. Malfait AM, Schnitzer TJ. Towards a mechanism-based approach to
specific low back pain in primary care. Eur Spine J. (2010) 19:2075– pain management in osteoarthritis. Nat Rev Rheumatol. (2013) 9:654–
94. doi: 10.1007/s00586-010-1502-y 64. doi: 10.1038/nrrheum.2013.138
5. Schnitzer TJ. Update on guidelines for the treatment of 22. Vardeh D, Wang D, Costigan M, Lazarus M, Saper CB, Woolf CJ,
chronic musculoskeletal pain. Clin Rheumatol. (2006) 25:S22– et al. COX2 in CNS neural cells mediates mechanical inflammatory pain
9. doi: 10.1007/s10067-006-0203-8 hypersensitivity in mice. J Clin Invest. (2009) 119:287–94. doi: 10.1172/JCI
6. Qaseem A, Wilt TJ, McLean RM, Forciea MA, Clinical Guidelines Committee 37098
of the American College of Physicians. Non-invasive treatments for acute, 23. Ding C. Do NSAIDs affect the progression of osteoarthritis?
subacute, and chronic low back pain: a clinical practice guideline from Inflammation. (2002) 26:139–42. doi: 10.1023/A:10155046
the American college of physicians. Ann Intern Med. (2017) 166:514– 32021
30. doi: 10.7326/M16-2367 24. Usui J, Yamagata K, Imai E, Okuyama H, Kajiyama H, Kanamori
7. Gooch K, Culleton BF, Manns BJ, Zhang J, Alfonso H, Tonelli H, et al. Clinical practice guideline for drug-induced kidney
M, et al. NSAID use and progression of chronic kidney injury in Japan 2016: digest version. Clin Exp Nephrol. (2016)
disease. Am J Med. (2007) 120:e1–7. doi: 10.1016/j.amjmed.2006. 20:827–31. doi: 10.1007/s10157-016-1334-0
02.015 25. Lapi F, Azoulay L, Yin H, Nessim SJ, Suissa S. Concurrent use of diuretics,
8. Harirforoosh S, Asghar W, Jamali F. Adverse effects of nonsteroidal angiotensin converting enzyme inhibitors, and angiotensin receptor blockers
antiinflammatory drugs: an update of gastrointestinal, cardiovascular with non-steroidal anti-inflammatory drugs and risk of acute kidney
and renal complications. J Pharm Anti-Inflammat Sci. (2013) 16:821– injury: nested case-control study. BMJ. (2013) 346:e8525. doi: 10.1136/bmj.
47. doi: 10.18433/J3VW2F e8525
9. Chou CI, Shih CJ, Chen YT, Ou SM, Yang CY, Kuo SC, et al. Adverse 26. Dreischulte T, Morales DR, Bell S, Guthrie B. Combined use of
effects of oral nonselective and cyclooxygenase-2-selective NSAIDs nonsteroidal anti-inflammatory drugs with diuretics and/or renin-
on hospitalization for acute kidney injury: a nested case-control angiotensin system inhibitors in the community increases the risk of
cohort study. Medicine. (2016) 95:e2645. doi: 10.1097/MD.00000000000 acute kidney injury. Kidney Int. (2015) 88:396–403. doi: 10.1038/ki.
02645 2015.101
10. Shukla A, Rai MK, Prasad N, Agarwal V. Short-term non-steroid 27. Food US, Drug Administration. Medication Guide for Non-Steroidal Anti-
anti-inflammatory drug use in spondyloarthritis patients induces Inflammatory Drugs (NSAIDs). (2021). Available online at: https://www.fda.
subclinical acute kidney injury: biomarkers study. Nephron. (2017) gov/media/73092/download (accessed, March 27, 2021).
135:277–86. doi: 10.1159/000455167 28. Nissen SE, Yeomans ND, Solomon DH, Lüscher TF, Libby P, Husni
11. Gore M, Sadosky A, Leslie D, Tai KS, Seleznick M. Patterns ME, et al. Cardiovascular safety of celecoxib, naproxen, or ibuprofen
of therapy switching, augmentation, and discontinuation after for arthritis. N Engl J Med. (2016) 375:2519–29. doi: 10.1056/NEJMoa1
initiation of treatment with select medications in patients with 611593
osteoarthritis. Clin Ther. (2011) 33:1914–31. doi: 10.1016/j.clinthera.2011. 29. Zhang J, Ding EL, Song Y. Adverse effects of cyclooxygenase 2 inhibitors
10.019 on renal and arrhythmia events: meta-analysis of randomized trials. JAMA.
12. Gore M, Sadosky AB, Leslie DL, Tai KS, Emery P. Therapy switching, (2006) 296:1619–32. doi: 10.1001/jama.296.13.jrv60015
augmentation, and discontinuation in patients with osteoarthritis and chronic 30. Winkelmayer WC, Waikar SS, Mogun H, Solomon DH. Nonselective and
low back pain. Pain Pract. (2012) 12:457–68. doi: 10.1111/j.1533-2500.2011. cyclooxygenase-2-selective NSAIDs and acute kidney injury. Am J Med.
00524.x (2008) 121:1092–8. doi: 10.1016/j.amjmed.2008.06.035
13. Scholes D, Stergachis A, Penna PM, Normand EH, Hansten PD. Nonsteroidal 31. Raffa RB, Friderichs E, Reimann W, Shank RP, Codd EE, Vahght JL. Opioid
antiinflammatory drug discontinuation in patients with osteoarthritis. J and non-opioid components independently contribute to the mechanism of
Rheumatol. (1995) 22:708–12. action of tramadol, an ‘atypical’ opioid analgesic. J Pharmacol Exp Ther.
14. International Association for the Study of Pain (IASP) Subcommittee on (1992) 260:275–85.
Taxonomy. Classification of chronic pain. Descriptions of chronic pain 32. Józwiak-Bebenista M, Nowak JZ. Paracetamol: mechanism of action,
syndromes and definitions of pain terms. Pain. (1986) 3:S1−226. applications and safety concern. Acta Pol Pharm. (2014) 71:11–23.
15. Yoshizawa K, Kawai K, Fujie M, Suzuki J, Ogawa Y, Yajima T, et al. Overall 33. Inoue Y, Nishimura A, Taguma K, et al. A long-term (52-week) study of
safety profile and effectiveness of tramadol hydrochloride/acetaminophen tramadol hydrochloride/acetaminophen combination tablet for chronic pain.
in patients with chronic noncancer pain in Japanese real-world practice. J Bone Joint Surg. (2012) 31:88–97.
Curr Med Res Opin. (2015) 31:2119–29. doi: 10.1185/03007995.2015.1 34. Mejjad O, Serrie A, Ganry H. Epidemiological data, efficacy and safety of
091975 a paracetamol–tramadol fixed combination in the treatment of moderate-
16. Matsuo S, Imai E, Horio M, Yasuda Y, Tomita K, Nitta K, et al. Revised tosevere pain. SALZA: a post-marketing study in general practice.
equations for estimated GFR from serum creatinine in Japan. Am J Kidney Curr Med Res Opin. (2011) 27:1013–20. doi: 10.1185/03007995.2011.
Dis. (2009) 53:982–92. doi: 10.1053/j.ajkd.2008.12.034 565045
Frontiers in Pain Research | www.frontiersin.org 11 May 2021 | Volume 2 | Article 644391Hayashi et al. Impact of NSAIDs Administration
35. Moore RA, McQuay HJ. Prevalence of opioids adverse events in The remaining authors declare that the research was conducted in the absence of
chronic nonmalignant pain: systematic review of randomized trial any commercial or financial relationships that could be construed as a potential
of oral opioids. Arthritis Res Ther. (2005) 7:1046–51. doi: 10.1186/ conflict of interest.
ar1526
36. Watkins PB, Kaplowitz N, Slattery JT, Colonese CR, Colucci SV, Stewart Copyright © 2021 Hayashi, Miki, Kajiyama, Ikemoto and Yukioka. This is an open-
PW, et al. Aminotransferase elevations in healthy adults receiving 4 grams access article distributed under the terms of the Creative Commons Attribution
of acetaminophen daily: a randomized controlled trial. JAMA. (2006) 296:87– License (CC BY). The use, distribution or reproduction in other forums is permitted,
93. doi: 10.1001/jama.296.1.87 provided the original author(s) and the copyright owner(s) are credited and that the
original publication in this journal is cited, in accordance with accepted academic
Conflict of Interest: KM has received payment from Merck, Pfizer, Eli Lilly, practice. No use, distribution or reproduction is permitted which does not comply
Ayumi, Mundi Pharma, Janssen, Nippon Zoki, and Daiichi Sankyo. with these terms.
Frontiers in Pain Research | www.frontiersin.org 12 May 2021 | Volume 2 | Article 644391You can also read