Viscosity and Sensory Acceptability of Almond Milkshake as Influenced by Sugar, Almond Paste and Corn Flour-A Response Surface Study
←
→
Page content transcription
If your browser does not render page correctly, please read the page content below
Article
                                                                             Volume 10, Issue 3, 2021, 2483 - 2493
                                                                    https://doi.org/10.33263/LIANBS103.24832493

Viscosity and Sensory Acceptability of Almond Milkshake
as Influenced by Sugar, Almond Paste and Corn Flour-A
Response Surface Study
Deepak Mudgil 1,*      , Sheweta Barak 1
1   Department of Dairy and Food Technology, Mansinhbhai Institute of Dairy and Food Technology, Mehsana, Gujarat-
    384002, India
*   Correspondence: dsmudgil@yahoo.com;
                                                                                     Scopus Author ID 51864139900
                              Received: 29.11.2020; Revised: 6.01.2021; Accepted: 12.01.2021; Published: 19.01.2021

Abstract: The effect of variables such as sugar, almond paste, and cornflour on viscosity and a sensory
score of almond milkshake samples were studied by response surface methodology. The central
composite design was used to obtain optimum levels of variables. The values of viscosity and sensory
scores obtained from different experiment runs were 170-1085cps and 6.2-7.7. The second-order
polynomial model suggested by design expert software for viscosity and a sensory score of almond
milkshake showed R2 (coefficient of determination) of 0.9871 and 0.9590, respectively. Whereas model
F-values for viscosity and a sensory score of almond milkshake were 84.9 and 26.02, respectively.
Optimum levels of sugar, almond paste, and cornflour suggested by models were 8%, 1% & 2%,
respectively. Experimental values of responses obtained from the confirmatory test were almost similar
to predicted values of responses suggested by models.

Keywords: milk; viscosity; beverage; sensory; response surface methodology.
© 2020 by the authors. This article is an open-access article distributed under the terms and conditions of the Creative
Commons Attribution (CC BY) license (https://creativecommons.org/licenses/by/4.0/).

1. Introduction

        Food is the essential need of all human beings due to daily nutrients requirements. The
human body requires specific nutrients or food/chemical components for performing various
functions in our body, and some of them exert some health benefits [1-21]. Milk and milk
products are very important for us from a nutrition perspective [22-27]. That is why these
products are popular among all age groups worldwide and are included in daily diets. The
nutritive value of milk and milk products are very high [28-31]. On consumption, these
products provide us body-building proteins, minerals for bone formation and strength, lactose,
and fat as an energy source. Besides these nutritional benefits, these products also provide some
health benefits to the consumers [32]. Recently, dairy and food scientists are working on
developing food and dairy-based products with functionality and value addition [33-49].
        Milk-based beverages are the new products prepared to get nutritional benefits of milk
and other ingredients such as almonds, peanuts, sesame etc., keeping in mind the traditional
and local taste or preference of the consumers of a particular geographical area. However, due
to globalization and their excellent sensory properties, these beverages have become popular
at the global level. Milkshakes are dairy products from Western-countries prepared by freezing
the mix just like soft-serve ice-cream mix and vigorous blending/mixing the frozen product in
a blender/mixer to get foam formation and pourable consistency. Milkshakes generally contain
https://nanobioletters.com/                                                                                    2483
https://doi.org/10.33263/LIANBS103.24832493
low levels of fat and sugar as compared to ice-cream, whereas it contains high levels of milk-
solids-not-fat (MSNF) as compared to ice-cream. In India, milkshakes are very popular and are
generally prepared with milk, flavoring agent, coloring agent, and vigorous shaking but avoid
freezing than western milkshakes. A variety of flavors are used in milkshakes leads to several
variants in this product. The most popular flavoring agents used in milkshakes are rose, coffee,
chocolate, etc. Fruit and nut-based milkshakes include banana, mango, sapota, fig, almond, etc.
All these milkshakes attract consumers due to their palatability and nutritive value. But there
are regional variations in the preparation methods of these shakes. However, the base material
for all milkshakes is milk and sugar. However, variation in flavoring ingredients makes it a
product with several variants due to their specific flavor/taste. Almond milkshake is the most
popular among other shakes in India and is also known as “Badam Shake”. Almond is nutrient-
rich dry fruits having potential for inclusion in functional food recipes. Corn flour is also added
to the almond milkshake recipe. Corn flour has much application in food products due to its
functionality [50]. Response surface methodology is a widely accepted technique for
standardization of processes and studying the effect of variables on responses [51]. A little
research has been done on the standardization of milkshakes. In a present research study,
ingredients such as sugar, almond paste, and cornflour on the viscosity and sensory score of
the almond milkshake are studied.
2. Materials and Methods
2.1. Materials.
Locally available raw materials were utilized for this study. Sugar, almond, cornflour
was procured from the local market of Mehsana, Gujarat. Standardized milk was procured from
Dudhsagar Dairy, Mehsana, India. Chemicals utilized in this project were obtained from Sigma
Chemicals (India).
2.2. Formulation and preparation of almond milkshake.
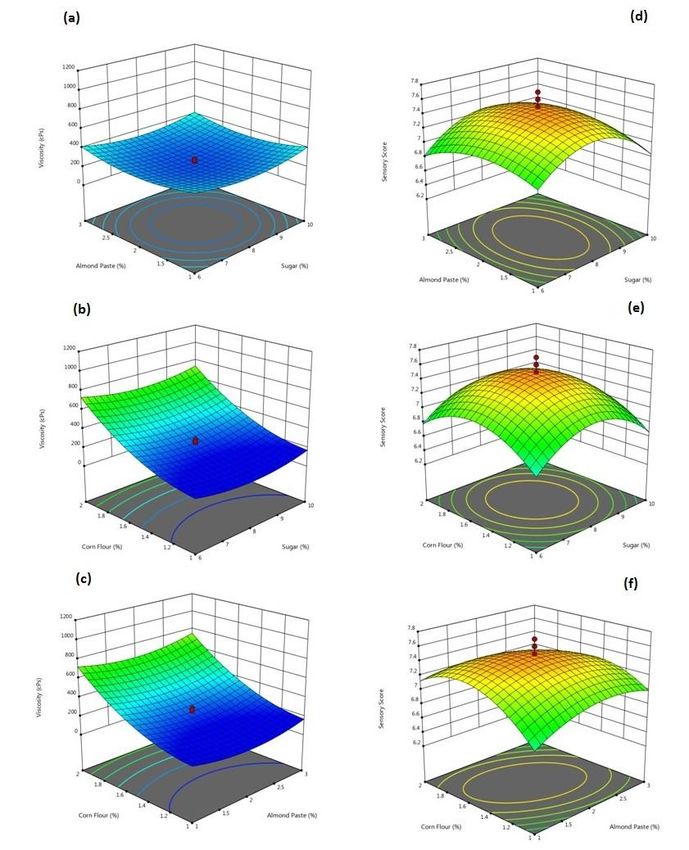
Standardized (4.5% Fat and 8.5% SNF) and pasteurized milk were selected to prepare
almond milkshake. Milk was heated, and when the temperature of the milk was reached 70°C
then sugar (4.6-11.3%), almond paste (0.31-3.6%), and cornflour (0.65-2.3) was added to milk
with agitation as per their levels of selection depicted in Table 1 for different runs. Milk was
further heated to 80°C. The heating was stopped when the mix becomes sufficiently viscous
similar to the consistency of a milkshake. The mix was then cooled to 10°C. Cardamom and
nuts were added to the cooled mix. The mix was thoroughly mixed. After that, an almond
milkshake was used for analysis (Figure 1).
2.3. Proximate analysis.
Moisture content, fat content, protein content, and almonds' ash content were
determined by standard methods [52]. The proximate composition of milk was analyzed using
milkoscan.
2.4. Viscosity.
The viscosity of the almond milkshake samples was determined using a Brookfield
viscometer (spindle-type). The viscometer was fixed with UL adaptor and spindle no. 01.
https://nanobioletters.com/ 2484https://doi.org/10.33263/LIANBS103.24832493
Before viscosity measurement of the samples, the viscometer was subjected for autozeroing in
air. After this, the type of spindle and speed of rotation (rpm) were mentioned in the viscometer
as per instructions. S01 spindle was selected for viscosity measurement of almond milkshake
samples at 30 rpm. Viscosity measurement of almond milkshake samples was carried out at
20°C.
Figure 1. Flow chart for almond milkshake making.
Table 1. Design of experiments (variables) and viscosity and sensory results (responses).
Run A: Sugar B: Almond Paste C: Corn Flour Viscosity Sensory Score
% % % cPs
1 6 3 2 815 6.5
2 8 2 1.5 214 7.4
3 8 2 2.3409 1085 6.5
4 10 1 1 225 6.3
5 8 2 0.659104 170 6.3
6 4.63641 2 1.5 501 6.2
7 10 3 1 215 6.7
8 6 1 2 789 6.8
9 8 2 1.5 220 7.7
10 10 3 2 817 6.4
11 8 2 1.5 285 7.4
12 10 1 2 791 6.7
13 6 3 1 211 6.6
14 8 0.318207 1.5 505 6.9
15 8 3.68179 1.5 534 6.8
16 6 1 1 195 6.5
17 8 2 1.5 230 7.6
18 8 2 1.5 255 7.3
19 11.3636 2 1.5 520 6.3
20 8 2 1.5 270 7.5
2.5. Sensory evaluation.
In this study, almond milkshake samples prepared using different runs were evaluated
for their sensory scores by 30 sensory panelists (between 20 to 54 years of age) and those who
had past sensory evaluation experience of similar dairy beverages. Sensory panelists carried
out the sensory evaluation study after 24 hours of refrigerated storage (10°C) of almond
milkshake samples. Sensory panelists evaluated the samples and gave each almond milk
sample a sensory score based on sensory characteristics such as color and appearance, taste,
mouthfeel and texture, acceptability on a nine-point hedonic scale, i.e., 1 to 9 (dislike extremely
to like extremely).
https://nanobioletters.com/ 2485https://doi.org/10.33263/LIANBS103.24832493
2.6. Design of experiments.
In this study, the effect of variables on the responses was studied using response surface
methodology via a selection of independent variables range for experimental design, model
fitting, selecting an optimum value of independent variables w.r.t. dependent response value.
The central composite design was chosen to investigate the effect of variables [i.e., sugar(X1),
almond paste (X2), and cornflour (X3) levels] at five levels on the responses [i.e., viscosity
(Y1) and sensory score (Y2)] for determination of optimum values of independent variables.
A set of twenty experimental runs was obtained from design expert software (Table
1). The range selected for sugar, almond paste, and cornflour were 6-10%, 1-3%, and 1-2%,
respectively, based on the initial trials. The proposed model for dependent responses was
b0= value of fixed response at experimental centre point;
bi = linear coefficient
bii = quadratic coefficient
bij = cross-product coefficient
2.7. Analysis of data.
Design-Expert software was used for the analysis of data for ANOVA and regression
model analysis. Regression models/equations were obtained via 2nd order polynomial fitting to
data. , The statistical importance of the regression model terms was analyzed. Model adequacy
was examined via R2, F-value (lack-of-fit), and F-value (model). R2 is also known as the
coefficient of determination, which reveals model fitness and is defined as explained
variation/total variation ratio [53].
2.8. Optimization.
A numerical optimization approach was used for the optimization of responses using a
design expert.
Required goals for all the independent variables and responses were selected.
Independent variables such as sugar, almond paste, and cornflour levels were kept within range.
Dependent responses such as viscosity and sensory score were selected as maximize. Different
variables on the responses were obtained in response surface graphs obtained from design
expert software.
3. Results and Discussion
3.1. Proximate analysis.
Proximate analysis data of ingredients, i.e., almond, cornflour, and standardized milk
used in this study, are shown in Table 2. Fat, protein, carbohydrate, ash, and moisture content
of the almonds were 49.8, 22.1, 21.4, 4.3, and 5.0 %. These results are in agreement with the
published literature [54]. Fat, protein, carbohydrate, ash, and moisture content of the cornflour
were 2.5, 9.8, 75.6, 0.6, and 10.2 %, respectively. These results are in agreement with the
published literature [55]. Fat, protein, carbohydrate, ash, and moisture content of the cornflour
https://nanobioletters.com/ 2486https://doi.org/10.33263/LIANBS103.24832493
were 4.6, 3.41, 4.52, 87.03, and 0.7 %, respectively. SNF and total solids content of the
standardized milk were 8.59 and 12.97 %, respectively.
Table 2. Proximate analysis data of almond, cornflour, and standardized milk.
Almond Corn Flour Standardized
Milk
Fat 49.8±0.15 2.5±0.10 4.60±0.07
Protein 22.1±0.10 9.8±0.24 3.41±0.04
Carbohydrate 21.4±0.09 75.6±0.49 4.52±0.12
Moisture 5.0±0.20 10.2±0.21 87.03±0.10
Ash 4.3±0.08 0.6±0.11 0.70±0.10
TS - - 12.97±0.30
SNF - - 8.59±0.08
3.2. Model diagnosis.
Model terms obtained from the design expert software were analyzed for their statistical
importance using ANOVA (analysis of variance). The coefficient of determination value (R2)
should be close to 1 for a good model. R2 values for viscosity and sensory score models were
0.98 & 0.95, respectively, which were high enough to validate the competence of the models
obtained [56]. Adequacy of models may also be validated via analyzing F-values of the model
and lack of fit [57]. Adequacy of models also validated by high model’s F-value and less lack-
of-fit F-value. Model’s F-value for viscosity and sensory score were 84.9 and 26.02,
respectively. Lack-of-fit F-value for viscosity and sensory score were 3.62 and 0.70,
respectively. Table 3 represents regression analysis data of models obtained for viscosity and
sensory score. Table 3 shows that viscosity was positively affected by all the variables.
However, the effect of cornflour level on the viscosity of almond milkshake was more
prominent than sugar and almond paste. The sensory score was the least affected by all
variables. It was negatively affected by sugar and almond paste and positively affected by corn
flour.
3.3. Effect of variables on viscosity.
Figure 2 (a) shows almond paste and sugar's effect on the almond milkshake's viscosity.
It is revealed that both almond paste and sugar showed little effect on the almond milkshake's
viscosity.
Table 3. Regression analysis of the second-order polynomial models for the various responses.
Predictor β (Coded Factors)
Viscosity Sensory Score
Intercept 247.73 7.48
A-Sugar 5.12 -0.0097
B-Almond Paste 7.82 -0.0196
C-Corn Flour 285.93 0.0466
AB -3.25 0.0375
AC -3.75 -0.0125
BC 5.75 -0.1375
A² 80.16 -0.4103
B² 83.34 -0.1981
C² 121.52 -0.3572
ANOVA
R2 0.9871 0.9590
Adusted R2 0.9755 0.9222
Predicted R2 0.9194 0.8333
Model F-value 84.90 26.02
Lack of fit F-value 3.62 0.7058
https://nanobioletters.com/ 2487https://doi.org/10.33263/LIANBS103.24832493
Figure 2 (a-f). Effect of sugar, almond paste, and cornflour on viscosity and a sensory score of an almond
milkshake.
The viscosity of almond milkshake first decreased and then increased with an increase
in almond paste and sugar levels. Minimum viscosity of the shake was observed in the middle
of the selected range of almond paste and sugar levels. Figure 2 (b) shows the effect of cornflour
and sugar on the almond milkshake's viscosity. It was observed that sugar showed a similar
effect on the viscosity of almond milkshake, as shown in figure 2(a), at low as well as high
levels of the cornflour. Figure 2(b) revealed that the almond milkshake samples' viscosity
tremendously increased with the increase in cornflour levels in the selected range at low and
high levels of sugar. Figure 2(c) shows the effect of cornflour and almond paste on the almond
milkshake's viscosity. Effect of almond paste levels on the viscosity of almond milkshake
showed a similar effect, as shown in figure 2(a) at low as well as high levels of the cornflour.
https://nanobioletters.com/ 2488https://doi.org/10.33263/LIANBS103.24832493
However, the almond milkshake samples' viscosity tremendously increased with the increase
in cornflour levels in the selected range at low and high levels of almond paste.
3.4. Effect of variables on the sensory score.
Figure 2 (d) shows almond paste and sugar's effect on the sensory score of almond
milkshake samples. It is revealed that the effect of sugar on the sensory score of almond
milkshake is more pronounced as compared to the almond paste. , The sensory score of almond
milkshake first increased and then decreased with increasing almond paste and sugar levels. A
maximum sensory score was observed in the middle of the selected range of almond paste and
sugar level (around 8%). Figure 2 (e) shows the effect of cornflour and sugar on an almond
milkshake's sensory score. It was observed that sugar showed a similar effect on the sensory
score of almond milkshake, as shown in figure 2(d), at low as well as high levels of the
cornflour. Figure 2 (e) revealed that the almond milkshake samples' viscosity first increased
and then decreased with the increase in cornflour levels in the selected range at low and high
levels of sugar. A maximum sensory score was observed around 2% level of cornflour and
around 8% sugar level.
Figure 2 (f) shows the effect of cornflour and almond paste on an almond milkshake's
sensory score. Effect of almond paste levels on almond milkshake's viscosity showed a similar
effect, as shown in figure 2(a) at low and high levels of the cornflour. However, the almond
milkshake samples' sensory score first increased and then decreased with the increase in
cornflour levels in the selected range at low and high levels of almond paste. A maximum
sensory score was observed around 2% level of cornflour and around 8% sugar level.
3.5. Model verification.
The numerical optimization technique of Design-Expert software was chosen for the
optimization of variables. Optimization was carried out after designating certain conditions to
variables and responses. Goals for variables, i.e., sugar, almond paste, and cornflour, were
selected ‘in-range. Whereas goals for sensory score and viscosity were designated as
‘maximum’ for almond milkshake samples. Table 4 represents the optimum value of variables
(i.e., sugar, almond paste, and cornflour) and responses (viscosity and sensory score). These
optimum sugar, almond paste, and cornflour values were used for model-verification by a
confirmation test. The experimental values observed for viscosity were 730 cps, which is
slightly higher than the optimum value (i.e., 725) predicted by the model. In contrast, the
confirmative test's sensory score was 7.0, which is slightly lower than the optimum value of
the sensory score (i.e., 7.12) predicted by the model. Hence, the confirmation test validated the
adequacy of the regression model obtained from experimental data.
Table 4. Numerical optimization of independent variables.
Parameters Goal Low level High level Optimum level
Sugar In range 6.0 10.0 7.81
Almond paste In range 1.0 3.0 1.0
Corn Flour In range 1.0 2.0 2.0
Responses
Viscosity Maximize 170 1085 725.21
Sensory Score Maximize 6.2 7.7 7.12
https://nanobioletters.com/ 2489https://doi.org/10.33263/LIANBS103.24832493
4. Conclusions
Response surface methodology was successfully used to study the effect of sugar,
almond paste, and cornflour on viscosity and a sensory score of the almond milkshake. The
optimum levels of sugar, almond paste, and cornflour for desirable responses levels were
determined using regression analysis of models obtained from design expert software. The
obtained models were validated using statistical terms like R2, model F-value and lack of fit F-
value. The values of R2, model F-value and lack of fit F-value revealed that obtained models
were statistically adequate. It can be concluded that cornflour levels showed a significantly
more significant effect on viscosity and a sensory score of the almond milkshake samples than
sugar and almond paste. Numerical optimization provided optimum levels of variables
concerning selected constraints for viscosity and sensory score. Experimental values of
responses obtained from the confirmatory test were almost similar to predicted values of
responses suggested by models. It can be concluded that good quality almond milkshake w.r.t.
viscosity and sensory scores can be prepared using optimum levels of sugar (7.81%), almond
paste (1%), and cornflour (2%).
Funding
This research received no external funding.
Acknowledgments
Authors acknowledge Executive Director, MIDFT, Mehsana for providing facilities for this
research work.
Conflicts of Interest
The authors declare no conflict of interest.
References
1. Zhang, N.; Ju, Z.; Zuo, T. Time for food: The impact of diet on gut microbiota and human
health. Nutrition 2018, 51, 80-85, https://doi.org/10.1016/j.nut.2017.12.005.
2. Pimentel, G.; Burton, K.J.; Vergères, G.; Dupont, D. The role of foodomics to understand the
digestion/bioactivity relationship of food. Current Opinion in Food Science 2018, 22, 67-73,
https://doi.org/10.1016/j.cofs.2018.02.002.
3. Lorenzo, J.M.; Munekata, P.E.; Gomez, B.; Barba, F.J.; Mora, L.; Perez-Santaescolastica, C.; Toldra, F.
Bioactive peptides as natural antioxidants in food products–A review. Trends in Food Science & Technology
2018, 79, 136-147, https://doi.org/10.1016/j.tifs.2018.07.003.
4. Dupont, D.; Le Feunteun, S.; Marze, S.; Souchon, I. Structuring food to control its disintegration in the
gastrointestinal tract and optimize nutrient bioavailability. Innovative Food Science & Emerging
Technologies 2018, 46, 83-90, https://doi.org/10.1016/j.ifset.2017.10.005.
5. Makki, K.; Deehan, E.C.; Walter, J.; Bäckhed, F. The impact of dietary fiber on gut microbiota in host health
and disease. Cell Host & Microbe 2018, 23, 705-715, https://doi.org/10.1016/j.chom.2018.05.012.
6. Siyuan, S.; Tong, L.; Liu, R. Corn phytochemicals and their health benefits. Food Science and Human
Wellness 2018, 7, 185-195 https://doi.org/10.1016/j.fshw.2018.09.003.
7. Verhage, C.L.; Gillebaart, M.; van der Veek, S.M.; Vereijken, C.M. The relation between family meals and
health of infants and toddlers: A review. Appetite 2018, 127, 97-109,
https://doi.org/10.1016/j.appet.2018.04.010.
8. Bird, A.R.; Regina, A. High amylose wheat: A platform for delivering human health benefits. Journal of
Cereal Science 2018, 82, 99-105, https://doi.org/10.1016/j.jcs.2018.05.011.
9. Fraś, A.; Gołębiewski, D.; Gołębiewska, K.; Mańkowski, D.R.; Gzowska, M.; Boros, D. Triticale-oat bread
as a new product rich in bioactive and nutrient components. Journal of Cereal Science 2018, 82, 146-154,
https://doi.org/10.1016/j.jcs.2018.05.001.
https://nanobioletters.com/ 2490https://doi.org/10.33263/LIANBS103.24832493
10. Girard, A.L.; Awika, J.M. Sorghum polyphenols and other bioactive components as functional and health
promoting food ingredients. Journal of Cereal Science 2018, 84, 112-124,
https://doi.org/10.1016/j.jcs.2018.10.009.
11. Queiroz, V.A.V.; da Silva Aguiar, A.; de Menezes, C.B.; de Carvalho, C.W.P.; Paiva, C.L.; Fonseca, P.C.;
da Conceição, R.R.P. A low calorie and nutritive sorghum powdered drink mix: Influence of tannin on the
sensorial and functional properties. Journal of Cereal Science 2018, 79, 43-49,
https://doi.org/10.1016/j.jcs.2017.10.001.
12. Benítez, V.; Esteban, R.M.; Moniz, E.; Casado, N.; Aguilera, Y.; Mollá, E. Breads fortified with wholegrain
cereals and seeds as source of antioxidant dietary fibre and other bioactive compounds. Journal of Cereal
Science 2018, 82, 113-120, https://doi.org/10.1016/j.jcs.2018.06.001.
13. Salehi, A.; Fallah, S.; Kaul, H.P.; Zitterl-Eglseer, K. Antioxidant capacity and polyphenols in buckwheat
seeds from fenugreek/buckwheat intercrops as influenced by fertilization. Journal of Cereal Science 84, 142-
150, https://doi.org/10.1016/j.jcs.2018.06.004.
14. Qara, S.; Najafi, M.B.H. Bioactive properties of Kilka (Clupeonella cultriventris caspi) fish protein
hydrolysates. Journal of Food Measurement and Characterization 2018, 12, 2263-2270,
https://doi.org/10.1007/s11694-018-9843-z.
15. Ruiz-De Anda, D.; Ventura-Lara, M.G.; Rodríguez-Hernández, G.; Ozuna, C. The impact of power
ultrasound application on physicochemical, antioxidant, and microbiological properties of fresh orange and
celery juice blend. Journal of Food Measurement and Characterization 2019, 13, 3140-3148,
https://doi.org/10.1007/s11694-019-00236-y.
16. Sadeghi, A.; Ebrahimi, M.; Raeisi, M.; Mofidi, S.M.G. Improving the antioxidant capacity of bread rolls by
controlled fermentation of rice bran and addition of pumpkin (Cucurbita pepo) puree. Journal of Food
Measurement and Characterization 2019, 13, 2837-2845, https://doi.org/10.1007/s11694-019-00204-6.
17. Bhatti, S.; Baig, J.A.; Kazi, T.G.; Afridi, H.I.; Pathan, A.A. Macro and micro mineral composition of
Pakistani common spices: a case study. Journal of Food Measurement and Characterization 2019, 13, 2529-
2541, https://doi.org/10.1007/s11694-019-00173-w.
18. Zaky, A.A.; Chen, Z.; Liu, Y.; Li, S.; Jia, Y. Preparation and assessment of bioactive extracts having
antioxidant activity from rice bran protein hydrolysates. Journal of Food Measurement and Characterization
2019, 13, 2542-2548, https://doi.org/10.1007/s11694-019-00174-9.
19. Karrar, E.; Sheth, S.; Wei, W.; Wang, X. Gurum (Citrullus lanatus var. Colocynthoide) seed: lipid, amino
acid, mineral, proximate, volatile compound, sugar, vitamin composition and functional properties. Journal
of Food Measurement and Characterization 2019, 13, 2357-2366, https://doi.org/10.1007/s11694-019-
00155-y.
20. Grassia, M.; Salvatori, G.; Roberti, M.; Planeta, D.; Cinquanta, L. Polyphenols, methylxanthines, fatty acids
and minerals in cocoa beans and cocoa products. Journal of Food Measurement and Characterization 2019,
13, 1721-1728, https://doi.org/10.1007/s11694-019-00089-5.
21. Aly, A.A.; Ali, H.G.; Eliwa, N.E. Phytochemical screening, anthocyanins and antimicrobial activities in
some berries fruits. Journal of Food Measurement and Characterization 2019, 13, 911-920,
https://doi.org/10.1007/s11694-018-0005-0.
22. Barak, S.; Mudgil, D. Effect of guar fiber on physicochemical, textural and sensory properties of sweetened
strained yoghurt. Biointerface Research in Applied Chemistry 2020, 10, 5564-5568,
https://doi.org/10.33263/BRIAC103.564568.
23. Mudgil, D.; Barak, S. Development and characterization of novel spreadable dairy butter via incorporation
of low-melting point fat from ghee. Biointerface Research in Applied Chemistry 2020, 10, 5755-5759,
https://doi.org/10.33263/BRIAC104.755759.
24. Mudgil, D.; Barak, S. Development of low sodium table butter via partial replacement of sodium chloride
with potassium chloride. Biointerface Research in Applied Chemistry 2020, 10, 6112-6118,
https://doi.org/10.33263/BRIAC105.61126118.
25. Mudgil, D.; Barak, S. Development of functional buttermilk by soluble fibre fortification. Agro Food
Industry Hi Tech 2016, 27, 44-47.
26. Mudgil, D. Influence of Partially Hydrolyzed Guar Gum as Soluble Fiber on Physicochemical, Textural and
Sensory Characteristics of Yoghurt. Journal of Microbiology, Biotechnology and Food Sciences 2019, 8,
794-797.
27. Mudgil, D.; Barak, S.; Darji, P. Development and characterization of functional cultured buttermilk utilizing
Aloe vera juice. Food Bioscience 2016, 15, 105-109, https://doi.org/10.1016/j.fbio.2016.06.001.
28. Mudgil, D.; Barak, S.; Khatkar, B.S. Development of functional yoghurt via soluble fiber fortification
utilizing enzymatically hydrolyzed guar gum. Food Bioscience 2016, 14, 28-33,
https://doi.org/10.1016/j.fbio.2016.02.003.
29. Mudgil, D.; Barak, S. Synthetic milk: a threat to Indian dairy industry. Carpathian Journal of Food Science
& Technology 2013, 5, 64-68.
30. Mudgil, D.; Barak, S. Beverages: Processing and technology. 1st ed.; Scientific Publishers, Jodhpur, India,
2018; pp. 1-16.
https://nanobioletters.com/ 2491https://doi.org/10.33263/LIANBS103.24832493
31. Mudgil, D.; Barak, S.; Khatkar, B.S. Texture profile analysis of yogurt as influenced by partially hydrolyzed
guar gum and process variables. Journal of Food Science and Technology 2017, 54, 3810-3817,
https://doi.org/10.1007/s13197-017-2779-1.
32. Mudgil, D.; Barak, S. Functional Foods: Sources and Health Benefits. 1st ed.; Scientific Publishers, Jodhpur,
India, 2017; pp. 1-16.
33. Jariyah; Yektiningsih, E.; Sarofa, U. Evaluation of antidiabetic and anticholesterol properties of biscuit
product with mangrove fruit flour (mff) substitution. Carpathian Journal of Food Science & Technology
2019, 11, 141-152, https://doi.org/10.34302/2019.11.4.13.
34. Menasra, A.; Fahloul, D. Quality characteristics of biscuit prepared from wheat and milk thistle seeds
(silybum marianum (l) gaertn) flour. Carpathian Journal of Food Science & Technology 2019, 11, 5-19,
https://doi.org/10.34302/crpjfst/2019.11.4.1.
35. Jalali, M.; Sheikholeslami, Z.; Elhamirad, A.H.; Khodaparast, M.H.H.; Karimi, M. The effect of balangu
shirazi (lallemantia royleana) gum on the quality of gluten-free pan bread containing pre-gelatinized simple
corn flour with microwave. Carpathian Journal of Food Science & Technology 2019, 11, 68-83,
https://doi.org/10.34302/crpjfst/2019.11.2.6.
36. Mudgil, D. The Interaction Between Insoluble and Soluble Fiber. In: Dietary Fiber for the Prevention of
Cardiovascular Disease. Samaan, R.A. Eds.: Academic Press: Los Angeles, USA. 2017; pp. 35-59,
https://doi.org/10.1016/B978-0-12-805130-6.00003-3.
37. Zhu, F.; Prosser, C.; Zhu, Y.; Otter, D.; Hemar, Y. Enzymatic formation of galactooligosaccharides in goat
milk. Food Bioscience 2018, 26, 38-41, https://doi.org/10.1016/j.fbio.2018.09.005.
38. Mohanty, D.; Misra, S.; Mohapatra, S.; Sahu, P.S. Prebiotics and synbiotics: Recent concepts in nutrition.
Food Bioscience 2018, 26, 152-160, https://doi.org/10.1016/j.fbio.2018.10.008.
39. Suryawanshi, V.; Sakarkar, S.; Kaur, D.C.D.; Sarwa, K. Characterization of Thermal Fraction of Clarified
Butter and its Applicability to Improve Bioavailability of Rosuvastatin. Indian Journal of Pharmaceutical
Education and Research 2019, 53, 716-723, https://doi.org/10.5530/ijper.53.4.136.
40. Mudgil, D.; Barak, S. Dairy-Based Functional Beverages. In: Milk-Based Beverages. Grumezescu, A.M.;
Maria, A. Eds.: Woodhead Publishing, Elsevier, USA. 2019; pp. 67-93, https://doi.org/10.1016/B978-0-12-
815504-2.00003-7.
41. Mudgil, D.; Barak, S. Classification, Technological Properties, and Sustainable Sources. In: Dietary Fiber:
Properties, Recovery, and Applications. Galankis, C.M. Eds.: Academic Press: Los Angeles, USA. 2019b;
pp. 27-58, https://doi.org/10.1016/B978-0-12-816495-2.00002-2.
42. Brandão, N.A.; de Lima Dutra, M.B.; Gaspardi, A.L.A.; Campos, M.R.S. Chia (Salvia hispanica L.) cookies:
physicochemical/microbiological attributes, nutrimental value and sensory analysis. Journal of Food
Measurement and Characterization 2019, 13, 1100-1110, https://doi.org/10.1007/s11694-018-00025-z.
43. Piecyk, M.; Worobiej, E.; Wołosiak, R.; Drużyńska, B.; Ostrowska-Ligęza, E. Effect of different processes
on composition, properties and in vitro starch digestibility of grass pea flour. Journal of Food Measurement
and Characterization 2019, 13, 848-856, https://doi.org/10.1007/s11694-018-9997-8.
44. Luithui, Y.; Meera, M.S. Effect of heat processing on the physicochemical properties of Job’s tears grain.
Journal of Food Measurement and Characterization 2019, 13, 874-882, https://doi.org/10.1007/s11694-
018-0001-4.
45. Sahin, A.W.; Zannini, E.; Coffey, A.; Arendt, E.K. Sugar reduction in bakery products: Current strategies
and sourdough technology as a potential novel approach. Food Research International 2019, 126, 108583,
https://doi.org/10.1016/j.foodres.2019.108583.
46. Miranda-Ramos, K.C.; Sanz-Ponce, N.; Haros, C.M. Evaluation of technological and nutritional quality of
bread enriched with amaranth flour. LWT 2019, 114, 108418, https://doi.org/10.1016/j.lwt.2019.108418.
47. Gostin, A.I. Effects of substituting refined wheat flour with wholemeal and quinoa flour on the technological
and sensory characteristics of salt-reduced breads. LWT 2019, 114, 108412,
https://doi.org/10.1016/j.lwt.2019.108412.
48. Torbica, A.; Škrobot, D.; Hajnal, E.J.; Belović, M.; Zhang, N. Sensory and physico-chemical properties of
wholegrain wheat bread prepared with selected food by-products. LWT 2019, 114, 108414,
https://doi.org/10.1016/j.lwt.2019.108414.
49. Haghighat-Kharazi, S.; Milani, J.M.; Kasaai, M.R.; Khajeh, K. Use of encapsulated maltogenic amylase in
malotodextrins with different formulations in making gluten-free breads. LWT 2019, 110, 182-189,
https://doi.org/10.1016/j.lwt.2019.04.076.
50. Jalali, M.; Sheikholeslami, Z.; Elhamirad, A.H.; Khodaparast, M.H.H.; Karimi, M. The effect of the
ultrasound process and pre-gelatinization of the corn flour on the textural, visual, and sensory properties in
gluten-free pan bread. Journal of Food Science and Technology 2020, 57, 993-1002,
https://doi.org/10.1007/s13197-019-04132-7.
51. Bezerra, M.A.; Santelli, R.E.; Oliveira, E.P.; Villar, L.S.; Escaleira, L.A. Response surface methodology
(RSM) as a tool for optimization in analytical chemistry. Talanta 2008, 76, 965-977,
https://doi.org/10.1016/j.talanta.2008.05.019.
52. AOAC, Official methods of analysis. Association of Official Analytical Chemist, Washington, DC, U.S.A.,
1995.
https://nanobioletters.com/ 2492https://doi.org/10.33263/LIANBS103.24832493
53. Mudgil, D.; Barak, S.; Khatkar, B.S. Cookie texture, spread ratio and sensory acceptability of cookies as a
function of soluble dietary fiber, baking time and different water levels. LWT-Food Science and Technology
2017, 80, 537-542, https://doi.org/10.1016/j.lwt.2017.03.009.
54. Fernandes, D.C.; Freitas, J.B.; Czeder, L.P.; Naves, M.M.V. Nutritional composition and protein value of
the baru (Dipteryx alata Vog.) almond from the Brazilian Savanna. Journal of the Science of Food and
Agriculture2010, 90, 1650-1655.
55. Nasiri, F.D.; Mohebbi, M.; Yazdi, F.T.; Khodaparast, M.H.H. Effects of soy and corn flour addition on
batter rheology and quality of deep fat-fried shrimp nuggets. Food and Bioprocess Technology 2012, 5,
1238-1245, https://doi.org/10.1007/s11947-010-0423-4.
56. Mudgil, D.; Barak, S.; Khatkar, B.S. Process optimization of partially hydrolyzed guar gum using response
surface methodology. Agro Food Industry Hi Tech 2012, 23, 13-15.
57. Mudgil, D.; Barak, S.; Khatkar, B.S. Optimization of enzymatic hydrolysis of guar gum using response
surface methodology. Journal of Food Science and Technology 2014, 51, 1600-1605,
https://doi.org/10.1007/s13197-012-0678-z.
https://nanobioletters.com/ 2493You can also read