Overview of the Joint Action - JANPA HLG/EU Platform DG Santé Luxembourg - European ...
←
→
Page content transcription
If your browser does not render page correctly, please read the page content below
JANPA
                          HLG/EU Platform
                             DG Santé
                           Luxembourg
                         29 NOVEMBER 2017

Overview of the Joint Action
           Dr Michel Chauliac, Direction générale de la santé
              Ministère des solidarités et de la santé, France
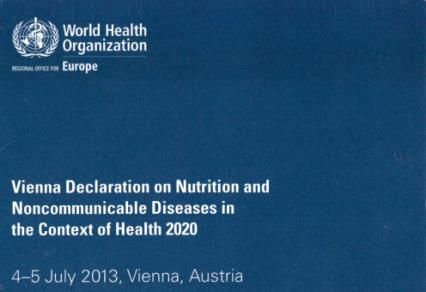
At EU and international level :
since 2000, many political initiatives

      Since 2000, at EU level, 16 Council
       conclusions on topics related to
     nutrition, physical activity, obesity, or
                    lifestyle

  Many EU actions and research projects
The HLG elaborated the EU Action Plan on Childhood Obesity
2014-2020
Goal : To contribute to halting the rise in overweight and obesity
in children and young people (0-18 years) by 2020
Areas for action (with operational objectives, actions, indicators, targets)
Support a healthy start in life;
Promote healthier environments, especially in schools and pre-schools;
Make the healthy option the easier option;
Restrict marketing and advertising to children;
Inform and empower families;
Encourage physical activity;
Monitor and evaluate;
Increase research.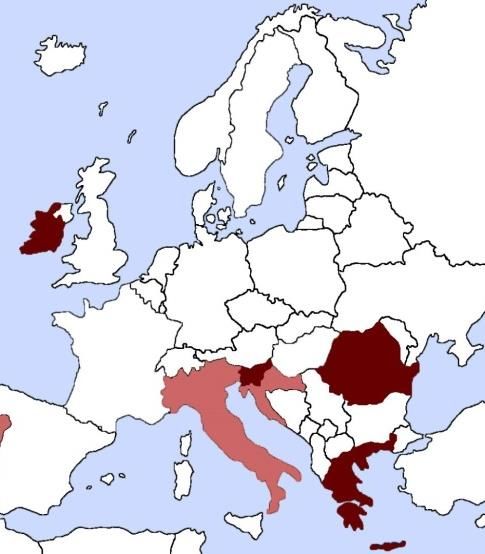
Member states proposed, as a buiding block to implement
                  the EU action plan

Joint Action on Nutrition and Physical Activity
           JANPA General objective
To contribute to halting the rise in overweight and
obesity in children and adolescents by 2020 in EU, within
the global frame of the “EU Action plan on childhood
obesity 2014-2020”, and in close link with the “European
action plan for a nutrition and food policy 2015-2020”.

   Duration: 27 months, Sept. 2015 to Nov. 2017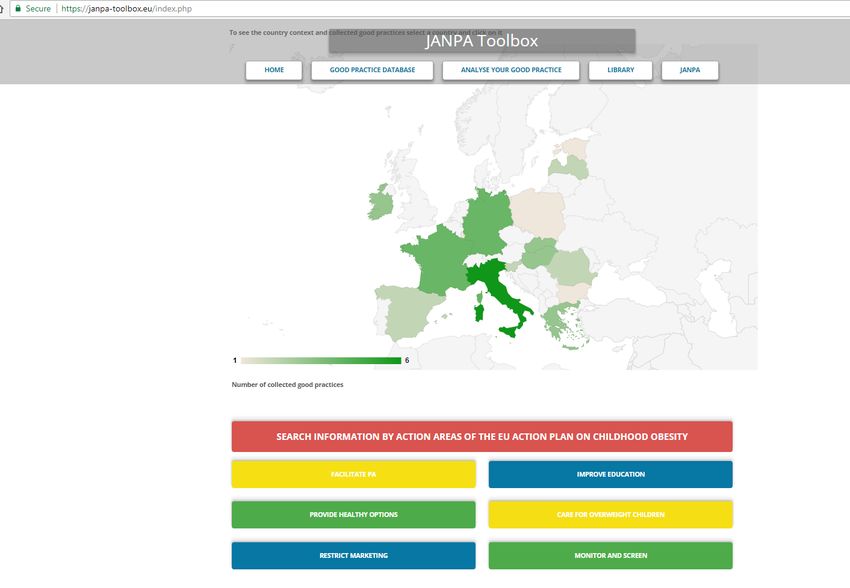
JANPA’s overarching characteristics The question of social inequalities A life course approach : promotion of a healthy diet and physical activity in children already starts during pregnancy and early age A multi-sectorial approach, with integrated actions better coordinated, government actions between the social, employment, education, health, agriculture, transport and private sectors A diversity of issues : economic aspects for advocacy, information, food reformulation, physical environment, stakeholder involvement-dissemination, A variety of settings : pre-natal, kindergartens and schools, home, health facilities, retailers, … Regular link with the High Level group on nutrition and physical activity (EU/DG SANTE)
JANPA Partners
       26 countries/ 39 associated partners (ministries, public health and nutrition
       agencies and institutes, universities, …) & collaborative partners

1.    Austria                                          15.   Latvia
2.    Bulgaria                                         16.   Lithuania
3.    Belgium                                          17.   Luxembourg
4.    Croatia                                          18.   Malta
5.    Cyprus                                           19.   Norway
6.    Czech Republic                                   20.   Poland
7.    Estonia                                          21.   Portugal
8.    Finland                                          22.   Romania
9.    France                                           23.   Slovakia
10.   Germany                                          24.   Slovenia
11.   Greece                                           25.   Spain
12.   Hungary                                          26.   Sweden
13.   Ireland
14.   Italy                                            In addition to:
                                                       –    WHO-Europe
                                                       –    JRC, EC
Technical work packages
- WP4 Evidence and Economic rationale for action on childhood obesity: Ireland
- WP5 Nutritional information monitoring and food reformulation prompting:
France
                                                                         7 to 14
- WP6 Healthy environments by integrated approaches Hungary            countries in
- WP7 Early interventions Finland                                       each WP

    Transversal work packages
- WP1 Coordination (administrative, financial, technical, …): France
- WP2 Dissemination (stakeholder analysis, website, poster, social media, …): Italy
- WP3 Evaluation (performance as to relevance, effectiveness, efficiency, impact)
Greece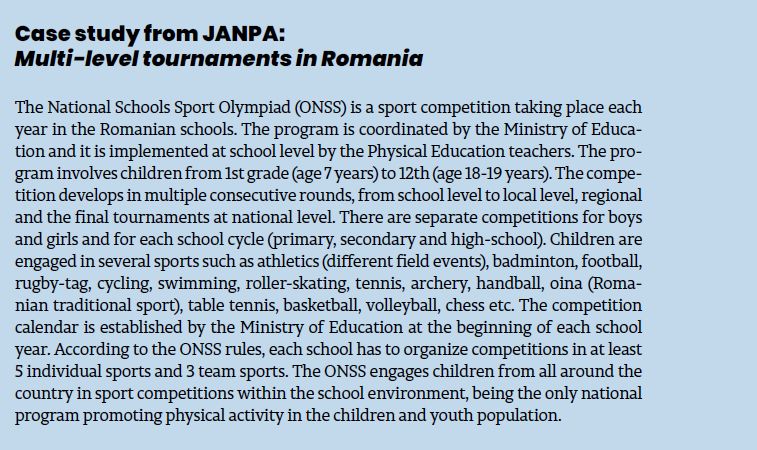
Objective of WP6

Help Member States to identify ways to create healthier
environments in kindergartens and schools by providing
guidance on policy options and programmes.

To complement the theoretical framework with
rigorously selected examples and ideas from the ground
that can inspire other countries to act and move such
initiatives forward.
WP6 Work Plan

                                                            1. HUNGARY
                                                            2. GERMANY
                  Task 6.2: Collection and                  3. GREECE
                  analysis of national good                 4. POLAND
                  practices using a                         5. ROMANIA
Task 6.1:
                  standardized protocol       Task 6.4:
Definition                                                  6. BULGARIA
                  and gather country          Create a
and criteria of
                                              Guide and
                                                            7. ESTONIA
                  context data
good practice                                               8. FRANCE
                                              an online
for childhood                                               9. ITALY
                                              Toolbox for
obesity                                                     10. LATVIA
                                              decision
prevention
                                              makers and    11. LUXEMBOURG
programs in       Task 6.3: Policy capacity
                                              programme     12. SLOVAKIA
kindergartens     assessment for
                                              planners      13. SLOVENIA
and schools       childhood obesity
                  prevention in different                   14. SPAIN
                  sectors                                   15. IRELAND
                                                            16. MALTA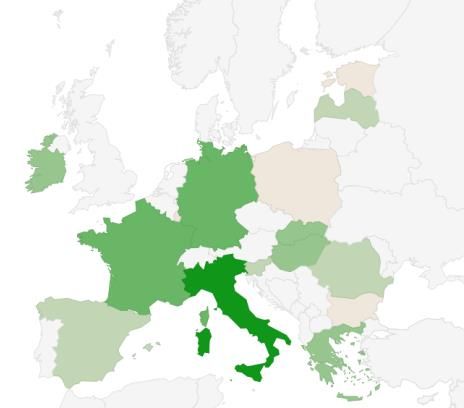
Task 6.1: Definition and criteria of good practice
A good practice is an initiative that has been proven to work well (i.e. process evaluation)
and produce good results (i.e. output and outcome evaluation), and is therefore
recommended as a model.
It is a sustainable and efficient experience, with clear objectives and clearly defined target
groups that is aimed to be empowered. Its activities use existing structures and it has a
broad support amongst the target population, thus deserves to be shared so that a greater
number of people can adopt it.
Intervention characteristics
The approach is proven to be successful and effective in practice (has had a positive impact on individuals
and/or communities)
Objectives are clear and SMART (specific, measurable, achievable, realistic and time-bound)
Target group is clearly defined (including age, gender and socio-economic status)
Implementation
Activities are using/integrating existing structures
Target group is aimed to be empowered (enhance their knowledge, skills and competences so that they can
make decisions independently)
There is broad support for the intervention amongst the intended target populations
Monitoring and evaluation
Outcome/impact evaluation showed significant contribution to the target behavior or its determinants
Most of the planned activities have been performed and most of the objectives have been reached
Financial and human resources are in place for evaluationWHAT actions have been done in the participating Member States? Science- and practice-based guide on establishing a school environment supportive of healthy eating and physical activity. Structure: EU Action Plan recommendations to create healthy environment: 1) facilitate physical activity 2) provide easy access to the healthy options and eliminate unhealthy foods 3) restrict marketing 4) improve the education on nutrition and healthy lifestyle 5) care for overweight children 6) monitor and screen for overweight children
1. Facilitate physical activity
www.janpa-toolbox.eu
HOW should these measures be implemented in other
contexts?

       1. Use an integrated approach
       -multi-component
       -multi-actor / inclusive approach
       -multi-sectoral
       2. Ensure sustainability
       3. Increase capacity for transferability and
       reproducibility
       4. Consider dimensions around equity
       5. Include a robust process and impact evaluation
Conclusions of WP6 • The online Toolbox facilitates interactions between programme coordinators and those who would like to act, which is essential to connect national teams • Give special attention to and develop systematic evaluations on the impact of initiatives, focusing on the reduction of social inequalities if possible through harmonized indicators • The analysis of conditions for the inter-country transferability of “good practices” should be strengthened • More work should be done on the area of marketing and care for overweight children • After JANPA ends, this work with the Toolbox should be continued and probably extend to other areas
OBJECTIVES
WP7| EARLY INTERVENTIONS

1. To find the best programmes/interventions in
   Member States concerning pregnant women
   and families with children up to 36 months
2. To develop information on models of good
   practice, with special attention to social
   inequality
3. To improve the quality of public policies and
   interventions promoting healthy diets and
   physical activity
01/12/2017
WP7 work plan

                                              Task 7.2 Analyses of
Task 7.1: Defining criteria
                                              selected interventions
for good practices and
                                              Collecting information on
selecting practices
                                              policies
                                    50
                              interventions
                                  from 9
                                countries
                                              Task 7.4 Compilation of
Task 7.3 Selection of good
                                              relevant information on
models to be developed
                                              good models for future
further
                                              actions
I Pre-conditions for decision making – Good, longitudinal data – Availability of information through adequate public health monitoring – Political commitment is a basis to decisions – Communication plan is a mean for actions – A common vision of the importance of health promotion in all levels of decision making – A forum for decision makers
II Conditions for the design
– Research and independent expertise are needed to
  give decision-makers up-to-date information
– A concrete plan for each stage of preparation and
  implementation and a willingness to learn from
  evaluated feedback
– A unified governance center or network that actively
  and regularly keeps stakeholders committed
– Continuation and evaluation of the
  programme/intervention ensured in planning phase
III Ideal conditions for implementation
– Governing bodies need to support implementing
  authorities
– Appropriate financial and staff resources
– Multisectoral participation also in implementation level
– Continuous participatory training
– Attractive tools and training for the professionals in the
  public health and social services systems
– Modern and modifiable validated tools for health
  promotion
JANPA RECOMMENDS:
– Starting from the Toolbox created by JANPA, set up a sustainable
  and user-friendly platform or database which promotes and
  facilitates interaction between the initiators of actions and
  professionals
– Special attention be paid to the initiatives on the reduction of social
  inequalities through the identification of specific indicators
– The database created by JANPA should be kept “alive” and
  extended to other determinants of chronic diseases after the end JA
  ends
– Improving the wide scale implementation of practices and
  experiences identified as important during the Joint Action with the
  support of the steering group for prevention and promotion of DG
  Santé
– Strengthening the analysis of conditions for the inter-country
  transferability of good practices through a specific call for proposal
OBJECTIVES OF THE WP5
– Incite manufacturers to improve the nutritional
quality of their products
– Contribute to improving:
• the understanding on food information by all
families
• and the use of food information by the MS
Harmonisation of nutritional information (and
the way it is collected and used in Europe)WP5 working plan
Task 5.1: Identification of
Task 5.2: Analysis of uses
available food
of food information for
information /
nutrition policy
surveillance tool
In the 9
participating
countries Austria
Romania
Task 5.4: pilot studies France
Task 5.3: Analysis of uses implementation:
of food information by nutritional composition
families comparison and
monitoring network Soft drinks
Breakfast
cereals
France / Austria / Romania / Belgium / Bulgaria
/ Lithuania / Norway / Slovakia / SloveniaTask 5.1 identification of available food information A need to develop monitoring tools to follow the nutritional composition of the food supply Task 5.2 use of the food information by government A need to combine several types of actions to improve the situation (information, reformulation, food environment – ads, serving sizes) Task 5.3 use and understanding by consumers of the information on labels Necessity to simplify / homogenize food labeling ; Front Of Pack labels should be : Simple /interpretive /ordinal ; necessity to combine with other type of actions
Task 5.4 Pilot studies
• Aims
Collect the nutritional information: harmonize the analysis and
presentation of the data
Present comparisons and identify best formulations
Test the Oqali model from France
• Results:
o Methodology easily transposable to other European countries
o Data gathered for 520 breakfast cereals and 890 soft drinks (in
only 2 months)
o Data collected and treated following harmonized rulesSegmentation of the market by family of
product* for regular soft drinks
Proportion of the different families of products Different food offer in the
for regular soft drinks (in number of references) 3 countries (in number of
100% 3% 2%
references )
4% 1%
0% 5% 5%
90% 10%
13%
5%
Prevalence of
7% Tonics and bitters (sugar > 2,5g/100
80% 7% ml) beverages with fruits in
7%
70%
Flavoured waters (sugar > 2,5g/100
ml)
the 3 countries (60-80%)
18%
14%
Lemonades (sugar > 2,5g/100 ml)
60% Much more non
50% 22% 64%
Colas (sugar > 2,5g/100 ml) carbonated beverages
40% 34% Beverages with tea (sugar > 2,5g/100 with fruits in Romania
ml)
30% Non carbonated beverages with
fruits (sugar > 2,5g/100 ml)
Different definition of
20% 32% Carbonated beverages with fruits flavoured waters,
16% (sugar > 2,5g/100 ml)
lemonades
10% 16% Fruit based beverages with fruit
content >50%
6% 8%
0% 1%
Austria 2016 France 2013 Romania 2016
n=359 n=969 n=353
* Products with similar characteristics e.g. colas or beverages with tea among soft drinksSegmentation of the market by type of
brand for soft drinks
Different stucturation of
the market in the 3
countries (in number of
references )Comparison of sugar content
in soft drinks between countries
Example for carbonated beverages with fruits with sugar
Number
Mean Standard Minimum Maximu
Country of
value deviation value m value
products
Austria
(2016) 114 6,8 c 2,8 2,7 13,0
France
(2013) 150 8,7 b 1,7 3,3 12,8
Romania
(2016) 57 9,5 a 2,6 3,8 13,8
High variability
different offer (type of products
/ flavoured waters type products)
Type and percentage of fruit
Reformulation possible
Significant difference between the 3
countries but same variability of
resultsComparison of sugar content
in soft drinks between countries
Sugar content (g/100ml) Austria 2016 France 2013 Romania 2016
Number of Mean Number of Mean Number of Mean
Family of product p-value references value references value references value
Fruit based beverages with fruit content >50% 1,4E-06 21 7,0b 76 10,4a 3 8,7
Carbonated beverages with fruits (sugar >
b a
2,5g/100 ml) 3,7E-12 114 6,8 150 8,7 57 9,5
Non carbonated beverages with fruits (sugar
Regular > 2,5g/100 ml) 4,8E-07 78 9,5a 292 8,9b 227 9,7a
products Beverages with tea (sugar > 2,5g/100 ml) 0,67 63 6,2 117 6,1 23 6,4
Colas (sugar > 2,5g/100 ml) 0,09 26 9,9 61 9,2 17 9,1
b b a
Lemonades (sugar > 2,5g/100 ml) 4,0E-04 35 8,4 95 8,2 16 10,9
Flavoured waters (sugar > 2,5g/100 ml) 0,66 1 3,5 35 3,6 4 3,9
Tonics and bitters (sugar > 2,5g/100 ml) 2E-06 15 10,4a 28 7,4b 6 9,8a
Beverages with fruits (sugar ≤ 2,5g/100 ml) 0,05 17 0,8 73 0,8 45 1,2
Beverages with tea (sugar ≤ 2,5g/100 ml) 5,4E-04 4 1,5a 25 0,2 10 0,04b
Low sugar Colas (sugar ≤ 2,5g/100 ml) 0,77 15 0,1 82 0,04 15 0,2
products Lemonades (sugar ≤ 2,5g/100 ml) 0,78 10 0,2 31 0,1 42 0,03
Flavoured waters (sugar ≤ 2,5g/100 ml) 0,03 5 0,4 55,0 0,0 9,0 0,3
Tonics and bitters (sugar ≤ 2,5g/100 ml) 0,56 0 3 0,1 5 0,01
a
Highest sugar content (significant difference)
b
Lowest sugar content (significant difference)
Significant difference for 6 families out of the 14 studied (5 out of the 8 families
of regular products)
Important difference between families of soft drinksComparison of sugar content
in soft drinks for common references
Number of Percentage of
common common
references references
Number of with similar with similar
Number of references common nutritional nutritional
Family of product Austria France Romania references composition* composition*
Fruit based beverages with fruit
content >50% 21 76 3 0 0 -
Carbonated beverages with
fruits (sugar > 2,5g/100 ml) 114 150 57 5 1 20%
Non carbonated beverages with
fruits (sugar > 2,5g/100 ml) 78 292 227 15 14 93%
Beverages with tea
(sugar > 2,5g/100 ml) 63 117 23 7 4 57%
Colas
(sugar > 2,5g/100 ml) 26 61 17 3 2 67%
Lemonades
(sugar > 2,5g/100 ml) 35 95 16 2 0 0%
Flavoured waters
(sugar > 2,5g/100 ml) 1 35 4 0 0 -
Tonics and bitters
(sugar > 2,5g/100 ml) 15 28 6 1 0 0%
* references showing exactly the same sugar content or a difference of sugar content lower than 0,1 g/100 ml
21 similar products out of 33 common references (total =2155)
Few common references
The same reference may have different formulations in different countries
(adaptation to local taste / delay in implementation of reformulation / different
owner of the brand etc.)Conclusions for soft drinks
– Need to work at the family level because the
portfolio of families of products is different according
to countries
Potential for
reformulation
– High variability observed for sugar content for some
familiesConclusions for soft drinks
– Difference observed in the sugar content between the 3
countries for 6 families out of the 14 studied
– Differences dueFood
to producers should be
Different food
encouraged
offer to in reformulate their
the 3 countries (different
segmentationmajor references
of the market,on thecommon
few basis of the
references);
“best in class” products
Different definition of a same appellation (lemonades,
flavoured waters);
Different characteristics within a family of products;
Different composition of a same reference.Conclusion of WP5
Monitoring tool managed by public authorities and
fed by industry necessary :
• to qualify the nutritional quality of the food offer
• to follow up the impact of the nutrition policies deployed
Necessity to work at the brand and at the country
level:
• the offer varies depending of the country,
• but also because the composition of the products can be
different from one country to another.
Methodology used in Oqali adaptable to other
European countries with minor modificationsJANPA RECOMMENDS: Deploying the tested method in several European countries to: – Determine average levels of nutrients of interest (sugar, salt, fat, saturated fatty acids, energy) and their variability, by product groups and sub-groups (for example, chocolate-based breakfast cereals within the broader sector of breakfast cereals), type of brand (national brands versus retailer brands) and brand – Compare, among countries, the nutritional quality of foods by groups and sub groups – Ensure the reliable monitoring of trends in these data
JANPA RECOMMENDS:
– In 2018, under the leadership and with the support of
  the Commission, to hold a meeting of the
  organisations appointed by the volunteering Member
  States and constitute a network
– To continue to develop, until 2020 and beyond, the
  country network, implementing a harmonised
  methodology for the collection and processing of
  nutritional information
– To set or revisit appropriate and realistic objectives for
  the nutritional reformulation and improvement of
  foods by mid-2019. This could lead to a European
  regulation setting threshold values
WP4 JANPA COSTING MODEL
A very ambitious work: first lifetime costing study that developed
and applied a standard methodology in many countries

Aims:
• Describe the lifetime cost of childhood obesity
• Assess the effect of reducing mean childhood BMI by 1% and 5%

Conducted within model principles; eg
• Societal economic perspective
• Transparency
• Maximising the use of resources
• Building capacity
DATA REQUIREMENTS
Population Childhood population size
BMI Historical BMI distribution (all ages)
Disease parameters Annual incidence rates
Annual prevalence rates
One-year survival probabilities
Annual mortality rates
Direct healthcare costs Annual per case direct healthcare costs
Lifetime income losses Annual average income
Productivity losses due to premature
mortality
Productivity losses due to absenteeism Average number of days absent
Social welfare payments
Other Life expectancies at birth, Minimum legal
working age, Retirement ageCONCLUSIONS - REPUBLIC OF IRELAND (1) • Total financial costs (€4,518.1M) account for 1.6% of GDP in 2015 • Lifetime financial cost is €16,036 per person • Direct healthcare costs (€944.7M) account for 4.8% of public health expenditure in 2015. • Premature deaths (55,056) account for 1 in 10 of all premature deaths • Societal costs are larger than direct healthcare costs • Premature death is a larger cause of productivity loss than absenteeism (€2,795.4M vs €521.9M)
CONCLUSIONS - REPUBLIC OF IRELAND (2)
Gender differences:
   • Male productivity losses due to premature mortality and
     lifetime income losses are higher
   • Female direct healthcare costs and productivity losses due
     to absenteeism are higher

Northern Ireland comparison highlights importance of context:
   • Direct health care costs are relatively higher in Northern
     Ireland
   • Indirect (societal) costs are relatively higher in Republic of
     Ireland

Large savings (€1,127M) with modest changes in childhood BM
WP4 CONCLUSIONS JANPA WP4 established that reliable estimates of lifetime cost of childhood obesity/overweight could be obtained Estimates highlight the large cost and the large savings that could follow from a modest change In childhood BMI. If we deal with the unforeseen difficulties, the other valuable data that has been collated can produce reliable and meaningful estimates in the remaining countries
JANPA RECOMMENDS:
– Sharing the JANPA costing model with the Organisation for
  Economic Co-operation and Development (OECD) so that
  its management and development can be incorporated into
  their ongoing project to improve the modelling capacity of
  the economics of prevention
– Deploying the JANPA costing model in all European
  countries for which good-quality data are available, if
  possible by building on the OECD economics of prevention
  project. This could be done over the next two years (2018-
  2019) possibly with the support of a dedicated European
  budget
– Organising a high-level European conference in 2020, for
  example at the European Parliament, to draw
  comprehensive conclusions based on this work
JANPA is a building block…
JANPA is a building block of a broader initiative
to achieve the objective of the European action
plan.
In 2 years JANPA has produced pragmatic
conclusions that can be implemented, relying on
the strength of coordination at European level
with the European Commission.
WHAT FUTURE? In every Member State (MS), the decision-making chain leading to the implementation of actions should be mobilised to ensure that these conclusions are taken into account at the operational level Within national and regional policies and programmes on nutrition and physical activity in each MS, it should be possible to discuss these recommendations, tailor them to the political and institutional context, and implement them At the EU level, the High Level Group on Nutrition and Physical Activity should be responsible for monitoring and evaluating progress The High Level Group should report regularly to the Steering Group for Prevention and Promotion and its best practices should be considered for wide scale implementation
WHAT FUTURE? The Commission should continue its involvement based on the Council’s conclusions inviting it to provide the necessary support The European Action Plan will come to a close in 2020. JANPA has contributed to its implementation. An evaluation will therefore need to be undertaken to determine whether JANPA’s recommendations have been taken into account The European Parliament could hold discussions on obstacles to the implementation of the recommended measures
MERCI
                                                                                                    salma.elreedy@anses.fr
                                                                                                 michel.chauliac@sante.gouv.fr

This presentation is part of the Joint Action JANPA (Grant agreement n°677063) which has received funding from the European Union’s Health Programme (2014-2020).
The content of this presentation represents the views of the author only and is his/her sole responsibility; it cannot be considered to reflect the views of the European
Commission and/or the Consumers, Health, Agriculture and Food Executive Agency or any other body of the European Union. The European Commission and the Agency
do not accept any responsibility for use that may be made of the information it contains.
You can also read