How to Structurally Reform the National Health Service to Improve Patient Outcomes
←
→
Page content transcription
If your browser does not render page correctly, please read the page content below
How to Structurally Reform the National Health
             Service to Improve Patient Outcomes
                                       A healthcare briefing
                                             Dr Kristian Niemietz
                                                        2 July 2018

2018 marks the 70th birthday of the UK National Health Service – an institution which commands an
unparalleled trust and reverence from the British people.1 Yet, to many casual onlookers, the Health Service
appears to be in a perpetual state of “crisis”. To some extent, this is borne out by the available data on
health outcomes and waiting times, where on many measures the NHS lags behind Western European
counterparts. The consensus view amongst policymakers and the wider commentariat is that the only way to
solve problems in the NHS is by increasing funding. While the NHS’s financial constraints are real, and, in the
short term, cash injections might prove beneficial, without major structural reform and efficiency gains, the
NHS will remain an unsustainable system, characterised by waiting lists, rationing, and mediocre patient
outcomes.

Unfortunately, much-needed discussions of NHS reform are often hampered by the insular nature of
healthcare debate in the UK. Perhaps most damagingly of all, universal healthcare coverage is routinely
praised as a unique British achievement, although this long ago ceased to be the case. In reality, Social
Health Insurance (SHI) models are common in Europe and most OECD countries. These rate more highly for
public satisfaction, deliver better outcomes, while proving definitively that universal health coverage is not
unique to the NHS. It is time our lawmakers did what they do in other areas of policy – namely, learning from
international best practice.

1
    The NHS is consistently voted our best-loved institution in opinion polls – e.g. Opinium, 2016

                                                                                                             1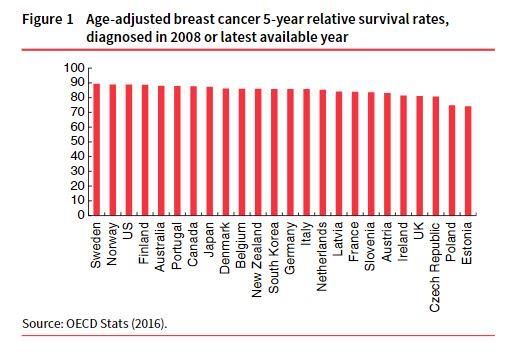
Key points
Despite some improvements in the last fifteen years, the NHS lags Western European counterparts
in terms of health outcomes. In international comparisons, the NHS almost always ranks in the
bottom third, putting it on a par with Eastern European countries like the Czech Republic and
Slovenia.
Survival rates for the most common types of cancer are several percentage points behind those
achieved by the best performing countries. The same is true for strokes, as well as for the more
holistic measure of amenable mortality. Waiting times are also longer.
The UK spends less on healthcare than many other developed countries, but this must not be
mistaken for a sign of superior efficiency. It is mostly the result of crude rationing: innovative
medicines and therapies that are routinely available in other high-income countries are often hard to
come by in the UK. In more sophisticated estimates of health system efficiency, the NHS ranks,
again, in the bottom third.
The one study which seemingly comes to a radically different conclusion is the Commonwealth Fund
study, which ranks the NHS as the world’s top performer. However, there is only one category in the
Commonwealth Fund study examining health outcomes, and in that category, the NHS ranks second
to last. Even the preferred study of NHS supporters shows that the NHS is an international laggard in
terms of outcomes, i.e. keeping people alive.
There are serious questions about the sustainability of the NHS’s current funding model. Since the
NHS is financed on a purely ‘pay-as-you-go’ basis, all current expenditure is paid out of current tax
revenue. Against the backdrop of an ageing population, this is a very unstable financing method.
Introducing pre-funding to the system through an old-age reserve fund would defuse the
demographic time bomb and put the healthcare system on a much more stable financial footing.
In terms of outcomes, quality and efficiency social health insurance systems are consistently ahead
of the NHS on almost every available measure. These combine the universality of a public system
with the hallmarks of a market system: consumer sovereignty, pluralism, competition, and
innovation.
Policymakers should consider proposals to open the market to both non-profit and for-profit
insurers. The quasi-market reforms of the 2000s should be built upon to improve patient choice,
strengthen the self-governance of providers and enshrine the principle that money follows the
patient.
2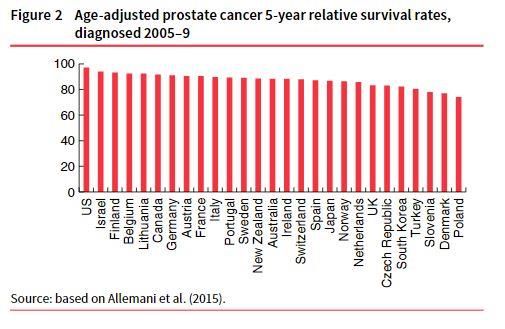
International comparisons of survival rates
Cancer
There are over 100 different types of cancer, but the five most common ones, taken together, account for 56
per cent of all cancer cases diagnosed in the UK. Age-standardised survival rates for these types of cancer in
Britain remain several percentage points below rates achieved in most other developed countries. Such
differences translate into thousands of lives lost:
The most common type of cancer in the UK is breast cancer, with about 53,700 new cases diagnosed
each year. The UK’s five-year survival rate for breast cancer is 81.1 per cent, about five percentage
points below South Korea, the 12th-best performer in OECD measures. Taken on these measures, if
UK breast cancer patients were treated in South Korea rather than on the NHS, an extra 2,500 lives
could be extended every year. (See Fig 1)3
Prostate cancer is the second most common type of cancer in the UK, with just over 47,000 new
cases per year. The UK’s five-year survival rate of 83.2 per cent is lower than in most other
developed countries. For patients in Sweden, which ranks 12th, the chance of survival is six
percentage points higher, which means that if British patients had been treated in Sweden, an extra
2,800 might have lived beyond the five-year period (see Figure 2)4.
3
Source: OECD Stats (2016), OECD database (http://stats.oecd.org/index.aspx?DataSetCode=HEALTH_STAT).
4
Source: Global surveillance of cancer survival 1995-2009, Allemani et al (2015)
https://www.ncbi.nlm.nih.gov/pubmed/25467588
3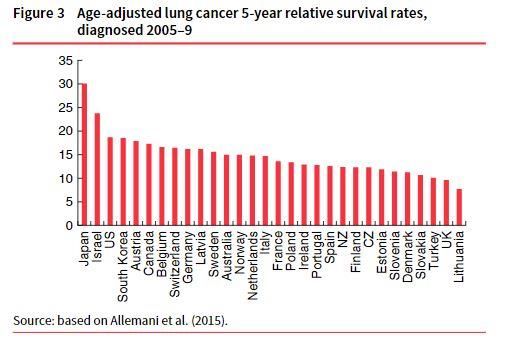
For lung cancer, the UK has, again, the lowest survival rate of all high-income countries in this
sample, at 10 per cent - with plenty of upper/middle-income countries achieving better results.
Survival rates are over five percentage points higher in Australia, which ranks 12th on this count.
This is equivalent to over 2,400 lives which might have been lengthened if the Australian system had
treated the UK’s lung cancer patients rather than on the NHS. (See Fig 3)5
The fourth most common type of cancer in the UK is bowel cancer, with over 41,000 new cases
detected each year. The UK has, once again, the lowest five-year survival rate of all high-income
countries in the sample, trailing more than seven percentage points behind Canada, the 12th best.
The annual number of excess deaths, when choosing Canada as a bench-mark, is over 3,000 (see
Figure 4)6
5
Source: ibid
6
Source: OECD Stats (2016)
4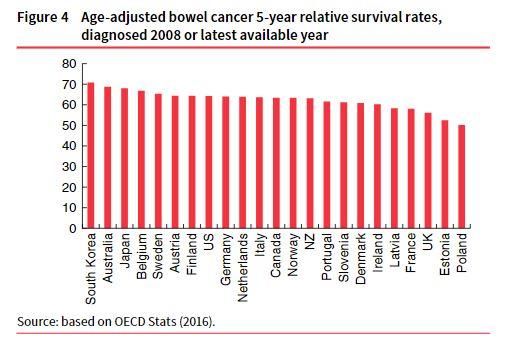
Melanoma, a form of skin cancer, is diagnosed about 14,500 times per year, which makes it the fifth
most common form of cancer in the UK. Information on melanoma survival rates is limited to
European, rather than OECD countries. Yet in this smaller country sample, England occupies a
middling position (see Figure 5)7.
Note that the calculations listed above were based on comparisons with middle-performing countries.
Comparing NHS with higher-ranking nations yields more alarming results.
7
Source: Eurocare, Survival of cancer patients in Europe (2014) (https://w3.iss.it/site/EU5Results/forms/SA0007.aspx)
5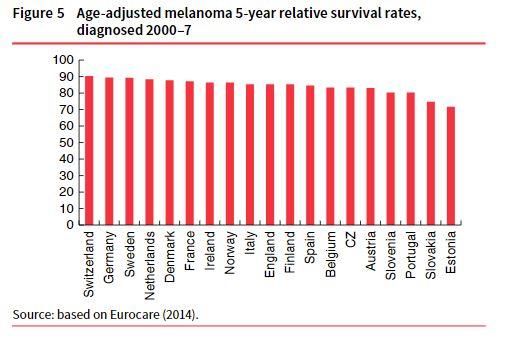
If the UK’s breast cancer, prostate cancer, lung cancer and bowel cancer patients were treated in the
Netherlands rather than on the NHS, more than 9,000 lives would be saved every year. If they were
treated in Germany, more than 12,000 lives would be saved, and if they were treated in Belgium,
more than 14,000 lives would be saved.8
Stroke
In the UK, the 30-day survival rate for the most common type of stroke is 9.2 per cent, 2.3 percentage points
higher than the rate achieved by the 12th-best performer, Switzerland.9 The difference may seem small, but
it still amounts to around 3,000 lives that could be saved if NHS care rose to Swiss standards.
Amenable mortality
Amenable mortality (AM) is a more holistic indicator of health system performance - comparing a country’s
actual mortality profile to the hypothetical profile we would observe under an ‘optimal’ health system, in
which every life that could, in theory, be saved through medical treatment really is being saved.
Among Western European countries, AM is lowest in Switzerland, France, Spain, Italy and the
Netherlands. It is highest in Greece, Finland, the UK, Ireland and Portugal. There are about 111
avoidable deaths per 100,000 people in the UK every year.10 If that figure could be reduced to the
rate observed in Denmark, about 5,600 lives would be saved each year.
If this rate were cut to the levels observed in Belgium, more than 10,000 lives would be saved every
year. More than 13,000 lives would be saved if the rate were cut to Dutch levels.
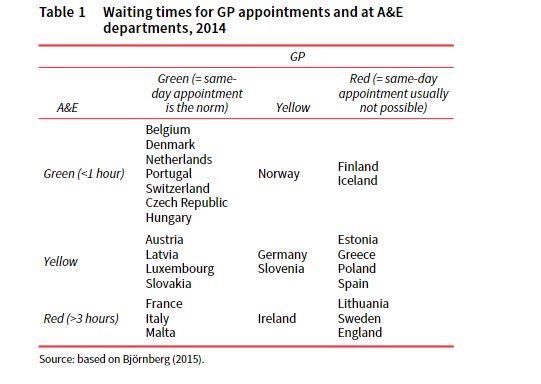
Waiting times
Although internationally comparable data on waiting times are only available for a handful of countries. It is
fair to say that swift access to care is not one of the NHS’s strengths. The best available metric is the Euro
Health Consumer Index (EHCI)11 based on patient associations’ assessment of how likely it is that a
representative patient will wait for longer than a specified reference period. Countries are allocated scores
on this basis, with a green score meaning fast access, a red score meaning long waits, and a yellow score
being somewhere in between. Though an imperfect metric in many ways12, ECHI findings are the closest
thing we have to data on waiting times.
8
Niemietz, Universal Healthcare Without the NHS (2016)
9
Source: OECD Stats (2016)
10
Source: Eurostat, Amenable and preventable deaths statistics (2015)
11
Source: Björnberg, A. (2015) Euro Health Consumer Index 2014 Report. Health Consumer Powerhouse.
12
ECHI scores are based on patient associations’ assessment of how likely it is that a representative patient will wait for
longer than a specified reference period. These measurements therefore give too much weight to arbitrary cut-off
points, and responses may also be skewed by factors such as ‘availability bias’.
6Table 1 presents results for GP appointments and A&E visits. England, together with Sweden and Lithuania,
scores red on both counts, meaning that A&E waiting times normally exceed three hours, and that securing a
same-day appointment with a GP is difficult.
The Commonwealth Fund
The only exception in the general consensus on NHS performance is the Commonwealth Fund study, which
in 2014 and 2017 ranked the UK as having the best healthcare system in the world. As a result, admirers of
the NHS routinely cite the study in its favour. However, the CF study’s ‘outlier’ status is explained by the
metrics it chooses to focus on, since it is not primarily, or even secondarily, a study of health outcomes. In
fact, just one of its categories relates to outcomes, and looking at that category in isolation (2014 study)
yields a familiar pattern. France, Sweden, Switzerland, Australia, and the Netherlands make up the top five,
and the UK comes out second to last – a fact inadvertently captured in media coverage of the study. As the
Guardian noted at the time, ‘The [report’s] only serious black mark against the NHS was its poor record on
keeping people alive’.13
Spending and efficiency
When defenders of the NHS acknowledge the existence of a gap in health system outcomes between the UK
and other countries at all, they tend to blame it on underfunding. Yet though the UK spends less on
healthcare than many other developed countries, this should not be mistaken for a sign of superior
efficiency. It is mostly the result of crude rationing: innovative medicines and therapies that are routinely
available in other high-income countries are often hard to come by in the UK. In more sophisticated
estimates of health system efficiency, the NHS ranks, once again, in the bottom third.14 A 2010 report by the
National Audit Office found that as funding for the NHS has increased, productivity has decreased.15
13
https://www.theguardian.com/society/2014/jun/17/nhs-health
14
Joumard, I., André, C. and Nicq, C. (2010) Health care systems: efficiency and institutions. OECD Economics
Department Working Papers 769. Paris: OECD.
15
https://www.nao.org.uk/report/management-of-nhs-hospital-productivity/
7Total healthcare spending in the UK is between one and two percentage points lower than in other north
western European countries. The gap in public healthcare spending, however, is considerably narrower than
this. Part of this gap represents voluntary additional spending, since most other systems, especially
insurance-based systems, make it easier to top up or upgrade statutory healthcare privately. However,
patients cannot easily supplement NHS care privately. Though there is no longer an absolute ban on top-ups,
they are heavily discouraged, and often not possible at all.16
Since the NHS is provided free at the point of use and from taxpayers, there is little pressure for harnessing
technological innovations for cost-cutting, which is why cost-inflating innovations dominate. The NHS has
also been slow to digitise. One recent review found that “the digital revolution has largely bypassed the NHS,
which in 2017, still retains the dubious title of being the world’s largest purchaser of fax machines.” 17
Centralisation also means patients are often treated homogenously, rather than as individuals with varying
wants and needs, further impeding innovation and the use of new technologies.
The case for Social Health Insurance systems
Social insurance systems work, in principle, like conventional private insurance. Individuals pay regular
contributions to a health insurer of their choice, seek treatment from a medical provider of their choice
when they fall ill, and their insurer then reimburses the provider for the expenses incurred. Here, healthcare
access does not hinge on ability to pay, nor are the unhealthiest priced-out through sky-high premiums. Risk-
structure compensation schemes redistribute from insurers with a high proportion of ‘good risks’ to those
with a high proportion of ‘bad risks’, which makes ‘cherry-picking’ of healthier clients economically unviable.
Low-income earners also receive top-ups from government to help them pay their health insurance
premiums. Like the NHS, SHI schemes offer universal coverage, redistributing from the healthy to the sick,
and from the rich to the poor.
SHI systems consistently outperform the NHS on measures of health outcomes and quality. Not only do they
outperform the NHS in terms of these outcomes, they also achieve more equitable outcomes, proving that
the extensive use of market mechanisms does not have to conflict with the aim of reducing health
inequalities. According to reasonable indicators of equity, the performance of the NHS is about average
amongst developed countries; the performance of SHI systems is amongst the best in the world. Their
structure also overcomes transparency issues in the NHS, where it is difficult for taxpayers to make well-
informed judgements about value for money, because they have no knowledge of the amount being paid,
nor any ability to vary it.
Demographic challenges
The NHS is poorly prepared to deal with the financial challenges of an ageing society. This is because, like
virtually all health systems in the developed world, it is financed on a pay-as-you-go basis and healthcare
costs rise systematically with age. The ratio of people of retirement age to people of working age currently
stands at 28 to 100. This is forecast to rise to 47 to 100 by 2064. In the same period, the share of people
aged 85 and over is forecast to rise from 4 for every 100 people of working age to 13 per 100. The healthcare
costs of people over the age of 85 are more than five times as high as the healthcare costs of young and
middle-aged people. Increasing longevity and low birth rates therefore represent a pincer movement which
threatens the system’s financial viability.
16
See Department of Health: Guidance on NHS patients who wish to pay for additional private care (2009).
17
DeepMind Health Independent Review Panel Annual Report (2017) https://deepmind.com/blog/independent-
reviewers-annual-report-2017/
8The case for prefunding
As we have seen, the NHS’s general taxation funding model leaves it poorly prepared to cope with
demographic challenges. The alternative to this model would be a prefunded system that builds up old-age
reserves (comparable to pension funds) for people of working age, and then draws upon them when people
retire. In such a system, population ageing would be much less of a problem, because as the number of
elderly people grows, the reserves accumulated in the old-age funds would grow alongside.
Prefunding has a number of theoretical advantages. Old-age funds would earn a rate of return. The rate of
savings and investment would increase, which would, in turn, increase the economy’s capital stock, its
productivity and, indirectly, wage levels. A prefunded system would also have a more diversified funding
base, which would decrease the risk of sudden, erratic changes in healthcare spending. Perhaps most
importantly, it would improve the quality of decision-making. In a prefunded system, decisions about future
spending would be felt today, because we would have to start building up the reserves today. This means
that even a short-sighted government could be forced to act as if they were far-sighted.
Examples of prefunded healthcare are rare, but they do exist. Private health insurance in Germany, which
covers about 8.8m people, is prefunded. Private insurers have accumulated over €170 billion in old-age
reserves on behalf of their members, equivalent to around €20,000 per policyholder. Annual additions to the
old-age reserve funds account for about 5 per cent of Germany’s net savings rate18. Had the NHS been set up
along the same lines, and had it built up the same amount of capital reserves per person, it could now have
an old-age reserve fund of over £900 billion at its disposal.19
Market-based reform
2002 onwards saw a re-emergence of market mechanisms in the NHS, following attempts to create an
‘internal market’ in the 1990s. A new payment system was gradually introduced, patients were given choice
of provider at the point of referral, and providers were given greater autonomy. There were also efforts to
strengthen the role of commissioners and make greater use of private capital in the building and
maintenance of new healthcare facilities. Empirical evidence from this ‘quasi-market’ reform period is
overwhelmingly positive, and these reforms should be built upon to improve patient choice, strengthen the
self-governance of providers and enshrine the principle that money follows the patient.20
Conclusion
The market reforms of the mid-2000s have brought the NHS closer to a Social Health Insurance system, and
these reforms have improved outcomes. Building on those reforms would improve outcomes further, but
moving all the way towards an SHI system would be even better. Moreover, introducing pre-funding to the
system would put the healthcare system on a much more stable financial footing. But for any of these
reforms to be politically possible, “NHS myopia” must end. It is time we examined the many successful
pluralistic models of healthcare on the continent and further afield and applied some of these principles to
our national health service. Though Britain may be leaving the EU, it’s clear that Europe still has much to
teach us when it comes to healthcare provision.
18
See Schönfelder and Wild (2013)
19
This is a crude back-of-the-envelope figure, only meant to give an idea of the order of magnitude. In reality, even if
this hypothetical prefunded NHS used the exact same actuarial calculations as Germany’s private insurers, it would lead
to different results, because demographic details, healthcare costs and other variables differ between the countries.
But for the sake of the argument, if the NHS had built up old-age reserves averaging £15,000 per person, then for a UK
population of 64.6 million, this would work out at £969 billion.
20
For more on quasi-market reforms, see Niemietz, Universal Healthcare Without the NHS, (2016)
9You can also read