Scientific update on COVID-19 - EPIDEMIOLOGY - Updated on December 21th 2020 - REACTing Research & Action | emerging ...
←
→
Page content transcription
If your browser does not render page correctly, please read the page content below
EPIDEMIOLOGY
https://www.coreb.infectiologie.com/                                    https://reacting.inserm.fr/

                                       Scientific update
                                         on COVID-19

                                        Updated on December 21th 2020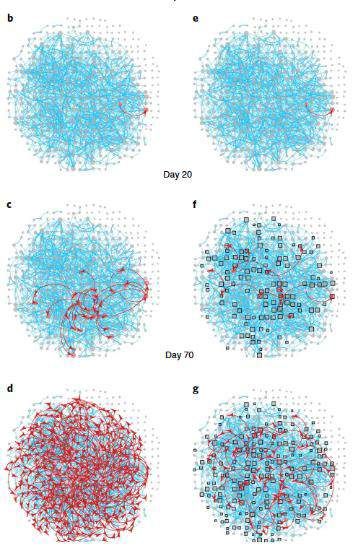
2
Redaction committee
Boris Lacarra – Inserm, REACTing
F-Xavier Lescure – Inserm, AP-HP Bichat, COREB
Guillaume Mellon – AP-HP Bichat, COREB
Inmaculada Ortega Perez – Inserm, REACTing
Eric D’Ortenzio – Inserm, REACTing

Reviewing committee
Jean-Marc Chapplain – CHU Rennes, COREB          Jean-Christophe Lucet – Inserm, AP-HP Bichat
Flavie Chatel – COREB                            Claire Madelaine – Inserm, REACTing
Hélène Coignard – HCL, COREB                     Matthieu Mahevas – Inserm, AP-HP Henri-Mondor
Dominique Costagliola – Inserm, REACTing         Emmanuelle Vidal Petiot – Inserm, AP-HP Bichat
Marie-Paule Kieny – Inserm, REACTing             Benoit Visseaux – Inserm, AP-HP Bichat
Quentin Le Hingrat – Inserm, AP-HP Bichat
3
EPIDEMIOLOGY

 Questions:
 - What is the situation in the World?
 - What is the incubation period & R0?
 - What is the impact of non-pharmaceutical intervention on R?
 - What do we know about the risk of transmission & the mode of transmission?
 - What is the impact of the different measures taken by countries?
4
Situation update
• Santé publique France: https://www.santepubliquefrance.fr/maladies-et-traumatismes/maladies-et-infections-respiratoires/infection-a-
coronavirus/articles/infection-au-nouveau-coronavirus-sars-cov-2-covid-19-france-et-monde
• Johns Hopkins University: https://reliefweb.int/report/world/coronavirus-covid-19-global-cases-johns-hopkins-csse
• OMS: https://www.who.int/emergencies/diseases/novel-coronavirus-2019/situation-reports/
• ECDC : https://www.ecdc.europa.eu/en/geographical-distribution-2019-ncov-cases
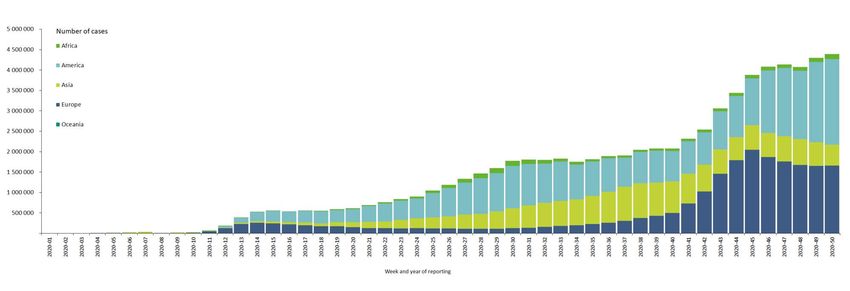
ECDC: distribution of cases of COVID-19, by continent, December 21th 2020
Week and year of reporting
Daily documented cases – simulation generated using some parameters        5
       Epidemiology                                                    µ=factor applied to transmission rate due to undocumented infected persons

• Person to person transmission
• Contagious 2 days before symptoms : pre-symptomatic phase

                                                                          • Very high rate of undocumented infection
                                                                          • Dissemination by undocumented infection (asymptomatic,
                                                                            presymptomatic…)

                                                           •   He and colleagues estimation (slide 35): 44% (CI95% [30 – 57%]) of
                                                               secondary cases were infected during the index cases’ presymptomatic
                                                               stage
       Chronology of symptom onset of the family cluster   Infectiousness was estimated to decline quickly within 7 days

                 Chan JF et al. Lancet. Feb 2020           He X et al. Nat Med. May 2020               Li R et al Science. May 2020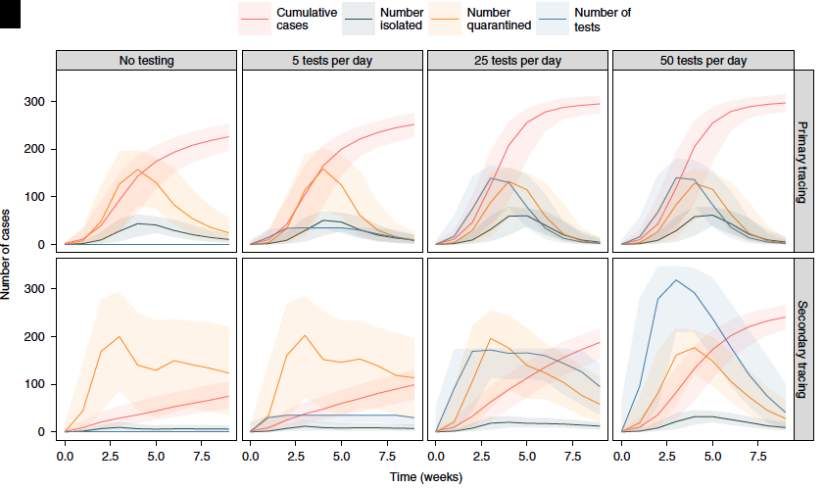
6
  Epidemiology
At beginning & before controls measures:
                                                                                                 • Incubation period SARS-CoV-2
• Basic reproduction number (R0): 2,2 to 6,4
                                                                                                      o Median: 5 days
• R0 depends on                                                                                       o 2 to 14 days
     o Geographic location
     o Stage of outbreak
• Re depends on
     o Control measures
• Doubling time : 2,9 to 7,3 days                             Travel restrictions

                          Estimated Rt over time

            Rt: median daily reproduction number       Re: estimated daily reproduction number

            Kucharski AJ et al. Lancet Infect Dis. Mar 2020                                                    Li Q et al. NEJM. Mar 2020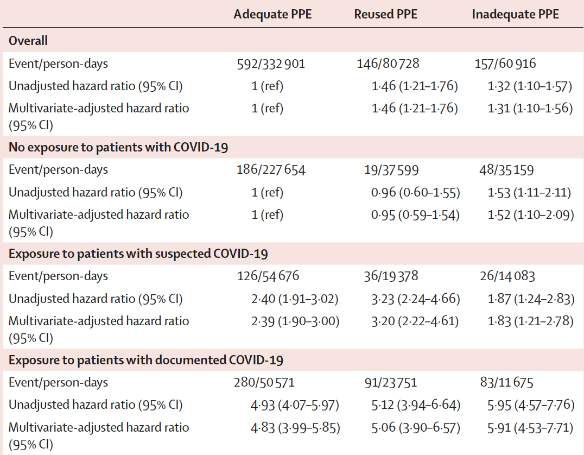
7
Epidemiology • After 14 d we would not miss a symptomatic
infection among high risk persons
• 185 cases of confirmed COVID-19 – before Feb 24th
• 24 countries – 89% had recent history of travel to Wuhan
• Median incubation period (days) : 5,1 [4,5 – 5,8]
o < 2,5% of infected persons will shows symptoms within 2,2
days
o 97.5% of symptomatic patients developing symptoms within
11.5 days
• Analysis specific for cases detected outside of China
o Median incubation (days): 5,5 [4,4 – 7,0] Proportion of known symptomatic SARS-CoV-2 infections that have yet to
o 95% range spanning from 2,1 to 14,7 days develop symptoms by number of days since infection, using bootstrapped
• High risk = A 1-in-100 chances of developing a
symptomatic infection after exposure
Lauer SA et al. Ann Intern Med. May 2020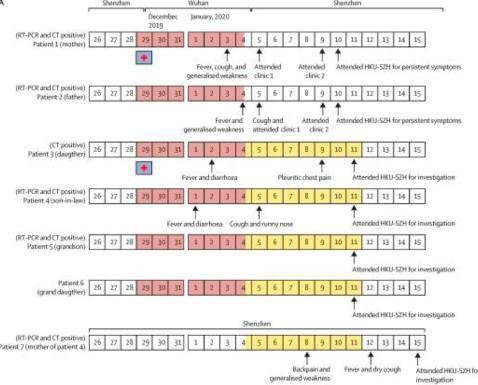
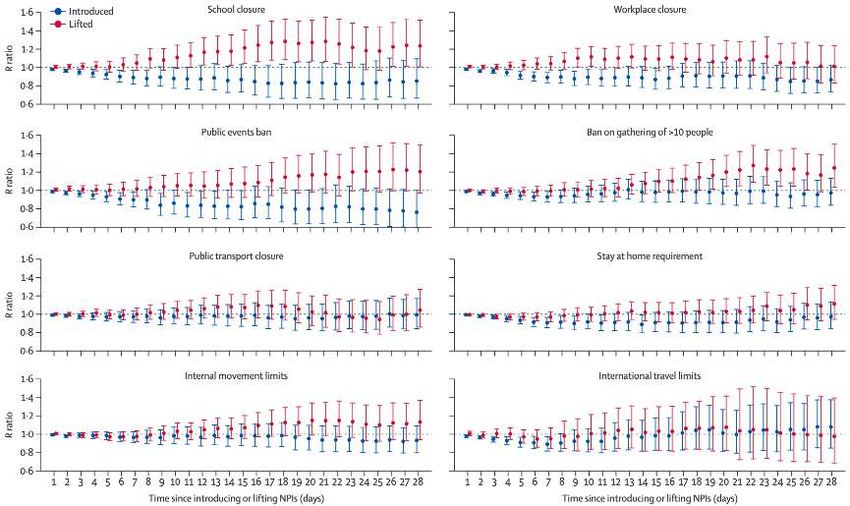
Non pharmaceutical interventions and R                                                                                             8

Temporal association between introducing and lifting non-pharmaceutical interventions (NPIs) and levels of SARS-CoV-2 transmission (R) ?

  Modelling study – data from 131 countries:
  • On country-level estimate R from the EpiForecast project                790 phases from 131 countries
  • On country-specific policies on NPIs from the OxCGRT                    - Median duration of phase 11 days
  Jan 1 to July 20, 2020
                                                                            The NPIs
  Definitions:                                                              - Stay at home and restriction on internal movements were
  • Phase: a time period when all of the eight NPIs remained the               the most common,
    same                                                                    - Closure schools and public events ban were the two first
                                                                               NPIs introduced,
  • Rdayi as the R of the ith day of that phase (ie, since the NPI status   - Stay at home and closure of public transport were the two
    changed) and defined Rday0 as the R of the last day of its previous
                                                                               last NPIs introduced.
    phase
  • R ratio between Rdayi and Rday0 as a measure of the degree of           Decreasing trend over time in R ratio was found in the first
    association of introducing and lifting an NPI with the transmission     14 days after introducing NPIs
    of SARS-CoV-2
  • Modelled the R ratio using a log-linear regression

                                                                                              Li Y et al. Lancet Infect Dis. Oct 2020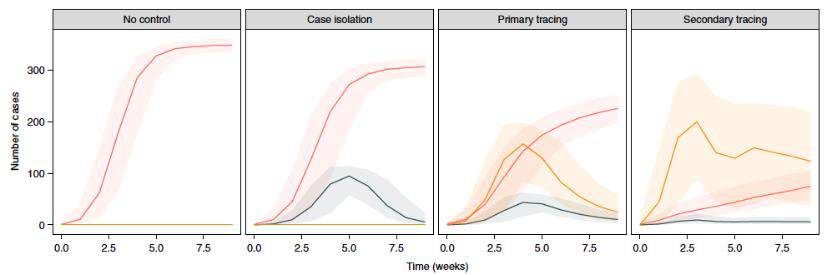
Non pharmaceutical interventions and R                                                                                               9

                                                  Change over time in the R ratio following the introduction and relaxation of individual NPIs

Greatest increase in R ratio:
• Relaxation of school closure:
- On day 7 1,05 (CI95%: 0,96–1,14)
- On day 14 1,18 (CI95%: 1,02–1,36)
• Relaxation of a ban on gatherings of >10
- On day 28 1,25 (CI95%: 1,03–1,51)
Time in days needed to reach 60% of its
maximum effect:
- Median of 8          days     following   the
  indroduction
- Median of       17   days      following its
  relaxation

             Greatest reduction in R:

                                                                                        Li Y et al. Lancet Infect Dis. Oct 2020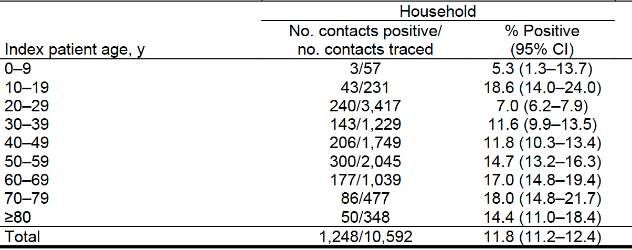
Non pharmaceutical interventions and R 10
Introducing NPIs were associated with reductions in R of 3–24% on day 28 after their introduction
Lifting NPIs were associated with increases in R of 11-25% on day 28 after their relaxation
Effects not immediate & time required to reach certain levels of effect differed by NPI
Several limits:
• Base on control policy rather than on actual population behavior use of personal hygiene / behavioral change
• Compliance with these NPIs was not examine
• Data on national levels only vary among different parts of a country
• Heterogeneity across different countries findings no sensitive to the removal of different lists of countries
• Not consider the role of underlying seasonality or meteorological factors
• The R estimate was subject to the specification of parameters
• Change over time in contact/tracing or testing or case definition
• Innate limitation of R as measure of transmission
Autors: “The decisions to reintroduce and relax restrictions should be informed by various factors,
including the capacity and resilience of the health-care system, and might be best made at provincial
or district rather than national levels”
Li Y et al. Lancet Infect Dis. Oct 202011
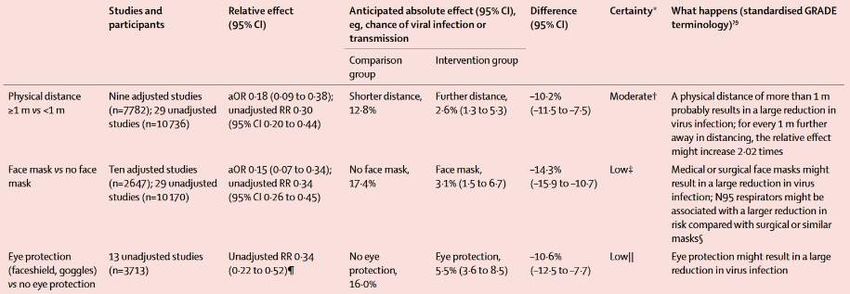
Distanciation measures to prevent transmission
The effects of physical distance, face masks, and eye protection on virus transmission?
Systematic revue (172 studies) & meta-analysis (44 comparatives studies)
16 countries & 6 continents
25 697 patients in the meta-analysis
Included COVID-19, SARS & MERS
Did not identify any randomized trials
Unadjusted, adjusted, frequentist,
and Bayesian meta-analyses all
supported the main findings,
Population comprised people possibly exposed to individuals infected with SARS-CoV2, SARS-CoV or MERS-CoV
Physical distancing of 1 m or more lower transmission of viruses compared with a distance of less than 1 m
Protection was increased as distance was lengthened distance of 2 m might be more effective
The use of face mask reduction in risk of infection wearing face mask protects people
None of these interventions afforded complete protection from infection
when evaluated in isolation
Chu DK et al. Lancet. Jun 202012
Face masks’ effectiveness in respiratory viruses
• 246 participants
o 122 without face masks and 124 with face masks
o Provided exhaled breath samples
• 123 were infected by
o HCoV (17), influenza (43) and rhinovirus (54)
• Test viral shedding
o Nasal swab, throat swab
o Respiratory droplet sample
o Aerosol sample
• Detection of coronavirus
o 30% (droplets) and 40% (aerosol) without mask
Limits
o 0 %(droplet or aerosol) with mask
• Human coronavirus, not SARS-CoV-2
Aerosol transmission is possible
• Large proportion of undetectable viral shedding
Face masks reduce coronavirus detection in aerosol (significantly) and
respiratory droplet • Detected Coronavirus' infectivity not confirmed
Face masks could prevent transmission of human coronaviruses and
influenza viruses.
Leung NHL et al. Nature Med. May 202013
Face masks’ effectiveness in COVID-19
Event study that examined the effect over different period Estimates of the effects of states mandating community face mask use in
public on the daily county-level growth rate of COVID-19 cases, 2020
• state executive orders or directives signed by governors that
mandate use
• Fifteen states + Washington D.C.
• March 31 and May 22, 2020
Estimated the effects of face cover mandates on the daily county-
level COVID-19 growth rate,
Significant decline in daily COVID-19 growth rate after the
mandating of face covers in public
• Increasing over time after the orders were signed
No evidence of declines in daily COVID-19 growth rates with
employee-only mandates
Limits:
- Unable to measure the compliance with the mandate
- Examine only confirmed COVID-19 cases
- Other existing social distancing measures
Lyu W et al. Health Affairs. Jun 202014
Projection - Transmission dynamics
Invasion scenario for SARS-CoV-2 in temperate regions
Model of SARS-CoV-2 transmission
Projected that recurrent wintertime outbreaks will probably occur
after the initial outbreak
Used estimates of seasonality, immunity and cross-immunity for beta
coronaviruses (OC43 & HKU1)
Post-pandemic transmission dynamics will depend on:
o Degree of season variation in transmission
o Duration of immunity
o Degree of cross-immunity between SARS-CoV-2 and other A: Short duration of immunity annual outbreak
coronaviruses
o Intensity and timing of control measures
Presentation of different scenarios
B: Long-term immunity elimination of the virus
Kissler SM et al. Science. Apr 202015
Projection - Transmission dynamics
Invasion scenario for SARS-CoV-2 in temperate regions
C: Longer-term immunity biennial outbreaks D: Higher seasonal variation in transmission reduce the peak
Possibly with smaller outbreak size of the invasion wave
BUT more severe wintertime outbreaks thereafter compare with C
Total incidence of COVID-19 illness over next years will depend on
• Regular circulation after the initial pandemic wave
• Duration of immunity that SARS-CoV-2 infection imparts
• Social distancing strategies
• Effective therapeutic
Kissler SM et al. Science. Apr 202016
Community and close contact exposures
Adjusted odds ratio (aOR) and 95% confidence intervals for community exposures
Comparison between (random sampling 1:2):
• Exposure reported by case-patients: adults with laboratory
confirmed COVID-19 (= 154)
• Exposure reported by control-participants (= 160)
All were symptomatic
Identified and contact 14-23 days after results of SARS CoV2
testing.
Interview by telephone:
• Mask-wearing behavior, community activities17
Community and close contact exposures
Most close contact exposures were to family members
Continued assessment of various types of activities and exposures as communities, schools, and
workplaces reopen is important
Efforts to reduce possible exposures at location that offer on-site eating and drinking options should be
considered
Limits:
• Ratio 1:2 could not be reached unmatched analysis was performed
• Interview on behaviors one month before memorization bias
• Participants were aware of their SARS-CoV-2 test results could influence their responses
• At restaurant: not distinguish between outdoor and indoor
• In coffee shop/bar: not distinguish between venues or service delivery method
• Distanciation measures could not be accounted for restaurant & bar extrapolate to other countries?
• No explanation about the result difference between dining at restaurant and going to coffee/bar in the full
analysis?
Fisher KA et al. MMWR. Sep 202018 COVID-19 & social and leisure activities Description study of the outbreak in Spain Transmission declined in early May 2020 Cases' number increased during June and mild July: • Mild June up to August 2nd: 673 COVID-19 outbreak = 8300 persons • 76% were small outbreak (
19
Infectiousness of children
A nationwide COVID-19 contact tracing program in South Korea
Index patient were eligible if they identified > 1 contact.
Compared the difference in detected cases between household and
nonhousehold contacts across the stratified age groups.
59 073 contacts of 5 706 COVID-19 index patients: Rates of coronavirus disease among household
• 10 592 household contacts 11,8% (CI95% [11,2% - 12,4%]) had COVID-19
• with an index patient 10–19 years, 18.6% (CI95% [14.0%–24.0%]) of
contacts had COVID-19
• 48 481 nonhousehold contacts 1,9% (CI95% [1,8% - 2,0%]) had COVID-19
Limits:
• Underestimation of the number of cases,
• Exposure outside the household,
Higher secondary attack rate among household than non household contacts
• Difference of testing policy between household
Highest COVID-19 rate for household contacts of school-aged children (10-19y)
and nonhousehold contacts,
Transmission potential in both children and adolescents,
Possibly more effective transmission in adolescents than in adults.
Park YJ. Emerg Infect Dis. Oct 2020Risk of COVID-19: health-care workers & 20
general community
Prospective – observational cohort study (UK & USA)
Recorded 5 545 positive COVID-19 test over 34 435 272 person-days
Data from the COVID Symptom Study smartphone
Testing ratio (health care workers vs general community):
application:
UK: ratio 5,5 [1,1 % vs 0,2%]
• Baseline demographic info
USA: ratio 3,7 [4,1% vs 1,1%]
• Daily info on symptoms
• COVID-19 testing
2 135 190 participants, whom 99 795 front-line health-care
workers
Primary outcome: positive COVID-19 test (self report)
Front-line health-care workers positive test risk increased 12 fold (HRa: 11,61).
The difference is not related to testing eligibility
(HR model with inverse probability weighting for predictors of testing)
Compared with the general community, health-care workers initially free of
symptoms had an increase risk of predicted COVID-19 (HRa: 2,05) which was
higher in the UK than in the USA (2,09 vs 1,31; pRisk of COVID-19: health-care workers & 21
general community Health-care workers with inadequate or reused PPE had an
POST-HOC ANALYSIS increased risk for COVID-19 after multivariable adjustment
Sufficient availability of PPE, quality of PPE, or both reduce
the risk of COVID-19.
PPE reuse self-contamination during repeated
application
Increased risk for SARS-CoV-2 infection among health-
care workers compared with the general community.
Adequate allocation of PPE is important
Need to ensure proper use of PPE and adherence to other
infection control measures.
Limits:
• Details for some exposures were shortened (eg, type of PPE)
• Self-report (risk factor & primary outcome)
• Selection bias (not a random sampling)
PPE= Personal Protective Equipment Nguyen LH et al. Lancet Public Health. Jul 202022
Real-world network – COVID-19 control strategies
• Non-pharmaceutical interventions are central to reducing SARS-
CoV-2 transmission
• Epidemic model that simulates COVID-19 outbreaks across a
real-work network
o Assess the impact of a range of testing and contact tracing
strategies
o Simulate physical distancing strategies
o Quantify interaction among physical distancing, contact
tracing & testing affects outbreak dynamics
• Uses a publicly dataset on human social interactions
Illustration of the Haslemere network with epidemic simulation predictions.
b–d: Progression of the COVID-19 epidemic under the no-intervention
e-g: under secondary contact tracing scenarios.
Firth JA et al. Nature Med. Aug 202023
Real-world network – COVID-19 control strategies
• From a single infected individual:
o Uncontrolled outbreak: 75% of the population infected 70 days after the first simulated infection
o Case isolation: 66% of the population infected
o Primary tracing: 48% infected Very high proportion of quarantined individuals
o Secondary contact tracing: 16% infected after 70 days
Epidemic model predictions of outbreak size & number of people isolated or quarantined
Cumulative number of cases, number of people isolated and number of people quarantined
Firth JA et al. Nature Med. Aug 202024
Real-world network – COVID-19 control strategies
• Increasing the testing capacity
increases in outbreak size, especially
under secondary contact tracing
• Number of quarantined individuals can
be reduced through mass testing
Contact tracing & quarantine strategy:
Might be more effective than « local
lockdown » strategy when contact rates
are high
Would be most efficient when
combined with other control measures
such as physical distancing
Epidemic model predictions of how testing affect outbreak and qurantine dynamics
Firth JA et al. Nature Med. Aug 202025
Testing strategies for COVID-19 control
• Mathematical model of SARS-CoV-2 transmission based on:
o Infectiousness: proportion of infection that are
asymptomatic and their infectiousness
o PCR test sensitivity over time since infection
• Evaluate
o The impact of self-isolation following either a positive test
result or symptom onset
o The impact of quarantine of contacts of laboratory
confirmed cases
• Percentage of reduction in R = expected effectiveness of
different testing strategies
• Based on literature: 33% of infections are asymptomatic which
have a relative infectiousness off about 50%
• If self-isolation was 100% effective + all individuals with
symptoms compatible with COVID-19 self-isolated reduction
in R of 47%; CI95% [32 – 55]
• Play an important role in prevention of SARS-CoV-2 Percentage of reduction in R by self-isolation following onset of
transmission symptoms as a function of the proportion of infections that are
asymptomatic
• No single strategy will reduce R below 1
Grassly N C et al. Lancet Infect Dis. Aug 202026
Testing strategies for COVID-19 control
• Self-isolation following onset symptoms of COVID-19: • PCR testing of symptomatic individuals reduces the number of
reduction of their contribution to SARS-CoV-2 individuals needing self-isolate BUT would reduce the effectiveness
transmission of self-isolation ( false negative)
• Regular PCR testing, irrespective of symptoms, could reduce
transmission
o Depends on the frequency of testing – timeliness of results –
sensitivity of the test
Additional percentage reduction in
the R by a policy of repeated PCR
testing
Detection of presymptomatic SARS-CoV-2 infection and
subsequent reduction in transmission through self-isolation
after a positive PCR test
Grassly N C et al. Lancet Infect Dis. Aug 202027
Testing strategies for COVID-19 control
• Test-and-trace strategy: Isolating the contact of symptomatic • Test-trace-test strategy: testing contact & only those who
SARS-CoV-2 positive individuals tested positive put into isolation
o Dependent on: o Effectiveness is lower than a test-trace strategy
Proportion of symptomatic who are tested o High probability of false negative
Success of tracing their contact
Timeless of obtaining test results & identifying &
quarantine them
Test-and-trace Test-trace-test
strategies strategies
Grassly N C et al. Lancet Infect Dis. Aug 202028
Impact of COVID-19 pandemic response - Nepal
Prospective – observational study in 9 health institutions in Nepal
Data over a period of 5 months: 12,5 weeks before lockdown and 9,5 weeks during lockdown
Women > 22 weeks of gestations + fetal heart sound was heard at the time of admission : 21 763 enrolled & 20 354 gave birth in the
hospital
Institutional birth:
• Substantial decrease – especially after
week 12,5
• Reduction during lockdown was 7,4%
• Total decrease of 52,4% by the end of
lockdown
Weekly institutional births for the first 22 weeks of 2019 & 2020
Ashish KC et al. Lancet Glob Health. Aug 202029
Impact of COVID-19 pandemic response - Nepal
Before lockdown During lockdown P value
Institutional stillbirth (per 1000 total births) 14 21 0,0002
Intitutional neonatal mortality (per 1000 livebirths) 13 40 0,0022
Intrapartum fetal heart rate monitoring (%) 56,8 43,430
Effect of the first wave on all-cause mortality
Knowledge of the total effect on mortality is needed: Countries: From Europe and the Pacific
• The true public health effect of the pandemic • Total population in 2020 > 4 million
• The policy response • Up-to-date weekly data on all-cause mortality through May 2020
• Time series of data went back at least to 2015
Application of 16 Bayesian models to vital statistics
data to estimate the all-cause mortality effect of the
pandemic for 21 industrialized countries Weekly number of death from any cause from January 2020 through May 2020
Men Women
Deaths in all countries started to diverge
to higher levels in March
(e.g. in 4 countries)
From mild-February through en of May
2020, an estimated 206,000 more people
died in these 21 countries than would
have been expected had the pandemic
not occurred
The turquoise-shaded areas show the predictions of how many deaths would have been expected from mid-
February had the COVID-19 pandemic not occurred
Kontis V et al. Nature Med. Oct 202031
Effect of the first wave on all-cause mortality
Posterior probability = the inherent uncertainty in how many deaths would have
occurred in the absence of the pandemic
The largest rise in mortality was most likely to be in England & Wales followed by
Spain and Italy.
For the 21 countries:
- The number of excess deaths from all-causes was 23% (7–38%) higher than the
number of deaths assigned to COVID-19 as underlying cause of death.
- The difference between all-cause excess and COVID-19 deaths was largest in
Spain and Italy.
- The number of excess deaths for all causes, excess deaths per 100,000 people
and relative increase in deaths were similar between men and women in most
countries.
4 groups:
- (1): Countries that have avoided a detectable rise Posterior distribution of excess deaths from any cause
- (2-3): Countries which experienced a low-to-medium per 100,000 people from mid-February to the end of
effect of the pandemic on overall deaths May 2020. Gold dots in the top panels show the
- (4): Countries which experienced the highest mortality toll posterior medians.
(Belgium, Italy, Scotland, Spain and England and Wales)
Kontis V et al. Nature Med. Oct 202032
Effect of the first wave on all-cause mortality
Death returned to levels that would expected without
the pandemic in April (e.g. France & Spain).
But remained above the levels expected in others (e.g.
UK & Sweden)
Limits:
- No data on underlying cause of death
- Not access data for several other countries
- No data on total mortality by socio-demographic Weekly percent increase in mortality from any cause as a result of the COVID-19 pandemic by
status country. The turquoise shading shows the credible intervals around the median prediction.
- No explanation for the observed difference among
countries
- Difference between health care system comparaison ?
The heterogeneous mortality effects of the COVID-19 pandemic reflect differences in how well countries
have managed the pandemic and the resilience and preparedness of the health and social care system.
Kontis V et al. Nature Med. Oct 202033
EPIDEMIOLOGY (December the 21th 2020)
1. What is the situation in the World?
- More than 30 millions of confirmed cases in the World and 1 million global deaths
2. What is the incubation period & R0?
- The median incubation period is 5 days with an initial basic reproductive number between 2 to 6 before control measures
- Presymptomatic transmission: 44% - Infectiousness decline quickly within 7 days.
3. What is the impact of non-pharmaceutical intervention on R?
- Introducing and lifting NPIs were associated with reductions and increases of R, respectively, with no immediate effect
4. What do we know about the risk of transmission & the mode of transmission?
- Person to person transmission – transmission seems to be more effective in adolescents than in adults
- Route of transmission: droplet, direct contact, plausible aerosol
- Increased risk for SARS-CoV-2 infection among health-care workers compared with the general community.
- Most close contact exposures were to private or public gathering
5. What is the impact of the different measures taken by countries?
- Face masks reduce the transmission of respiratory viruses and probably of SARS-CoV-2
- Pandemic lockdown can have an important impact on the access to the health system in some countries
- The number of excess deaths from all-causes was 23% (7–38%) higher than the number of deaths assigned to COVID-19
- Reflect differences in the resilience and preparedness of the health and social care systemContacts Pr F-Xavier Lescure Dr Eric D’Ortenzio xavier.lescure@aphp.fr eric.dortenzio@inserm.fr
You can also read