COVID-19: The CIDRAP Viewpoint
←
→
Page content transcription
If your browser does not render page correctly, please read the page content below
COVID-19: The CIDRAP Viewpoint
                                                April 30th, 2020

        Part 1: The Future of the COVID-19 Pandemic: Lessons Learned from Pandemic Influenza
                                      Kristine A. Moore, MD, MPH
                                          Marc Lipsitch, DPhil
                                           John M. Barry, MA
                                    Michael T. Osterholm, PhD, MPH

Dr. Moore is medical director of the Center for Infectious Disease Research and Policy (CIDRAP). Dr. Lipsitch is
the director of the Center for Communicable Disease Dynamics, Department of Epidemiology, Harvard TH Chan
School of Public Health. John Barry is a professor at Tulane University School of Public Health and Tropical
Medicine. Dr. Osterholm is director of CIDRAP, University of Minnesota Regents Professor, and McKnight
Presidential Endowed Chair in Public Health.

CIDRAP, founded in 2001, is a global leader in addressing public health preparedness and emerging infectious
disease response. Part of the Office of the Vice President for Research (OVPR) at the University of Minnesota,
CIDRAP works to prevent illness and death from targeted infectious disease threats through research and the
translation of scientific information into real-world, practical applications, policies, and solutions. For more
information, visit: www.cidrap.umn.edu.

COVID-19 Viewpoint reports are made possible with support from the University of Minnesota OVPR and the
Bentson Foundation.

                             COVID-19: The CIDRAP Viewpoint working group:
                              Michael T. Osterholm, PhD, MPH, CIDRAP director
                            Kristine A. Moore, MD, MPH, CIDRAP medical director
                               Julie Ostrowsky, MSc, CIDRAP research associate
                            James Seifert, JD, MS, MPH, CIDRAP program manager
                             Angela Ulrich, PhD, MPH, CIDRAP research associate
                             Alison Kraigsley, PhD, MS, CIDRAP research associate
                                  Maya Peters, MPH, CIDRAP program analyst
                                     Jim Wappes, CIDRAP editorial director

              Editing: Jim Wappes; Report Layout and Design, Cover Design: Hannah Winesburg
                      © 2020 Regents of the University of Minnesota. All rights reserved.

                                                                                                                   1
Part 1: The Future of the COVID-19 Pandemic: Lessons from
Pandemic Influenza
Preface
Welcome to “COVID-19: The CIDRAP Viewpoint.” We appreciate that other expert groups have produced
detailed plans for mitigating SARS-CoV-2 transmission and for reopening the country after stay-at-home orders
and other important mitigation steps are eased. Our intent with the Viewpoint is to add key information and
address issues that haven’t garnered the attention they deserve and reflect the unique experience and expertise
among the CIDRAP team and our expert consultants. We will address timely issues with straight talk and clarity.
And the steps we will recommend will be based on our current reality and the best available data. Our goal is
to help planners envision some of the situations that might present themselves later this year or next year so that
they can take key steps now, while there’s still time.
“COVID-19: The CIDRAP Viewpoint” will address such topics as pandemic scenarios going forward, crisis
communication, testing, contact tracing, surveillance, supply chains, and epidemiology issues and key areas for
research. We will release approximately one to two reports per week.
Our hope is that our effort can help you plan more effectively and understand the many aspects of this pandemic
more clearly—and for you and your family, friends, and colleagues to be safer. Thank you.
– Michael T. Osterholm, PhD, MPH, CIDRAP Director
Introduction
When severe acute respiratory syndrome coronavirus-2 (SARS-CoV-2)—the virus that causes COVID-19—first
emerged in Wuhan, China, in December 2019, even the most experienced international public health experts did
not anticipate that it would rapidly spread to create the worst global public health crisis in over 100 years. By
January 2020, a few public health officials began sounding the alarm, but it wasn’t until March 11, 2020, that the
World Health Organization declared a global pandemic.
The virus caught the global community off guard, and its future course is still highly unpredictable; there is
no crystal ball to tell us what the future holds and what the “end game” for controlling this pandemic will be.
The epidemiology of other serious coronaviruses (SARS-CoV-1, the virus that causes severe acute respiratory
syndrome [SARS] and Middle East respiratory syndrome coronavirus [MERS-CoV]) is substantially different
from that of SARS-CoV-2; therefore, these pathogens do not provide useful models for predicting what to expect
with this pandemic.
Alternatively, our best comparative model is pandemic influenza. Since the early 1700s, at least eight global
influenza pandemics have occurred, and four of these occurred since 1900—in 1918-19, 1957, 1968, and 2009-
10. We can potentially learn from past influenza pandemics as we attempt to determine a vision for the future
of the COVID-19 pandemic. Identifying key similarities and differences in the epidemiology of COVID-19 and
pandemic influenza can help envisioning several possible scenarios for the course of the COVID-19 pandemic.
The primary focus of these scenarios is on the temperate Northern Hemisphere, but similar patterns could
occur in the Global South, as well. The lack of robust healthcare infrastructure (including a dearth of adequate
personal protective equipment) and comorbidities such as other infections (eg, HIV, TB, malaria), malnutrition,
2and chronic respiratory disease in certain areas of the Global South could result in the pandemic being even more
severe in those areas, as was noted during the 1918-19 pandemic (Murray 2006).
Epidemiologic Similarities, Pressing Issues
Differences Between Covid-19 and 1. Because of a longer incubation period,
Pandemic Influenza more asymptomatic spread, and a higher
Even though coronaviruses are very different from influenza R0, COVID-19 appears to spread more
viruses, the COVID-19 pandemic and pandemic influenza easily than flu.
share several important similarities. First, SARS-CoV-2 and a 2. A higher R0 means more people will need
pandemic influenza virus are novel viral pathogens to which to get infected and become immune
before the pandemic can end.
the global population has little to no pre-existing immunity,
thereby resulting in worldwide susceptibility. Second, SARS- 3. Based on the most recent flu pandemics,
CoV-2 and influenza viruses are predominantly spread this outbreak will likely last 18 to 24
months.
via the respiratory route by large droplets, but also with a
significant component of transmission by smaller aerosols. 4. It likely won’t be halted until 60% to 70%
of the population is immune.
Asymptomatic transmission occurs with both viruses as well,
thereby contributing to the spread of each. Finally, both types 5. Depending on control measures and
other factors, cases may come in waves
of viruses are capable of infecting millions of people and
of different heights (with high waves
moving rapidly around the globe.
signaling major impact) and in different
There are also important differences. The first is the intervals. We present 3 possibilities.
incubation period; the average incubation period for
influenza is 2 days (range, 1 to 4 days); whereas, the average incubation period for COVID-19 is 5 days (range,
2 to 14 days) (Lauer 2020). The longer incubation period for COVID-19 allowed the virus to move silently in
different populations before being detected (Kahn 2020, Li 2020). This contributed to an initial environment of
complacency before national governments became aware of the severity of the situation.
The second important factor is the asymptomatic fraction for the two infections. Although information is still
being collected to definitively define the asymptomatic fraction for COVID-19, public health officials have stated
that 25% of all cases may be asymptomatic (Rettner 2020) and better serologic studies may revise this percentage
upward. A number of studies have explored the asymptomatic fraction for influenza; one review found a pooled
mean for the asymptomatic fraction of 16% (range of 4% to 28%) (Leung 2015). Thus, while both viruses can
lead to asymptomatic infections, the asymptomatic fraction appears to be somewhat higher for COVID-19 than
for influenza.
Another consideration is the timeframe of presymptomatic viral shedding for people who fall ill. One recent
study found that the SARS-CoV-2 viral load was highest at the time of symptom onset, suggesting that viral
shedding may peak before symptoms occur, leading to substantial presymptomatic transmission (He 2020).
A point-prevalence study of SARS-CoV-2 in nursing home residents showed that, for 27 residents who were
asymptomatic at the time of testing, 24 developed symptoms a median of 4 days later (interquartile range, 3
to 5 days) (Arons 2020), supporting the potential for several days of presymptomatic shedding. For the H1N1
pandemic influenza A virus, one study showed that viral shedding peaks the first 1 to 2 days after symptom
3onset, suggesting there may be less presymptomatic shedding for pandemic influenza A compared with SARS-
CoV-2 (Ip 2016).
All of the above factors contribute to viral transmissibility.
One way to quantify the transmissibility of a virus is to
Recommendations
determine the basic reproductive number (R0) for that
virus. The R0 is the average number of new infections that 1. States, territories, and tribal health
result from a single infected person in a wholly susceptible authorities should plan for the worst-case
population (Delamater 2019). The R0 can vary by factors that scenario (Scenario 2), including no vaccine
availability or herd immunity.
influence the contact rate between people, such as physical
distancing strategies and lockdowns aimed at driving the 2. Government agencies and healthcare
delivery organizations should develop
R0 below 1. An R0 below 1 indicates that that an outbreak is
strategies to ensure adequate protection
shrinking rather than expanding, since each infected person
for healthcare workers when disease
is subsequently infecting less than 1 other person. While incidence surges.
the R0 is not influenced by herd immunity (which is the
3. Government officials should develop
proportion of the population that is immune to a virus), either concrete plans, including triggers for
generated by natural infection or by vaccination, immunity reinstituting mitigation measures, for
in the population can influence the effective reproductive dealing with disease peaks when they
number (RE), which is similar to the R0 but does not depend occur.
on having a fully susceptible population (Delamater 2019). 4. Risk communication messaging from
Immunity in the population can effectively diminish or end government officials should incorporate
an outbreak by driving RE below 1 (Fine 2011). the concept that this pandemic will not
be over soon and that people need
The R0 for SARS-CoV-2 during the early course of the
to be prepared for possible periodic
pandemic in China was estimated at 2.0 to 2.5 (Anderson resurgences of disease over the next 2
2020); however, the R0 for SARS-CoV-2 is difficult to years.
accurately determine in various geographic regions because
of challenges in identifying and testing infected persons, and one study has suggested that the value may be
considerably higher (Sanche 2020). Also, for SARS-CoV-2, the R0 is not the same for each person; it can change
based on natural variability in viral shedding by infected persons. Even the average value of R0 is not a purely
biological quantity—it depends on behavior and contacts. For example, some have speculated that the R0 for
SARS-CoV-2 may be higher in areas of denser population or more frequent contacts, such as large cities. In
addition, some evidence indicates that some people are “super-spreaders,” as was seen with MERS-CoV and
SARS (Frieden 2020, Wong 2015). Some countries appear to have been able to drive their R0 for SARS-CoV-2
below 1 with mitigation measures, although as the mitigation measures are lifted, the R0 in any given area may
creep back above 1, leading to disease resurgence over time.
The R0 for pandemic influenza has varied by pandemic, but estimates have consistently been around or below 2,
suggesting that even past severe influenza pandemic viruses have been less transmissible than SARS-CoV-2. A
review article published after the 2009-10 pandemic examined a range of studies reporting R0 values for the last
four influenza pandemics. While the results varied, the highest median R0 was associated with the 1918 and the
1968 influenza pandemics (both 1.8), followed by the 1957 pandemic (1.65), then the 2009-10 pandemic (1.46); by
comparison, seasonal influenza epidemics have a median R0 of 1.27 (Biggerstaff 2014).
4Key Lessons From Past Influenza Pandemics
Of eight major pandemics that have occurred since the early 1700s, no clear seasonal pattern emerged for most.
Two started in winter in the Northern Hemisphere, three in the spring, one in the summer, and two in the fall
(Saunders-Hastings 2016).
Seven had an early peak that disappeared over the course of a few months without significant human
intervention. Subsequently, each of those seven had a second substantial peak approximately 6 months afterfirst
peak. Some pandemics showed smaller waves of cases over the course of 2 years after the initial wave. The only
pandemic that followed a more traditional influenza-like seasonal pattern was the 1968 pandemic, which began
with a late fall/winter wave in the Northern Hemisphere followed by a second wave the next winter (Viboud
2005). In some areas, particularly in Europe, pandemic-associated mortality was higher the second year.
The course of these pandemics was not substantially influenced by a vaccination campaign, except for the 2009-
10 pandemic, during which vaccine initially became available in the United States about 6 months after the
onset of the pandemic, although substantial quantities of vaccine were not available until after the pandemic
had peaked in most parts of the country. One report estimated that the vaccination program prevented 700,000
to 1,500,000 clinical cases, 4,000 to 10,000 hospitalizations, and 200 to 500 deaths in the United States (Borse
2013).
Following three of the pandemics that have occurred since 1900, the pandemic influenza A strain gradually
became more human-adapted and replaced the predominant seasonally circulating influenza virus to become the
main seasonal influenza A strain identified each year. Following the 2009-10 pandemic, the pandemic influenza
A H1N1 strain has been co-circulating seasonally along with influenza A H3N2.
Key points from observing the epidemiology of past influenza pandemics that may provide insight into the
COVID-19 pandemic include the following. First, the length of the pandemic will likely be 18 to 24 months, as
herd immunity gradually develops in the human population. This will take time, since limited serosurveillance
data available to date suggest that a relatively small fraction of the population has been infected and infection
rates likely vary substantially by geographic area. Given the transmissibility of SARS-CoV-2, 60% to 70% of the
population may need to be immune to reach a critical threshold of herd immunity to halt the pandemic (Kwok
2020).
This may be complicated by the fact that we don’t yet know the duration of immunity to natural SARS-CoV-2
infection (it could be as short as a few months or as long as several years). Based on seasonal coronaviruses,
we can anticipate that even if immunity declines after exposure, there may still be some protection against
disease severity and reduced contagiousness, but this remains to be assessed for SARS-CoV-2. The course of
the pandemic also could be influenced by a vaccine; however, a vaccine will likely not be available until at least
sometime in 2021. And we don’t know what kinds of challenges could arise during vaccine development that
could delay the timeline.
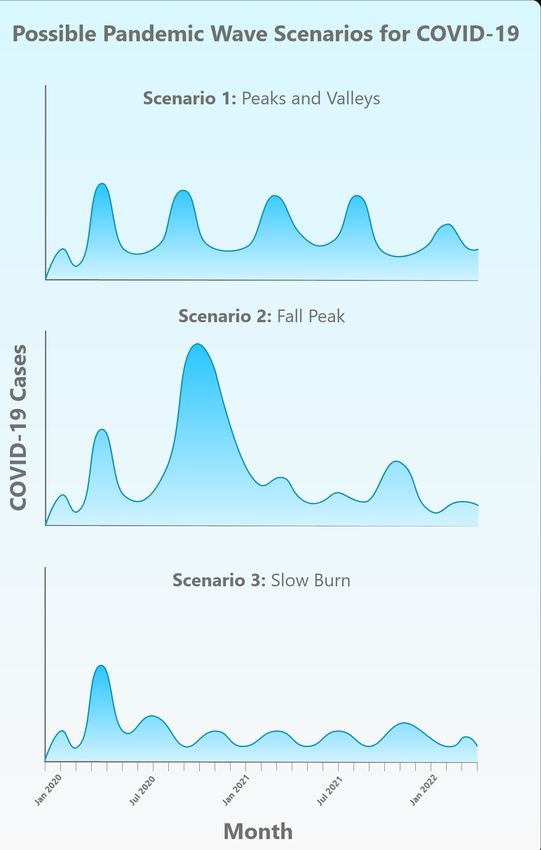
Second, there are several different scenarios for the future of the COVID-19 pandemic, and some of these are
consistent with what occurred during past influenza pandemics. These can be summarized as follows and are
illustrated in the figure below.
5¤ Scenario 1: The first wave of COVID-19 in spring 2020 is followed by a series of repetitive smaller waves
that occur through the summer and then consistently over a 1- to 2-year period, gradually diminishing
sometime in 2021. The occurrence of these waves may vary geographically and may depend on what
mitigation measures are in place and how they are eased. Depending on the height of the wave peaks, this
scenario could require periodic reinstitution and
subsequent relaxation of mitigation measures over the
next 1 to 2 years.
¤ Scenario 2: The first wave of COVID-19 in spring
2020 is followed by a larger wave in the fall or winter
of 2020 and one or more smaller subsequent waves
in 2021. This pattern will require the reinstitution
of mitigation measures in the fall in an attempt to
drive down spread of infection and prevent healthcare
systems from being overwhelmed. This pattern is
similar to what was seen with the 1918-19 pandemic
(CDC 2018). During that pandemic, a small wave
began in March 1918 and subsided during the summer
months. A much larger peak then occurred in the fall
of 1918. A third peak occurred during the winter and
spring of 1919; that wave subsided in the summer of
1919, signaling the end of the pandemic. The 1957-58
pandemic followed a similar pattern, with a smaller
spring wave followed by a much larger fall wave
(Saunders-Hastings 2016). Successive smaller waves
continued to occur for several years (Miller 2009). The
2009-10 pandemic also followed a pattern of a spring
wave followed by a larger fall wave (Saunders-Hastings
Figure 1
2016).
¤ Scenario 3: The first wave of COVID-19 in spring 2020 is followed by a “slow burn” of ongoing
transmission and case occurrence, but without a clear wave pattern. Again, this pattern may vary somewhat
geographically and may be influenced by the degree of mitigation measures in place in various areas. While
this third pattern was not seen with past influenza pandemics, it remains a possibility for COVID-19. This
third scenario likely would not require the reinstitution of mitigation measures, although cases and deaths
will continue to occur.
Whichever scenario the pandemic follows (assuming at least some level of ongoing mitigation measures), we
must be prepared for at least another 18 to 24 months of significant COVID-19 activity, with hot spots popping up
periodically in diverse geographic areas. As the pandemic wanes, it is likely that SARS-CoV-2 will continue to
circulate in the human population and will synchronize to a seasonal pattern with diminished severity over time,
as with other less pathogenic coronaviruses, such as the betacoronaviruses OC43 and HKU1, (Kissler 2020) and
past pandemic influenza viruses have done.
6References
Anderson RM, Heesterbeek H, Klinkenberg D, et al. How will country-based mitigation measures influence
the course of the COVID-19 epidemic? Lancet. 2020 Mar 21;395(10228):931-4 [Full text]
Arons, MM, Hatfield, KM, Reddy SC, et al. Presymptomatic SARS-CoV-2 infections and transmission in a
skilled nursing facility. N Engl J Med 2020 (published online Apr 24) [Full text]
Biggerstaff M, Cauchemez S, Reed C, et al. Estimates of the reproductive number for seasonal, pandemic, and
zoonotic influenza: a systematic review of the literature. BMC Infect Dis 2014 Sep 4;14:480 [Full text]
Borse RH, Shrestha SS, Fiore AE, et al. Effects of vaccine program against pandemic influenza A(H1N1)
virus, United States, 2009-2010. Emerg Infect Dis 2013 Mar;19(3):439-48 [Full text]
CDC. 1918 Pandemic influenza: three waves. Last updated May 11, 2018; accessed April 27, 2020 [Web page]
Delamater PL, Street EJ, Leslie TF, et al. Complexity of the basic reproduction number (R0). Emerg Infect Dis
2019;25(1):1-4 [Full text]
Fine P, Eames K, Heymann DL. “Herd immunity”: a rough guide. Clin Infect Dis 2011;52(7):911-6 [Full text]
Frieden TR, Lee CT. Identifying and interrupting superspreading events—implications for control of severe
acute respiratory syndrome coronavirus 2. Emerg Infect Dis 2020 (published online Mar 18) [Full text]
He X, Lau EHY, Wu P, et al. Temporal dynamics in viral shedding and transmissibility of COVID-19. Nat Med
2020 (published online Apr 15) [Full text]
Ip TDKM, Lau LLH, Cowling BJ. The dynamic relationship between clinical symptomatology and viral
shedding in naturally acquired seasonal and pandemic influenza virus infections. Clin Infect Dis 2016 Feb
15;62(4):431-7 [Full text]
Kahn R, Peak CM, Fernández-Gracia J, et al. Incubation periods impact the spatial predictability of cholera
and Ebola outbreaks in Sierra Leone. Proc Natl Acad Sci USA 2020 Mar 3;117(9):5067-73 [Abstract]
Kissler SM, Tedijanto C, Goldstein E, et al. Projecting the transmission dynamics of SARS-CoV-2 through the
postpandemic period. Science 2020 (published online Apr 14) [Full text]
Kwok KO, Lai F, Wei WI, et al. Herd immunity—estimating the level required to halt the COVID-19
epidemics in affected countries. J Infect 2020 Mar 21 [Full text]
Lauer SA, Grantz KH, Bi Q, et al. The incubation period of coronavirus disease 2019 (COVID-19) from
publicly reported confirmed cases: estimation and application. Ann Intern Med 2020 (published online Mar 10)
[Full text]
Leung NH, Xu C, Ip DKM, et al. The fraction of influenza virus infections that are asymptomatic: a systematic
review and meta-analysis. Epidemiology 2015 Nov;26(6):862-72 [Full text]
Li R, Pei S, Chen B, et al. Substantial undocumented infection facilitates the rapid dissemination of novel
coronavirus (SARS-CoV2) Science 2020 (published online Mar 16) [Full text]
7Miller MA, Viboud C, Balinska M, et al. The features of influenza pandemics — implications
for policy. N Engl J Med 2009 Jun 18;360(25):2595-8 [Full text]
Murray CJ, Lopez AD, Chin B, et al. Estimation of potential global pandemic influenza mortality on the basis
of vital registry data from the 1918-20 pandemic: a quantitative analysis. Lancet 2006 Dec 23;368(9554):2211-8
[Abstract]
Rettner R. Up to 25% of people with COVID-19 may not show symptoms. Livescience.com [News report]
Sanche S, Lin YT, Xu C, et al. High contagiousness and rapid spread of severe acute respiratory syndrome
coronavirus 2. Emerg Infect Dis 2020 Apr 7;26(7) [Full text]
Saunders-Hastings PR, Krewski D. Reviewing the history of pandemic influenza: understanding patterns of
emergence and transmission. Pathogens 2016 Dec 6;5(4):66 [Full text]
Viboud C, Grais RF, Lafont BAP, et al. Multinational impact of the 1968 Hong Kong influenza pandemic:
evidence for a smoldering pandemic. J Infect Dis 2005 Jul;192(2):233-48 [Full text]
Viboud C, Simonsen L, Fuentes R, et al. Global mortality impact of the 1957–1959 influenza pandemic. J
Infect Dis 2016 Mar 1;213(5):738-45 [Full text]
Wong G, Liu W, Liu Y, et al. MERS, SARS, and Ebola: the role of super-spreaders in infectious disease. Cell
Host Microbe 2015;18(4):398-401 [Full text]
8You can also read