Habitable zone for Earth-like planets in the solar system
←
→
Page content transcription
If your browser does not render page correctly, please read the page content below
Planetary and Space Science 48 (2000) 1099–1105
                                                                                                               www.elsevier.nl/locate/planspasci

                  Habitable zone for Earth-like planets in the solar system
           S. Franck ∗ , A. Block, W. von Bloh, C. Bounama, H.-J. Schellnhuber, Y. Svirezhev
                       Potsdam Institute for Climate Impact Research (PIK), PO Box 60 12 03, 14412 Potsdam, Germany

                        Received 2 September 1999; received in revised form 17 November 1999; accepted 2 December 1999

Abstract
   We present a new conceptual Earth system model to investigate the long-term co-evolution of geosphere and biosphere from the
geological past upto 1.5 billion years into the planet’s future. The model is based on the global carbon cycle as mediated by life and driven
by increasing solar luminosity and plate tectonics. As a major result of our investigations we calculate the “terrestrial life corridor”, i.e.
the biogeophysical domain supporting a photosynthesis-based ecosphere during planetary history and future. Furthermore, we calculate
the behavior of our virtual Earth system at various distances from the Sun, using di erent insolations. In this way, we can nd the
habitable zone as the band of orbital distances from the Sun within which an Earth-like planet might enjoy moderate surface temperatures
and CO2 -partial pressures needed for advanced life forms. We calculate an optimum position at 1.08 astronomical units for an Earth-like
planet at which the biosphere would realize the maximum life span. According to our results, an Earth-like planet at Martian distance
would have been habitable up to about 500 Ma ago while the position of Venus was always outside the habitable zone. c 2000 Elsevier
Science Ltd. All rights reserved.

1. Introduction                                                               and perhaps biological evolution will control the habitabil-
                                                                              ity of a planet. Earth-like planets cannot remain habitable
   The extraterrestrial life debate spans from the ancient                    if they are too much closer to the Sun than Earth’s orbit,
Greek world of Democritus over the 18th century European                      because of too high temperatures and loss of water by pho-
world of Immanuel Kant to the recent discoveries of extra-                    todissociation. On the other hand, an Earth-like planet which
solar planets. Concerning the search of life in our planetary                 is too much distant from the Sun would have permanent
system, Schiaparelli’s observation of a system of canali on                   surface temperatures below the freezing point of water and
the Martian surface in 1877 was the beginning of an epoch                     therefore would not be habitable.
to reveal planetary conditions relevant to life with the re-                     Therefore, the habitable zone (HZ) around the Sun is
  nement of observational techniques. The detection by Mc                     de ned as the region within which an Earth-like planet
Kay et al. (1996) of the chemical biomarkers and possible                     might enjoy moderate surface temperatures needed for ad-
microfossils in a meteorite from Mars called ALH 84001 (a                     vanced life forms. Usually, this de nition is equivalent
meteorite found in 1984 in Antarctica) has stimulated re-                     to the existence of liquid water at the planet’s surface.
search in the newly emerging eld of astrobiology. Mars                        Such a de nition was introduced by Huang (1959, 1960)
holds great interest for exobiology and presently stands cen-                 and extended by Dole (1964) and Shklovskii and Sagan
ter stage in the plans to explore the inner solar system for                  (1996). Hart (1978, 1979) calculated the evolution of the
signs of past or present life. Already now, it can be stated                  terrestrial atmosphere over geologic time at varying dis-
that the search for extraterrestrial life will be one of the pre-             tances. He found that the HZ between runaway greenhouse
dominant themes of science in the 21st century.                               and runaway glaciation is surprisingly narrow for G2 stars
   The histories and fates of the three terrestrial planets                   like our Sun: Rinner = 0:958 AU; Router = 1:004 AU. A
Venus, Earth, and Mars suggest that a combination of dis-                     main disadvantage of these calculations is the neglect of
tance from the Sun, planetary size, as well as geological                     the negative feedback between atmospheric CO2 content
                                                                              and mean global surface temperature discovered later by
                                                                              Walker et al. (1981). The implementation of this feedback
  ∗ Corresponding author. Tel.: +49-331-288-2659; fax: +49-331-               by Kasting et al. (1988) provided the interesting result of
288-2660.                                                                     an almost constant inner boundary but a remarkable ex-
  E-mail address: franck@pik-potsdam.de (S. Franck).                          tension of the outer boundary. Later on, the calculations

0032-0633/00/$ - see front matter c 2000 Elsevier Science Ltd. All rights reserved.
PII: S 0 0 3 2 - 0 6 3 3 ( 0 0 ) 0 0 0 8 4 - 2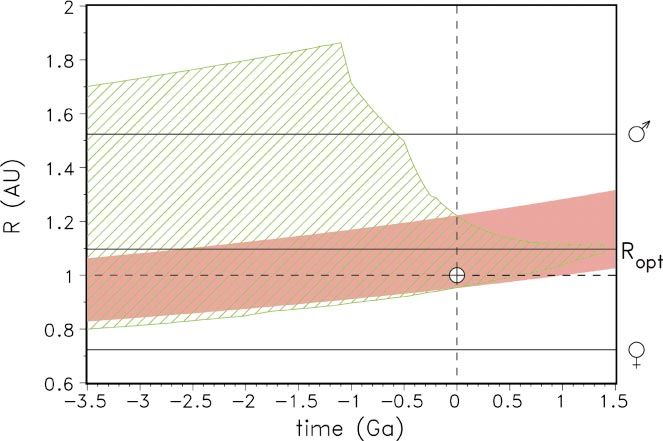
1100                                  S. Franck et al. / Planetary and Space Science 48 (2000) 1099–1105

of the HZ have been improved and extended to other                           The total process of weathering embraces rst the reac-
main sequence stars (Kasting et al., 1993; Kasting, 1997;                 tion of silicate minerals with carbon dioxide, second the
Williams, 1998). A comprehensive overview can be found                    transport of weathering products, and third the deposition
in the proceedings of the rst international conference on                 of carbonate minerals in sediments. The basic assumptions
circumstellar habitable zones (Doyle, 1996). Kasting et al.               and limitations of this approach are given in Franck et
(1993) give two di erent estimates for the outer boundary                 al. (1999). Combining the direct temperature e ect on the
of the HZ: the “1st CO2 condensation” limit and the “maxi-                weathering reaction, the weak temperature in uence on
mum greenhouse” limit. For the present time the values are                river runo , and the dependence of weathering on soil CO2
1.37 AU and 1.67 AU, respectively.                                        concentration, the global mean silicate-rock weathering
   In the present paper we want to investigate the possibil-              rate can be formulated via the following implicit equation
ities of existence of life on an Earth-like planet at various             (Walker et al., 1981; Caldeira and Kasting, 1992):
distances from the Sun. Our method is based on the Earth                                     0:5
                                                                           Fwr        aH+                Ts − Ts; 0
system science approach (Franck et al., 1999, 2000) that                         =                 exp                :          (4)
calculates the past and future evolution of a dynamic Earth               Fwr; 0     aH + ; 0             13:7 K
under the in uence of an increasing solar luminosity. Such                Here the pre-factor outlines the role of the CO2 concen-
a long-term climate regulation is thought to be given by                  tration in the soil, Psoil ; aH+ is the activity of H+ in fresh
the global carbon cycle and its e ect on atmospheric CO2                  soil-water and depends on Psoil and the global mean sur-
content and biological productivity. This method is brie y                face temperature, Ts . The quantities Fwr; 0 ; aH+ ; 0 , and Ts; 0
presented below.                                                          are the present-day values for the weathering rate, the H+
                                                                          activity, and the surface temperature, respectively. The ac-
                                                                          tivity aH+ is itself a function of the temperature and the
2. Model description                                                      CO2 concentration in the soil. The equilibrium constants
                                                                          for the chemical activities of the carbon and sulfur systems
   Our model (Franck et al., 1999, 2000) couples the in-                  involved have been taken from Stumm and Morgan (1981).
creasing solar luminosity, S , the silicate-rock weathering               Note that the sulfur content in the soil also contributes to
rate, Fwr , and the global energy balance to estimate the par-            the global weathering rate, but its in uence does not depend
tial pressure of atmospheric carbon dioxide, Patm , the mean              on temperature. It can be regarded as an overall weathering
global surface temperature, Ts , and the biological produc-               bias, which has to be taken into account for the estimation
tivity, , as a function of time, t, in the geological past and           of the present-day value.
future.                                                                      Eq. (4) is the key relation for our models. For any given
   The global energy balance of the planet’s climate is usu-              weathering rate, the surface temperature and the CO2 con-
ally expressed with the help of the Arrhenius equation (Ar-               centration in the soil can be calculated self-consistently, as
rhenius, 1896):                                                           will be shown below. Psoil can be assumed to be linearly re-
              4                                                           lated to the terrestrial biological productivity,  (see Volk,
(1 − a)S = 4Tbbr ;                                             (1)
                                                                          1987), and the atmospheric CO2 concentration, Patm . Thus,
where a is the planetary albedo,  is the Stefan–Boltzmann                we have
constant, and Tbbr is the e ective black-body radiation tem-
                                                                           Psoil               Patm; 0      Patm
perature. The surface temperature of the planet Ts is related                      =      1−               +          ;                (5)
                                                                          Psoil; 0   0         Psoil; 0     Psoil; 0
to Tbbr by the greenhouse warming factor T :
                                                                          where Psoil; 0 ; 0 , and Patm; 0 are again present-day values.
Ts = Tbbr + T:                                                 (2)          The main role of the biosphere in the context of our model
Usually, T is parameterized as a function of Ts and Patm                 is to increase Psoil in relation to the atmospheric CO2 partial
(Caldeira and Kasting, 1992; Franck et al., 1999). The main               pressure and proportional to the biological productivity :
drawback of this parameterization is the limited range of                 is considered to be a function of temperature and CO2 partial
applicability to high atmospheric CO2 partial pressures, Patm ,           pressure in the atmosphere only.
                                                                                                       2 !
above 105 ppm. In our model the upper limit of Patm can                                      Ts − Topt              Patm − Pmin
be as high as the total amount of 107 ppm carbon dioxide                          = 1−                                                  :
                                                                          max                   Topt           P1=2 + (Patm − Pmin )
in the Earth system (Kasting and Ackerman, 1986; Tajika
and Matsui, 1992). Therefore, we apply the global energy                                                                                (6)
balance given by Williams (1998) valid also for Patm higher               max is the maximum productivity and is assumed to be
than 105 ppm and implicitly including the greenhouse e ect:               twice the present value 0 (Volk, 1987). P1=2 + Pmin is the
                                                                          value at which the pressure-dependent factor is equal to 1=2
S (1 − a(Ts ; Patm )) = 4I (Ts ; Patm );                        (3)
                                                                          and Pmin = 10 ppm the minimum value for photosynthesis.
where I is the outgoing infrared ux. For I and a poly-                    For xed Patm , Eq. (6) produces maximum productivity at
nomial approximations of a radiative–convective climate                   the optimum temperature (Ts = Topt ) and zero productiv-
                                                                                                                           ◦
model were used.                                                          ity outside the temperature tolerance interval [0 C : : : 2Topt ].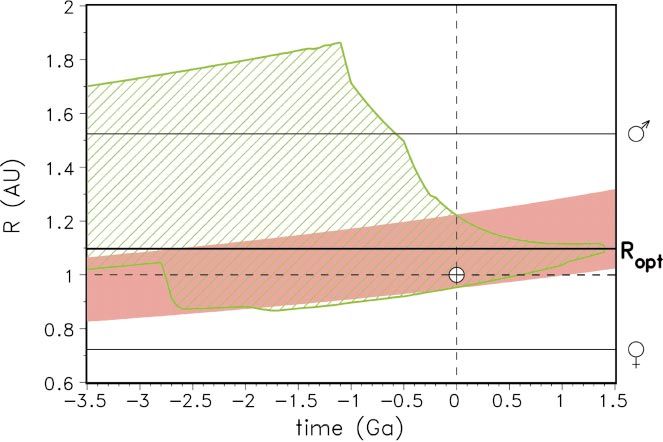
S. Franck et al. / Planetary and Space Science 48 (2000) 1099–1105                                   1101

                                                              ◦
The present biosphere can be described with Topt = 25 C.
For the description of a thermophilic or hyperthermophilic
biosphere we have also investigated models with maximum
                                    ◦
biological productivity at Ts = 50 C and zero productivity
            ◦             ◦
for Ts 6 0 C; Ts ¿ 100 C.
   First, we have solved the system of Eqs. (1–6) under
the assumption that the weathering rate Fwr is always equal
to the present value Fwr; 0 . This is clearly a rather rough
approximation. We call this approach the geostatic model
(GSM).
   Franck et al. (1999) have introduced the geodynamic
model (GDM). In this case, a balance between the CO2
sink in the atmosphere–ocean system and the metamorphic
(plate-tectonic) sources is expressed with the help of dimen-
sionless quantities (Kasting, 1984):
fwr · fA = fsr ;                                               (7)
where fwr ≡ Fwr =Fwr; 0 is the weathering rate normalized
by the present value, fA ≡ Ac =Ac; 0 is the continental area
normalized by the present value, and fsr ≡ S=S0 is the
spreading rate normalized by the present value.
   With the help of Eq. (7) we can calculate the weath-
ering rate from geodynamical theory. The main idea con-
sists in the coupling of the thermal and degassing history
of the Earth. To formalize this coupling we need a rela-
tion between the mantle heat ow, expressing the thermal
history, and the sea- oor spreading rate, expressing the de-               Fig. 1. Positive and negative feedbacks in our Earth system model.
gassing history. The spreading rate is given as a function of
the mantle heat ow calculated by the cooling process of
an oceanic plate which is approximated by the cooling of                 qualitative behavior and that the life span of the biosphere
a semi-in nite half-space. The derivation of this formula is             is always of the same order of magnitude.
given in the well-known textbook on geodynamics by Tur-                     Now, we have the means to calculate the weathering
cotte and Schubert (1982):                                               rate for every time step of the evolution of an Earth-like
                                                                         planet with the help of Eqs. (7) – (9) and to determine
           qm (t)2 ÄAo (t)                                              self-consistently the climatic parameters and the biological
S(t) =                          :                              (8)
         [2k(Tm (t) − Ts; 0 )]2                                          productivity from the system of Eqs. (1) – (6). Our Earth
Here qm is the mean heat ow from the mantle, S is again                  system model is sketched in Fig. 1.
the sea- oor spreading rate, k is the thermal conductivity,                 The aim of all these calculations is the determination of
Tm is the average mantle temperature, Ä is the thermal di u-             the HZ. In our approach, the HZ for an Earth-like planet
sivity, and Ao (t) is the area of ocean basins at time t: Ts; 0 is       is the region around the Sun within which the surface tem-
                                                                                                                 ◦
taken as the constant outer temperature of the upper bound-              perature of the planet stays between 0 C and 2Topt and the
ary layer in the parameterized convection approximation                  atmospheric CO2 content is higher than 10 ppm suitable
(Franck, 1998). The evolution of the global average mantle               for photosynthesis-based life (i.e. biological productivity
heat ow is a result of the parameterized convection model.                ¿ 0):
The area of the planet’s surface Ae is obviously the sum of              HZ:={R | (Patm (R; t); Ts (R; t)) ¿ 0}:                         (10)
Ao (t) and the area of continents Ac (t), i.e.,
                                                                         The upper limit of CO2 content is the total amount of CO2
Ae = Ao (t) + Ac (t):                                          (9)
                                                                         in an Earth-like planet’s atmosphere which is taken as 5
Eqs. (8) and (9) can be used to introduce continental growth             bar or 10 bar, respectively. The term “Earth-like” explicitly
models into the equations for the volatile cycle. For the                implies the occurrence of plate tectonics as a necessary con-
present study, i.e. the investigation of an Earth-like planet            dition for the operation of the carbonate-silicate cycle as the
under the external forcing of the Sun, we used a continen-               mechanism to compensate the gradual brightening of the Sun
tal growth model that is based on geological investigations              during its “life” on the main sequence. In our model, the
(Condie, 1990). Nevertheless, it turns out as a result of sen-           geodynamical evolution of the considered Earth-like planet
sitivity tests for various continental growth models (Franck             provides an even stronger constraint. In the geological
et al., 2000) that the corresponding HZs do not di er in their           past the volcanic input of CO2 to the atmosphere was much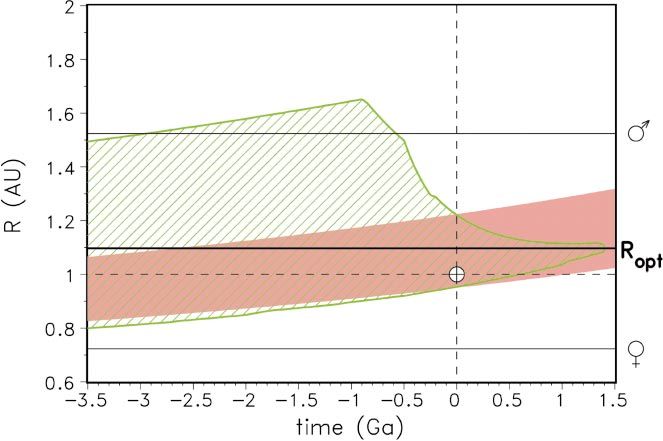
1102 S. Franck et al. / Planetary and Space Science 48 (2000) 1099–1105
Fig. 2. Past and future evolution of the surface temperature (a) and normalized biological productivity (b) for the GSM (red) and the GDM (green).
◦ ◦
The full green line corresponds to Topt = 25 C and the dashed green line to Topt = 50 C.
higher than today and the continental area (available for
weathering) was much smaller than today.
3. Results and discussion
In our computer model, we started with the parameters
for the present state of the Earth system (fwr = Fwr =Fwr; 0 =
1). From the ratio of the dimensionless mid-ocean sea oor
spreading rate and the dimensionless continental area from
Franck and Bounama (1995; 1997) we calculated fwr via
Eq. (7) for time steps of one million years back to Earth’s
history. With a numerical root- nding method, we solved the
system of Eqs. (1–9) self-consistently back to the Hadean.
At this geological era, life changed from anaerobic to aerobic
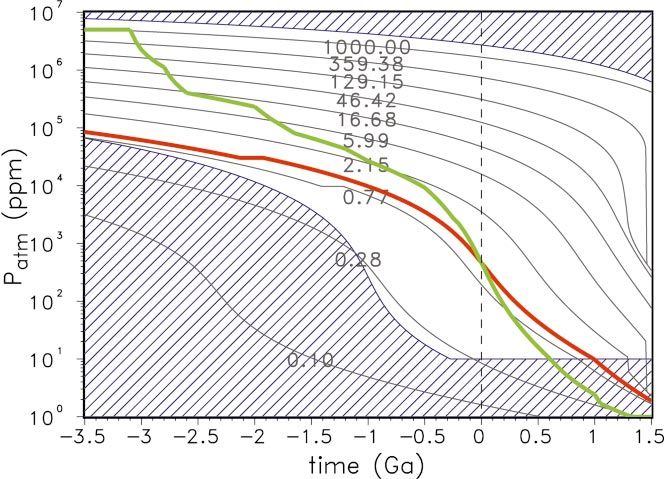
Fig. 3. Evolution of the atmospheric carbon content for GSM (red)
forms, and for the biological productivity Eq. (6) may be ◦
and GDM with Topt = 50 C (green). The terrestrial life corridor is the
applied. Starting from the present state again, we ran our non-dashed region. The plotted isolines are the solutions of GSM for the
model 1.5 Ga into the future. Furthermore, we performed indicated xed values of the normalized weathering rate fwr .
the procedure at varying distances of our model planet Earth
from the Sun between 0.6 and 2.0 AU.
The results for the surface temperature, Ts , and biological is in the late Archaean and is always greater than zero. This
productivity, , as the key parameter for the determination is a hint to the preferred conditions for thermophiles and
of the HZ are shown in Figs. 2 a and b. We have plotted hyperthermophiles in early Earth’s history (Schwartzman
both, the geostatic and the geodynamic models for optimum et al., 1993). In the future, biological productivity of the
◦
temperatures Topt = 25 and 50 C, respectively. The temper- GDM decreases to zero some hundred million years earlier
ature curves (Fig. 2a) for the geological past are always in than for the GSM, reducing the life span of the biosphere
◦
the temperature window [0 : : : 100 C], which is in qualita- for the same amount. The e ect results both from the further
tive agreement with the general temperature record but of continental growth and from the further decrease in spread-
course does not hint to such e ects like snowball states (see, ing rate forcing lower atmospheric CO2 content (Franck
e.g., Ho mann et al., 1998). et al., 2000).
We nd a strong change in biological productivity (Fig. Fig. 3 shows the atmospheric carbon content over the
2b) in the GDM for the past period resulting from higher time from the Hadean to the planetary future for the two
◦
temperatures. For Topt = 25 C, corresponding to a temper- models. In the dashed region of Fig. 3 no photosynthe-
◦
ature tolerance interval [0 : : : 50 C], the biological produc- sis is possible because of inappropriate temperature or
tivity has a maximum in the Proterozoic but is zero in the atmospheric carbon content. In the non-dashed region,
◦
early Archaean. For Topt = 50 C, corresponding to a tem- photosynthesis-based life is possible. This region is called
◦
perature tolerance interval [0 : : : 100 C], the maximum of the “terrestrial life corridor”. The reference model GSM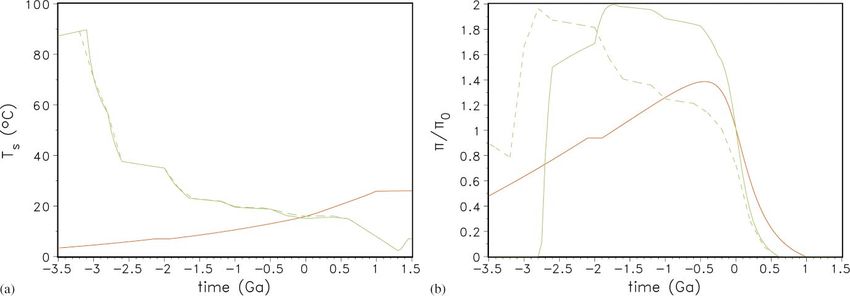
S. Franck et al. / Planetary and Space Science 48 (2000) 1099–1105                                       1103

Fig. 4. Evolution of the HZ for GSM (red) and GDM (green). The               Fig. 5. Evolution of the HZ for GSM (red) and GDM (green). The
optimum position of an Earth-like planet is at Ropt =1:08 AU. In this case   optimum position of an Earth-like planet is at Ropt = 1:08 AU. In this
the life span of the biosphere is at maximum. The total amount of carbon     case the life span of the biosphere is at maximum. The total amount
PCO2 (total) is 10 bar and the optimum temperature for the biosphere Topt    of carbon, PCO2 (total), is 10 bar and the optimum temperature for the
      ◦                                                                                             ◦
is 50 C.                                                                     biosphere, Topt , is 25 C.

is based on a weathering rate that is always equal to the
present-day rate Fwr =Fwr; 0 = 1. The GDM takes into ac-
count the in uence of an enlarging continental area and
the changing spreading rate on weathering. It has higher
weathering rates for the past (i.e. Fwr =Fwr; 0 ¿ 1). This can
be explained easily with the help of Eq. (7), because in the
geological past we have higher spreading rates, fsr , and
a smaller continental area, fA . In the planetary future we
  nd the reverse situation: lower spreading rates and higher
continental area. This is the reason why the biosphere’s life
span is shorter, because photosynthesis can persist only up
to the critical level of 10 ppm atmospheric CO2 concen-
tration. Compared to the smooth curve of the GSM model,
our favorite model GDM provides a curve with a certain
                                                                             Fig. 6. Evolution of the HZ for GSM (red) and GDM (green). The
structure that is directly related to the step-like continental              optimum position of an Earth-like planet is at Ropt =1:08 AU. In this case
growth (Franck et al., 2000).                                                the life span of the biosphere is at maximum. The total amount of carbon
   Besides calculating the terrestrial life corridor, i.e., the              PCO2 (total) is 5 bar and the optimum temperature for the biosphere Topt
                                                                                   ◦
evolution of atmospheric carbon regimes with possibilities                   is 50 C.
for photosynthesis-based life in time, we also calculated the
behavior of our virtual Earth system at various distances, R,                and the biosphere ceases to exist, as already found in the re-
from the Sun, which gives di erent insolations. This deter-                  sults for the biological productivity (Fig. 2b) and the terres-
mines the HZ as the region around the Sun within which                       trial life corridor (Fig. 3). Our favorite GDM shows both a
an Earth-like planet might enjoy conditions needed for ad-                   shift and a narrowing of the HZ. The inner boundary reaches
vanced life forms. The results for the estimation of the HZ                  the Earth distance in about 600 Ma in correspondence with
are shown in Figs. 4 – 6 where we have plotted the width                     the shortening of the life span of the biosphere by about
and position of the HZ for geostatic and geodynamic models                   400 Ma compared to GSM. In the GDM, the outer boundary
over time.                                                                   shows the following behavior: the nearly linear increase of
   In Fig. 4, we show the HZ for the GSM and the GDM                         the outer edge of HZ from 1.7 AU at −3:5 Ga to the max-
                                                       ◦
with a total carbon content of 10 bar and Topt = 50 C, i.e.                  imum greenhouse limit of 1.8 AU at −1:1 Ga results only
     ◦
100 C as the upper bound for the biological productivity.                    from the increase in solar luminosity. After −1:1 Ga ago
First, we nd that the width and the position of the HZ are                   geodynamics comes directly into play via two processes:
completely di erent for the models GSM and GDM. For the                        rst, more e ective weathering because of growing conti-
geostatic case (GSM), the width of the HZ is nearly con-                     nental area and, second, decreasing CO2 input because of
stant and shifts only slightly outward with time, which is the               decreasing volcanic activity caused by decreasing spreading
result of increasing insolation. In about 1000 Ma the inner                  rate. The e ect of these two processes provokes a lowering
boundary of the HZ reaches the Earth distance (R = 1 AU)                     of the outer edge of HZ down to 1.08 AU in about 1.4 Ga. At
1104 S. Franck et al. / Planetary and Space Science 48 (2000) 1099–1105
this point, the outer and the inner boundary of the HZ coin- In Fig. 6 we have plotted the HZ for GSM and GDM with
◦
cides and the HZ of our favored GDM vanishes. Therefore, Topt = 50 C but a total carbon content of 5 bar. This value
the negative feedback mechanism of Walker et al. (1981) of PCO2 (total) = 5 bar was chosen because of the discus-
cannot be applied directly to our model. sions about the role of CO2 clouds in early Martian climate
At present, for our models GSM and GDM the outer edge (Pollack et al., 1987; Kasting 1991, 1997; Squyres and Kast-
of the HZ is about 1.2 AU. That is noticeably smaller than ing, 1994; Forget and Pierrehumbert, 1997; Haberle, 1998).
the 1st CO2 condensation limit of Kasting et al. (1993) at First, it was calculated that condensation of CO2 decreases
1.37 AU. The reason for this is the weaker greenhouse e ect the lapse rate and reduces the magnitude of the greenhouse
in the model of Williams (1998) compared to other green- e ect. This cloud-e ect is important at low solar luminos-
house models. For example, the application of a di erent ity and CO2 partial pressure higher than 5 bar. According
greenhouse model based on a radiative–convective climate to this Martian surface temperature cannot be raised to ar-
model (Caldeira and Kasting, 1992) gives 1.39 AU for the bitrary levels by increasing atmospheric CO2 content above
present outer boundary of HZ (Franck et al., 2000). But this 5 bar. Forget and Pierrehumbert (1997) found that the crys-
greenhouse model works only for CO2 contents lower than tals of CO2 ice should scatter radiation at thermal infrared
105 ppm and is therefore not suitable to determine the HZ wavelength more e ectively than they scatter visible and
in the early stages of Earth’s evolution. near-infrared radiation. Therefore, CO2 clouds can keep the
According to Kasting et al. (1993), the outer boundary early Mars warm by shielding infrared backscattering from
of the HZ is determined by CO2 clouds that attenuate the the Martian surface. In this way, the described phenomenon
incident sunlight via Rayleigh scattering. The critical CO2 may imply that the HZ may be wider than the calculated
partial pressure for the onset of this e ect is about 5 – 6 bar. without the help of CO2 clouds e ect. In our climate model
Recently, the e ect of CO2 clouds has been challenged by we did not consider CO2 clouds, but as can be seen in Fig. 6,
Forget and Pierrehumbert (1997). CO2 clouds have the ad- even with PCO2 (total)=5 bar, an Earth-like planet at Martian
ditional e ect of re ecting the outgoing thermal radiation position would have been within the HZ from about 3 Ga to
back to the surface. They may have played a role in warm- about 0.5 Ga ago. So we conclude that the outer boundary
ing Earth when the Sun was fainter than today, assuming of the HZ is mainly determined by the total amount of CO2
that enough CO2 was available on early Earth. In this way, that can be in the atmosphere and the extension of the HZ
they could have extended the size of the HZ in the past. In up to Martian position seems to be realistic for the past.
the future, however, solar luminosity will be too high and Concerning the planet Mars itself, we know that because
atmospheric CO2 content will be too low for the formation of its smaller size all geological processes caused by the in-
of CO2 clouds. As will be discussed below, we felt that we ternal cooling of the planet should go o much faster than
do not have to take into account these e ects at least for our for the Earth. Nevertheless, we can speculate that our nd-
models with a maximum atmospheric CO2 content of about ings about the HZ are an upper bound for the time that Mars
5 bar. was habitable in the past. This is in good agreement with
Furthermore, we can state from Fig. 4 that in the frame- investigations concerning an early warmer and wetter Mar-
work of our favorite model GDM the optimal distance of tian environment (Golombek, 1999) and with recent obser-
the Earth system would be about 1.08 AU. At such a dis- vations that plate tectonics may have once operated on Mars
tance the self-regulation mechanism would work optimally (Connerney et al., 1999).
against increasing external forcing arising from increasing In contrast to Mars, we nd in our model that the Venusian
solar insolation, and the life span of the biosphere would position was never and will never be within the HZ.
be extended to 1.4 Ga. But after this time the biosphere
would de nitely cease to exist. For the model parameters of
◦
the GDM in Fig. 4 (Topt = 50 C; PCO2 (total) = 10 bar) an Acknowledgements
Earth-like planet at the position of Venus is always outside
the HZ while such a planet at Martian distance is within the This work was supported by the German Science Foun-
HZ from the Hadean up to about 500 Ma ago. dation (DFG, grant number IIC5-Fr910=9-3).
Fig. 5 shows the HZ for the GSM and the GDM with
◦ ◦
Topt = 25 C, i.e. 50 C as the upper bound for the biological
productivity and again PCO2 (total) = 10 bar. In this case, we References
nd a qualitative change of the inner boundary of the HZ
for GDM in the past. First, at about 2 Ga ago, this boundary Arrhenius, S.A., 1896. On the in uence of carbonic acid in the air upon
shifts slightly outward and is more distant from the Sun than the temperature of the ground. Philos. Mag. 41, 237–275.
for the geostatic case. But at more than about 2.8 Ga ago the Caldeira, K., Kasting, J.F., 1992. The life span of the biosphere revisited.
Nature 360, 721–723.
Earth is outside the HZ because mean global temperatures
◦ Condie, K.C., 1990. Growth and accretion of continental crust: inferences
are obviously higher than 50 C. So we nd that the inner based on Laurentia. Chem. Geol. 83, 183–194.
boundary of the HZ up to 2 Ga ago is mainly determined Connerney, J.E.P., Acuna, M.H., Wasilewski, P.J., Ness, N.F., Reme,
by the upper temperature limit for photosynthesis. H., Mazelle, C., Vignes, D., Lin, R.P., Mitchell, D.L., Cloutier, P.A.,S. Franck et al. / Planetary and Space Science 48 (2000) 1099–1105 1105 1999. Magnetic lineations in the ancient crust of Mars. Science 284, Kasting, J.F., 1991. CO2 condensation and the climate of early Mars. 794–798. Icarus 94, 1–13. Dole, S.H., 1964. Habitable Planets for Man. Blaisdell, New York, Kasting, J.F., 1997. Habitable zones around low mass stars and the search 185 pp. for extraterrestrial life. Origins of Life 27, 291–307. Doyle, L.R. (Ed.) 1996. Circumstellar habitable zones. Proceedings of Kasting, J.F., Ackerman, T.P., 1986. Climatic consequences of very high the First International Conference. Travis House Publications, Menlo carbon dioxide levels in the Earth’s early atmosphere. Science 234, Park, CA, 525 pp. 1383–1385. Forget, F., Pierrehumbert, R.T., 1997. Warming early Mars with carbon Kasting, J.F., Toon, O.B., Pollack, J.B., 1988. How climate evolved on dioxide clouds that scatter infrared radiation. Science 278, 1273–1276. the terrestrial planets. Sci. Am. 256, 90–97. Franck, S., 1998. Evolution of the global heat ow over 4.6 Gyr. Kasting, J.F., Whitmire, D.P., Reynolds, R.T., 1993. Habitable zones Tectonophysics 291, 9–18. around main sequence stars. Icarus 101, 108–128. Franck, S., Block, A., von Bloh, W., Bounama, C., Schellnhuber, H.J., McKay, D.S., Gibson, E.K., Thomas-Keprta, K.L., Vali, H., Romanek, Svirezhev, Y., 2000. Reduction of biosphere life span as a consequence C.S., Clemett, S.J., Chillier, D.F., Maechling, C.R., Zare, R.N., 1996. of geodynamics. Tellus B, 52B, 94–107. Search for life on Mars: possible relic biogenic activity in Martian Franck, S., Bounama, C., 1995. E ects of water-dependent creep rate on meteorite ALH84001. Science 273, 924–930. the volatile exchange between mantle and surface reservoirs. Phys. Pollack, J.B., Kasting, J.F., Richardson, S.M., Poliako , K., 1987. The Earth Planet. Inter. 92, 57–65. case for a warm wet climate on early Mars. Icarus 71, 203–224. Franck, S., Bounama, C., 1997. Continental growth and volatile exchange Schwartzman, D., McMenamin, M., Volk, T., 1993. Did surface during Earth’s evolution. Phys. Earth Planet. Inter. 100, 189–196. temperatures constrain microbial evolution?. BioScience 43, 390–393. Franck, S., Kossacki, K., Bounama, C., 1999. Modelling the global carbon Shklovskii, I.S., Sagan, C., 1996. Intelligent Life in the Universe. cycle for the past and future evolution of the Earth system. Chem. Holden-Day, San Francisco, CA. Geol. 159, 305–317. Squyres, S.W., Kasting, J.F., 1994. Early Mars: how warm, and how Golombek, M.P., 1999. A message from warmer times. Science 283, wet?. Science 265, 744–748. 1470–1471. Stumm, W., Morgan, J.J., 1981. Aquatic Chemistry. Wiley, New York, Haberle, R.M., 1998. Early Mars climate models. J. Geophys. Res. 103, 780 pp. 28, 467–28, 479. Tajika, E., Matsui, T., 1992. Evolution of terrestrial proto-CO2 atmosphere Hart, M.H., 1978. The evolution of the atmosphere of the Earth. Icarus coupled with thermal history of the earth. Earth Planet. Sci. Lett. 113, 33, 23–39. 251–266. Hart, M.H., 1979. Habitable zones about main sequence stars. Icarus 37, Turcotte, D.L., Schubert, G., 1982. Geodynamics. Wiley, New York, 351–357. 450 pp. Ho mann, P.F., Kaufman, A.J., Halverson, G.P., Schrag, D.P., 1998. A Volk, T., 1987. Feedbacks between weathering and atmospheric CO2 over Neoprotoerozoic snowball Earth. Science 281, 1342–1346. the last 100 million years. Am. J. Sci. 287, 763–779. Huang, S.-S., 1959. Occurrence of life in the universe. Am. Sci. 47, Walker, J.C.G., Hays, P.B., Kasting, J.F., 1981. A negative feedback 397–402. mechanism for the long-term stabilization of Earth’s surface Huang, S.-S., 1960. Life outside the solar system. Sci. Am. 202 (4), temperature. J. Geophys. Res. 86, 9776–9782. 55–63. Williams, D.M., 1998. The stability of habitable planetary environments. A Kasting, J.F., 1984. Comments on the BLAG model: the carbonate–silicate Thesis in Astronomy and Astrophysics, Pennsylvania State University, geochemical cycle and its e ect on atmospheric carbon dioxide over 140 pp. the past 100 million years. Am. J. Sci. 284, 1175–1182.
You can also read