Planetary population synthesis - comparing theory and observation - Christoph Mordasini Division of Space Research and Planetary Sciences Physics ...
←
→
Page content transcription
If your browser does not render page correctly, please read the page content below
Planetary population synthesis -
comparing theory and
observation

Sagan Summer Workshop
19.-23.7.2021

Christoph Mordasini
Division of Space Research and
Planetary Sciences
Physics Institute
University of Bern, Switzerland
Talk contents
Part A: Introduction and methods
1.   Observational motivation
2.   Population synthesis principle
3.   Input physics: global models
4.   Initial conditions
5.   Observational biases

Part B: Results and perspectives
1.   Classes of planetary systems
2.   Overview of statistical results
3.   Comparisons with observations
4.   Perspectives and conclusions
1.
Observational motivation
Observational motivation
• Enormous increase in observational
data on exoplanets since 1995.
Detections from ground and space
(HARPS, HIRES, Kepler, TESS, NGTS,
SPHERE, GPI, CARMENES, CHEOPS,
ESPRESSO, WASP…)
• More to come soon (JWST, Gaia,
PLATO, Roman ST, ARIEL, ELT, …)
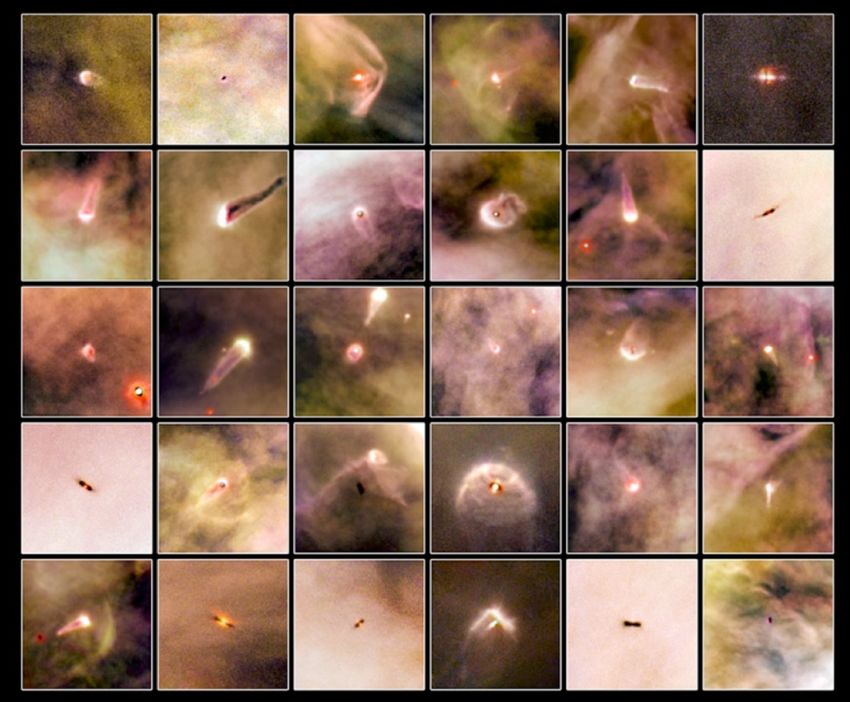
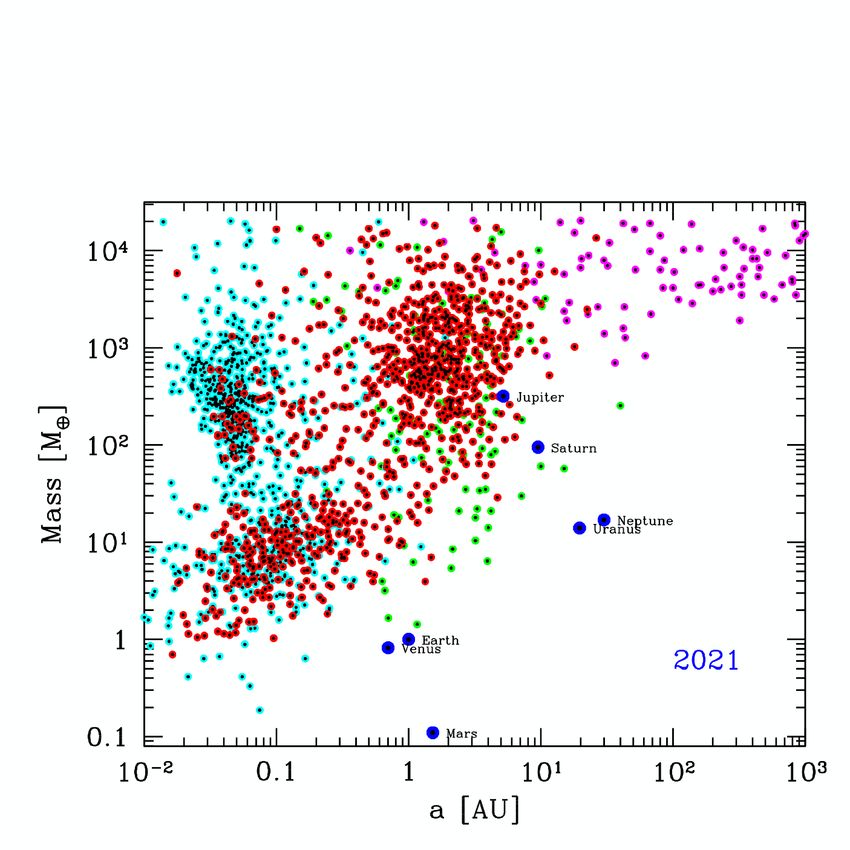
Diversity in exoplanet properties
Radial velocities Direct imaging
Transit photometry Microlensing
We would like to use all these observations to better understand planet formation and
evolution. But the field remains observationally driven, theory struggles to keep up. Why?
Challenges in planet formation and
evolution theory
Planet formation is a complex process
• Huge range in spa-al scales: dust grains to giant planets
• Millions of dynamical -mescales
• Mul-ple input physics: gravity, hydrodynamics,
10 μm
thermodynamics, radia-ve transport, magne-c fields,
high-pressure physics,…
• Strong non-linear mechanisms and feedbacks
• Laboratory experiments only for special regimes
• Complete 3D radia-on-magnetohydrodyamic
numerical simula-ons too expensive
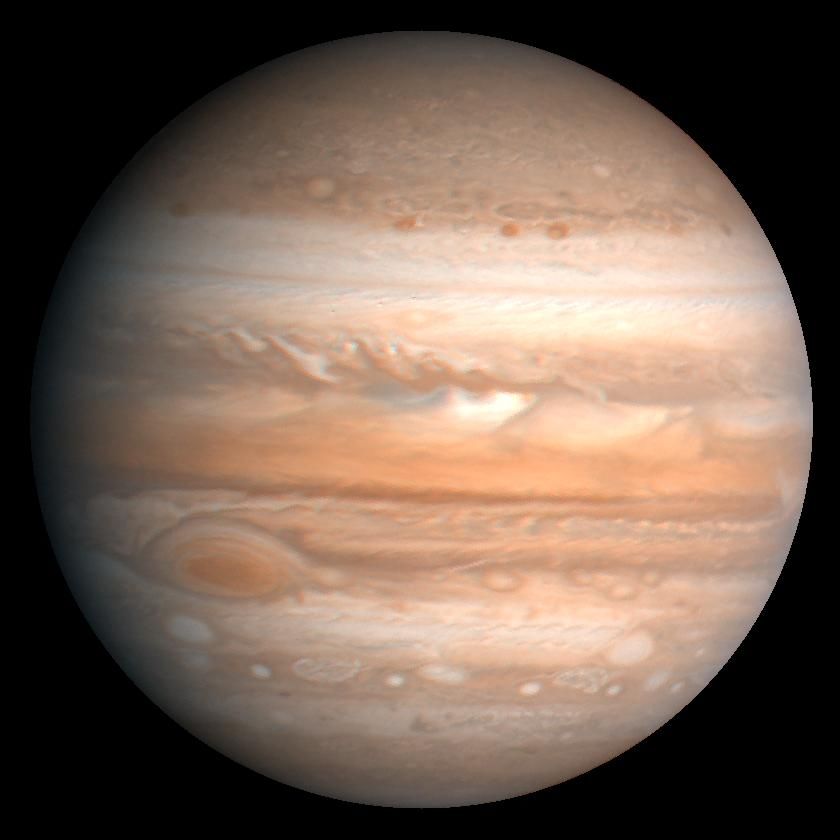
Jupiter’s south pole Cannot build theory based on first principles of physic only.
Theory needs observational guidance via comparison of observations and
theoretical predictions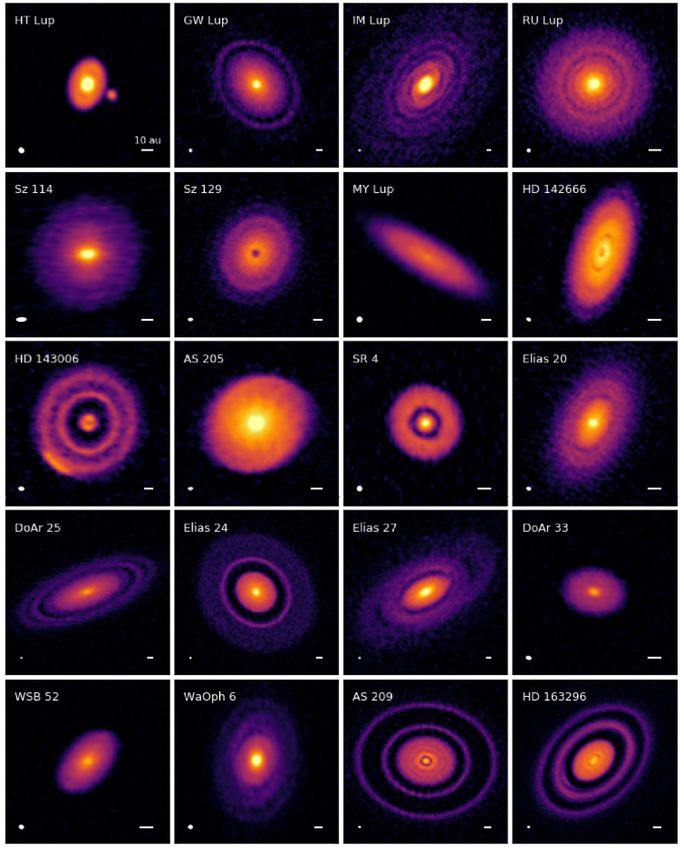
Comparing theory and observations
La Silla Observatory Chile
HARPS RV spectrograph         Compelling comparisons not so easy in practice:
                                • models for specific processes: difficult to test directly with
                                  observations. Each physical mechanism intermingles with many
                                  others. Only result of non-linearly combined action of all
                                  mechanisms observable.
                                • Often only limited knowledge about an individual exoplanet system
                                  (like period and radius / minimum mass).

Kepler Satellite (NASA)
   Transit method              But: very high number of exoplanets: they can be treated as a
                               population.
                                  • statistical constraints
                                  • data from many different techniques: much more stringent
                                    constraints on theoretical models by combining M, a, e, R, L,
                                    spectra, …

                          We need a tool to use this wealth of constraints.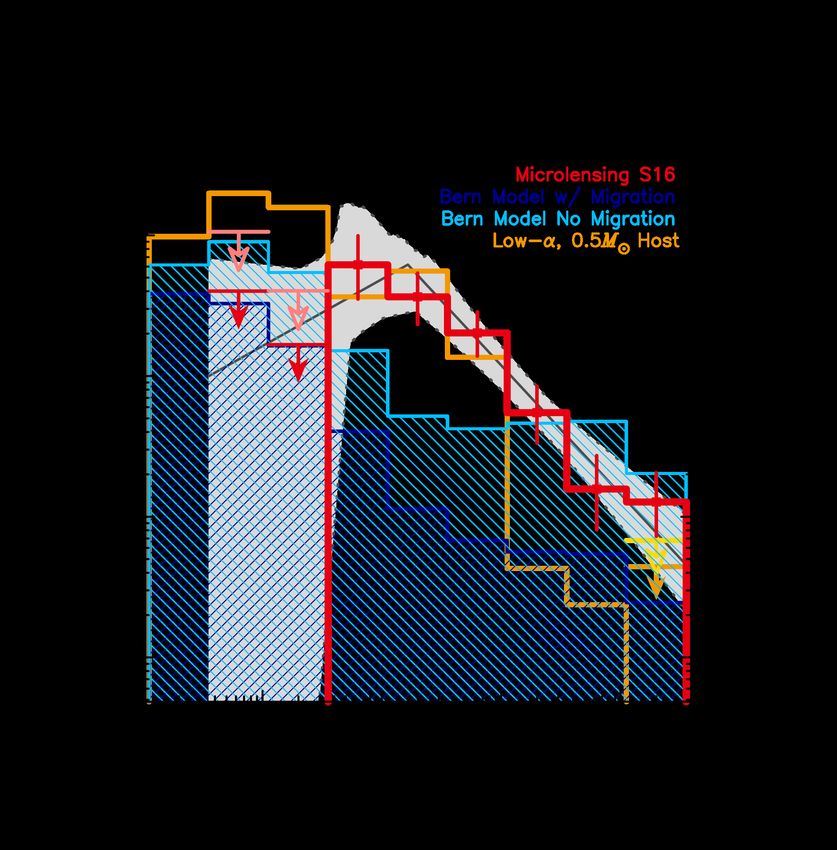
Population synthesis as a tool
Population synthesis is a tool to:
  •   use all known exoplanets to constrain planet formation and evolution models
  •   test the implications of theoretical concepts
  •   predict the yield of future instruments
  •   provide a link between theory and observations

Statistical approach rather than comparing individual systems
  •   need to compute the formation of many planetary systems
  •   the approach and the physics must be simplified (typically low-dimensional)
  •   but it must capture the key effects

  builds on all detailed studies of specific physical mechanism,
combining them into a global end-to-end formation & evolution model
  •   depends on / reflects the general progress of the field
Essential statistical constraints
                                                                                                                • period-M/R/mag diagrams
                                                                                                                  (occurrences of planet types)
                                                                                                                • Mass function P-IMF
              Suzuki et al.                                                                                     • Radius distribution, Fulton gap
 l.: The HARPS search for southern extra-solar planets
                                                            Petigura et al. 2018                                • Stellar dependencies
                                                                                                                  • [Fe/H], mass, cluster origin
                                                          Mayor et al. 2011
                                                                                                  e s e
                                                                                          ll  t h               • Eccentricity distribution
                     100
                                                                                  i n   a                       • Mass-radius relation, bulk
                                                                         x  p l a          r e  .                 composition
                                                                   t  eSuzuki  et al.ctu
                                                            n n  o
                                                               Fulton  2018 t p
                                                                        &          i 2018
                                                                            Petigura                            • Architecture (multiplicity,
                                                        c a           r e n                             o u t
                     # planets

                                                o r y         o   h e                            s  a b           peas-in-a-pod, SE-CJ relation)
                                          t h e          e  c                            l u e            .     • etc.
                                      n
                                  tio s in o          n                         Udry
                                                                                   s   c&  Santos
                                                                                                    h   m
                                                                                                     2007
                                                                                                      e
                      50
                            m   a                                            e  u            o  r t
                          r
                      fo vatio           n                  Sabotta  et
                                                                     g  i v
                                                                        al. 2021
                                                                           Reffert    et
                                                                                      l e  f
                                                                                          al.  2015
                 a y,          r                             c a  n            s i b
            To d          s  e                         , it            p  o  n
                     ob                        o
                                                    e
                                                 m et al.s2019
                                               Nielsen          r e s
                                        o r  s        i s m
                                  s t f          a  n                                 Bowler et al. 2020
                            l e a         e  c h
   1000.
                    t
                       0
                       a t         e  m 10.0                100.0
                Bu ssibl M2sini [Earth Mass]
ss]
                     po
nets in the com-      Fig. 12. Histograms of planetary masses, comparing the ob-
an already notice     served histogram (black line) and the equivalent histogram after
mass planets. We      correction for the detection bias (red line).
nets with masses
 tar mass-ratio function measured by microlensing compared
m core accretion          theory
                   tribution           population
                              is reproduced  with a black synthesis
                                                           histogram, to bemodels.
                                                                            compared The red
 d mass-ratio with
nd
                         the histogram after correction for detection incompleteness
                     distribution,          with the
                   (red histogram). In agreement           best-fit
                                                      with Kepler’s     broken
                                                                    preliminary     power-law
                                                                                find-
  ed by the solid         blacket line
                   ings (Borucki            and
                                     al. 2011),      gray shaded
                                                the sub-population       regions.
                                                                   of low-mass planet The red
 planets less 2    appears mostly confined to tight orbits. The majority of these
              mas-upper
114,  and                   limits on the mass-ratio bins without planet
     the same dis- low-mass planets have periods shorter than 100 days. Low-mass
                 Combine
 t blue histograms planets onare     constraints
                                    the
                                longer     predicted
                                       periods              from
                                                           mass-ratio
                                                are of course          all major
                                                              more a↵ected     detec- detection
                                                                             functions
                                                                            by          from    methods plus Solar System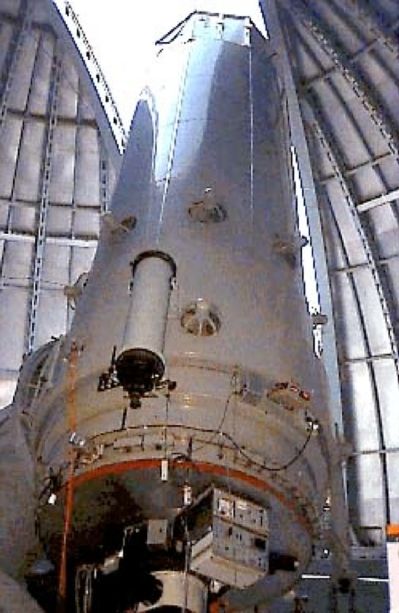
2.
Population synthesis principle
The sequential planet formation paradigm
Star formation(t=0) With protoplanetary gas disk (Class I - II) Without gas (Class III) MS End (10 Gyr)
Star & protoplanetary disk
“Gravitational instability”
? 107 years
dynamical
dust & evolution
pebbles giant
planets 109
104 years years
?
106 years “Core
108 years
accretion”
planetesimals protoplanets giant terrestrial
impacts planets
inward orbital thermodynamic &
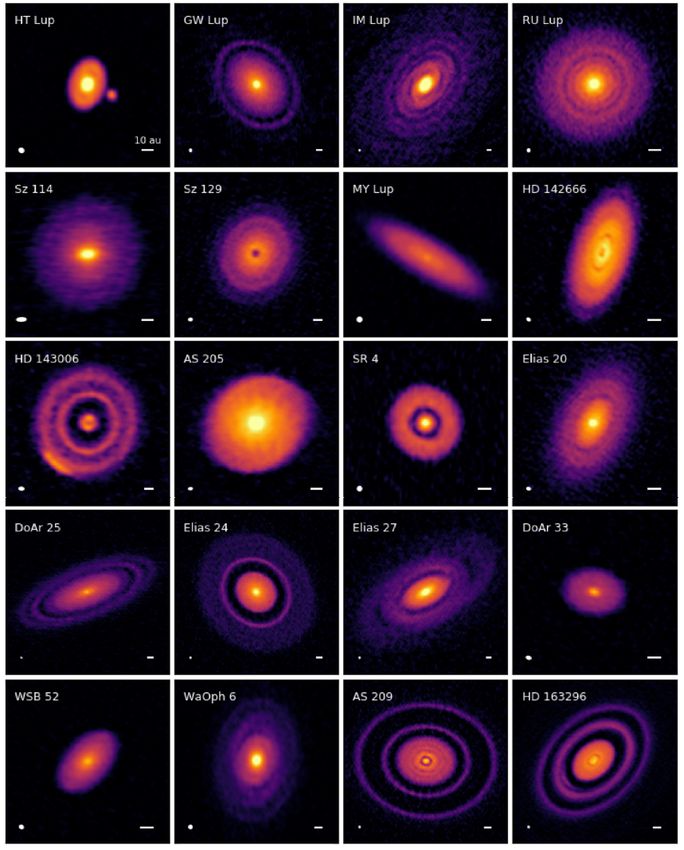
Andrews+2018
drift migration compositional evolution
Global end-to-end models should -in principle- include all these effect… a formidable taskThe essence of the method
- you need specialised models to
know what is important
- while you get the essence, you
have lost the subtlety of the original
ext
rac
- but what is left is a concentrate
t ion of many effects
pro
ces
s
specialized - and lets you see the big
models picture (hopefully)
population
synthesisDistill how strongly?
J. Hawley
106 5105 2.5105
2.5 106 105
3 106
✓ ◆
r
How simple is still good enough? (r) = 0
r0
e t/⇥The population synthesis method
Andrews+2018
Initial Conditions: Probability
Models of individual Global end-to-end form-
distributions of disk properties
processes ation & evolution model Disk gas mass
From
Disk dust mass
Accretion, migration, … Disk properties planet properties observations
Disk lifetime
Draw and compute
synthetic population
New instrumentation
better observational constraints
Apply observational
detection bias
Predictions
(going back to the full
synthetic population)
Observed population Stat.
Comparison:
Observable sub-population Model
- Frequencies solution
No match: change - Orbits, masses, radii, luminosities
- Architecture, multiplicity Match found
parameters, improve - Correlations
model, reject model …..
One learns a lot even if a synthetic population does not match the observed one!Ida & Lin 2004
Pollack et al. 1996
3.
Input physics: global modelsGlobal end-to-end models
Andrews+2018
Initial Conditions: Probability
Models of individual Global end-to-end form-
distributions of disk properties
processes ation & evolution model Disk gas mass
From
Disk dust mass
Accretion, migration, … Disk properties planet properties observations
Disk lifetime
Draw and compute
synthetic population
New instrumentation
better observational constraints
Apply observational
detection bias
Predictions
(going back to the full
synthetic population)
Observed population Stat.
Comparison:
Observable sub-population Model
- Frequencies solution
No match: change - Orbits, masses, radii, luminosities
- Architecture, multiplicity Match found
parameters, improve - Correlations
model, reject model …..
One learns a lot even if a synthetic population does not match the observed one!An early (earliest?) population synthesis Based on nebular hypothesis and core accretion paradigm: first accretion of solid cores, then accretion of gas if sufficiently massive
An early approach
Disk model: static in time, exponential profile

Accretion of solids: limited by feeding zone (restricted 3 body)

Accretion of gas: if Mcore>kcrit × Mcrit found from vtherm
“Monte carlo computer synthesis”
 Dole 1970
                                                 ~isolation mass
                                                 ~critical mass
                                                 Pre-viscous-accretion disk
                                                 theory (Lynden-Bell & Pringle 1974)

                                                 Pre-planetesimal accretion
                                                 theory (Safronov 1972)

                                                 Pre-1D planetary structure
                                                 theory (Mizuno 1978)

                                                 Pre-orbital migration theory
                                                 (Goldreich & Tremaine 1979)

                                                Reliance of global models
                                                on models for specific
-Solar System-like with ~uniform spacing in log processes … and on
-no close-in planets, no distant giant planets  observations
First modern model: Ida & Lin 2004
Ida & Lin (2004, 2005, 2008, 2010, 2013) building on Kokubo & Ida 2002, Ida & Makino 1993, …
powerlaw, exponential decrease
Disk model: static
Safonov rate
Accretion of solids: limitation equation,
by feeding isolation mass
zone
Safronov 1969, Greenzweig & Lissauer 1992, Ida & Makino 1993
Accretion of gas: ifParameterized KH-contraction,
Mcore>Mcrit found from vthermFirst modern pop. synthesis
Ida & Lin 2004
- aM: diversity
- Planetary desert
- Metallicity effect (correlation
between metallicity and giant
planet detection probability)
-termination of gas accretion
-effects of type II migrationOverview of some population synthesis models
Core accretion
• Ida & Lin Model: with planetesimals. Fast, customised for pop. synthesis.
First one-embryo per disk, then w. statistical N-body interactions.
• Similar open source model available online at https://nexsci.caltech.edu/workshop/2015/
• Bern Model: with planetesimals. Combined formation and long-term
evolution. Explicit N-body integrator. Explicit solution of underlying diff.
equations. Interior structure model.
• Lund Model (Bitsch, Johansen, Ndugu, Liu and collaborators): with
pebbles. Single embryo per disk. 2D-disk model.
• Mc Master Model (Pudritz, Alessi, Cridland, Hasegawa et al.): with
planetesimals. Disk traps, astrochemistry, interior structures.
Gravitational instability
•Forgan, Rice at al.; Nayakshin, Humphries et al.; Müller, Helled & Mayer
•Fragmentation criteria, tidal downsizing, migration, clump contraction, …
Ida & Lin 2004-2013; Mordasini et al. 2009-2015: Miguel et al. 2008, 2009; Forgan & Rice 2013; Alibert et al. 2013; Benz et al. 2014 (review); Nayakshin
et al. 2015, 2016; Alessi & Pudritz 2018; Mordasini 2018 (review); Chambers 2018, Ida et al. 2018; Forgan et al. 2018; Müller et al. 2018; Liu et al. 2019;
Ndugu et al. 2018, 2019; Alessi et al. 2020; Emsenhuber et al. 2021ab; Schlecker et a. 2020, 2021; Burn et al. 2021, Mishra et al. 2021, ….Bern Generation 3 formation & evolution model
Core accretion paradigm
Alibert et al. 2005, 2013, Mordasini et al. 2009, 2012
Benz et al. 2014, Mordasini 2018, Emsenhuber et al.
2021a,b Schlecker et al. 2021a,b, Burn et al. 2021,
Mishra et al. 2021
Emphasis of Generation III
• direct prediction of all important
observable quantities
• ability to simulate planets ranging
in mass from of Mars to super-
Planetesimal Jupiters, at all orbital distances
Sub-models
Planetesimal
Form. & evolution phase (0-10 Gyr)
Gas disk (0-τdisk Myr)
Formation phase (0-20 Myr)
Evolution phase (20 Myr - 10 Gyr)
• 1D axisym. cst. α-model w. photoevap. & irradiation (Lynden-Bell & Pringle, Hollenbach, Chiang & Goldreich, …)
• Planetesimals as a surface density with dynamical state: eccentricity, inclination (Adachi, Ohtsuki, Chambers, ..)
• Rate equation à la Safronv for planetesimal accretion rate (Safronv, Greenzweig & Lissauer, Ida & Makino, Inaba, …)
• Solution of 1D radially symmetric planetary structure equations to calculate H/He envelope internal structure and
thus gas accretion rate, radius and luminosity (Bodenheimer & Pollack), w. D burning & XUV driven atm. escape
• Outer boundary conditions for envelope structure: attached, detached, isolated (Eddington gray)
• Internal structure and radius of the solid core (modified polytropic EOS, Seager)
• Type I & type II gas disk-driven orbital migration (Lin & Papaloizou, Tremaine, Paardekooper, …)
• N-body interaction among protoplanets: scattering, collisions, capture in MMR (Newton, Chambers,…)The Gen III Bern Model of planet formation and evolution
Mishra et al. (2021)
Evolution
Simplification: rich in (micro)physics, but low dimensionality:
-Planets: spherically symmetric (internal structure resolved radially in 1D)
-Disks: rotationally symmetric (resolved 1+1D, radial and vertical direction)
Still many effects neglected: early phases for solids (e.g., Voelkel+2020), disk winds (e.g., Suzuki et al. 2010), …
Numerical simulation of 1 planetary system starting from 100 lunar mass embryos : about 3 months (mostly N-body and planetary
internal structure calculation). Long calculation time makes parameter optimisation difficult (Chambers 2018).4. Initial conditions
Initial conditions

                                                                              Andrews+2018
                                                                                             Initial Conditions: Probability
Models of individual        Global end-to-end form-
                                                                                             distributions of disk properties
processes                   ation & evolution model                                             Disk gas mass
                                                                                                                 From
                                                                                                Disk dust mass
Accretion, migration, …     Disk properties   planet properties                                                  observations
                                                                                                Disk lifetime

                                                            Draw and compute
                                                            synthetic population
                                                                                                            New instrumentation
                                                                                                            better observational constraints
                                                           Apply observational
                                                           detection bias
                                                                                                              Predictions
                                                                                                              (going back to the full
                                                                                                              synthetic population)
                    Observed population                              Stat.
                                                                  Comparison:
                                                             Observable sub-population                                   Model
                                                             - Frequencies                                               solution
              No match: change                               - Orbits, masses, radii, luminosities
                                                             - Architecture, multiplicity                   Match        found
              parameters, improve                            - Correlations
              model, reject model                                      …..

        One learns a lot even if a synthetic population does not match the observed one!
The imprint of disk properties
Planet-forming disks: large diversity too.
Observational determination of
distributions of
• Disk lifetimes (stellar cluster environ.)
• Disk gas masses
ALMA consortium Benisty+2015
• Disk dust masses
• Disk sizes
Diversity of disks (Ini-al condi-ons)
Diversity of planets (End products)
Andrews+2018
The ALMA revolution
Sta-s-cally reproducible with a
popula-on synthesis model ?NGC 6664 46 K0–M1 0 S82 this work
Monte Carlo initial conditions
References. Schmidt (1982, S82), Park et al. (2001, P01), Hartmann et al. (2005, Ha05), Kharchenko et al. (2005, K05), Mohanty et al.
The Astrophysical Journal Supplement Series, 238:19 (36pp), 2018 October (2005, M05), Sicilia-Aguilar et al. (2005, SA05), Carpenter etTychoniec
al. (2006, etC06),
al. Lada et al. (2006, L06), Jayawardhana et al. (2006, JA06),
Sicilia-Aguilar et al. (2006, SA06), Dahm & Hillenbrand (2007, D07), Briceño et al. (2007, B07), Jeffries et al. (2007, JE07), Hernández et al.
(2007, He07), Sana et al. (2007, S07), Caballero (2008, C08), Flaherty & Muzerolle (2008, FM08), Luhman et al. (2008, L08), Sicilia-Aguilar
et al. (2009, S09), Zuckerman & Song (2004, ZS04).
Haisch et al. 2001, Fedele et al. 2010
1 Metallicity N. C. Santos et al.: Statistical properties of exoplanets 367
3 Disk lifetime
assume same in star Santos et al. 2003
IR excess
and disk NGC 2024
Stellar [Fe/H] from spectroscopy. vary lifetime via Trapezium
Gaussian distribution for [Fe/H] photoevaporation
with µ ~0.0, σ~ 0.2. (e.g. Santos rate
IC 348
et al. 2003) alpha=2x10⁻³
fdg = 0.0149 ⇥ 10[Fe/H] NGC 2362
2 Disk (gas) masses Fig. 2. Left: metallicity distribution of stars with planets making part of the CORALIE planet search sample (shaded histogram) compared
Figure 11. Left: Histogram of disk masses for each evolutionary
with class, obtained
the same distribution for thewith
abouta 1000 temperature
fixed non of dust,
binary stars in theT=30
CORALIE K. Medians are shown
volume-limited samplewith dashed
(see lines,
text for more details). Right: the
From VANDAM survey of Perseus Class I disks e , 0.031
with respective colors. Median values are 0.075 Mpercentage
Class 0 and Class I values of the disk mass being function
drawn from
M , and
4 Inner disk edge
0.049
themetallicity.
of the same sample
M for
The is
Class
2.5%.axis
vertical
0, Class
Right:
I,
Accreting
and
Cumulative
represents
the total sample,
stars-frequency
distribution
the percentage as a
respectively.
function
obtained
of planet of
The
age.
viawith
hosts
statistical
New
the respect data
K-M method,
probability
ofe stars belongingeto the CORALIE search sample that have been discovered to harbor planetary mass companions
Fig. 3. (based Fig.
withCORALIE
to the total
of
4.
1σ errorssample.
plotted as a
facc (dots) versus fIRAC (squares) and exponential fit for facc (dot-
on the VIMOS survey) are shown as (red) dots, literature data as (green) ted line) and for fIRAC (dashed line).
(Tychoniec et al. 2018)
shown.
At corrotation radius. Venuti+2017 rotation periods in NGC 2264 (~3 Myr):
squares. Colored version is available in the electronic form.
suggests that we may be looking at the approximate limit on the survey (Udry et al. 2000). The metallicities for this latter sam-
He 5876 log-normal
Å in emission (EWdistribution
metallicity of the stars in the solar neighborhood. ple were computedwith from a mean of 4.74
precise calibration days
of the CORALIE and σ of 0.3 dex.
= −0.5 Å, –0.6 Å respectively). NGC 6531
Cross-Correlation Function (see Santos et al. 2002a); since the
Here we have repeated the analysis presented in Paper II,
The evidence of large Hα10% together with the He emission is
but using only the planet host stars
7
fined CORALIE sample . This sub-sample
mostincluded
likely in Initial solid mass
duethe
to well
has a total
calibrators used were the stars presented
de- mass
ongoing
of 41 ob-
in Paper I, Paper II,
accretion, and these two stars We identified 26 cluster members in NGC 6531 based on the
and this paper, the final results are in the very same scale.
are classified as accreting stars. We estimate a fraction of accret- presence of Hα emission and presence of Li. 13 other sources
jects, ∼60% of them having planets discovered in6231
the of
con-
text of the CORALIE survey itself.that
ing stars
Here we
Initial
in NGC
have
mass
included
11/75of
all
or The
15 (±5%). We warn
knowledge reader show
themetallicity
of the presencefor
distribution of stars
Li 6708
in Å, but have Hα in absorption. As in
this might be a lower limit to the actual fraction of accret-
the solar neighborhood (and includedthe
incase
the of NGC
CORALIE 6231,
sam-these might be cluster members with no
stars known to have companions with minimum solids
masses in
lowerthe
ing stars; further investigationple) disks.
is needed
permitstous
disentagle the nature
to determine or a reduced
the percentage chromospheric
of planet host stars activity. We measured the EW of Li
than ∼18 MJup ; changing this limit(accretion
to e.g. 10vsMbinarity/rapid
Jup does not rotation) of the systems
per metallicity bin. The with is seen 6708
resultlarge in Fig.Å2of thesepanel).
(right 13 sources
As and compared them with the typi-
change any of the results presented Hα below. −1
10% (>300 km s ) but lowwe EWcan perfectly see, the probability cal
[Hα]. EW of athe
of finding 26 stars
planet hostinis NGC 6531 showing also Hα emission
The fact that planets seem to orbit the mostGray: metal-richsum
stars of a strong function of its metallicity. This result confirms former
in the solar neighborhood has led some groups to build planet analysis done in Paper II and by Reid (2002). For example, here Page 5 of 7
metals in
search samples based on the high metal content of their host we can see that about 7% of the stars in the CORALIE sample
stars. Examples of these are the stars BD-10 3166 Solar
(ButlerSystem
et al. having metallicity between 0.3 and 0.4 dex have been discov-
2000), HD 4203 (Vogt et al. 2002), and HD 73526, HD 76700, ered to harbor a planet. On the other hand, less than 1% of the
HD 30177, and HD 2039 (Tinney et al. 2002). Although planets today
clearly stars having solar metallicity seem to have a planet. This result
increasing the planet detection rate, these kind of metallicity bi- is thus probably telling us that the probability of forming a giant
ased samples completely spoil any statistical study. Using only planet, or at least a planet of the kind we are finding now, de-
stars being surveyed for planets in the context of the CORALIE pends strongly on the metallicity of the gas that gave origin to
survey (none of these 6 stars is included), a survey that has the star and planetary system. This might be simple explained if
never used the metallicity as a favoring quantity for looking for we consider that the higher the metallicity (i.e. dust density of
planets, has thus the advantage of minimizing this bias. the disk) the higher might be the probability of forming a core
As we can see from Fig. 2 (left panel), the metallicity distri-
Figure 12. Similar to Figure 11, but for masses calculated using temperatures determined via Tdust=30 [K]×(Lbol/Le) (and
1/4 an higher mass core) before the disk dissipates (Pollack
. Median values are 0.073 Me, 0.033 Me,
butionrespectively.
and 0.055 Me for Class 0, Class I, and the total sample, for the planet
Wehost
findstars included
a statistical in the CORALIE
probability sam-
of 1.5% that et al.01996;
the Class Kokubo
and Class It is not trivial to derive these distributions
I disk&masses
Ida 2002).
are drawn fromOHP 1.93 m - 51 Peg b discovery 5. Detection biases
Detection bias

                                                                              Andrews+2018
                                                                                             Initial Conditions: Probability
Models of individual        Global end-to-end form-
                                                                                             distributions of disk properties
processes                   ation & evolution model                                             Disk gas mass
                                                                                                                 From
                                                                                                Disk dust mass
Accretion, migration, …     Disk properties   planet properties                                                  observations
                                                                                                Disk lifetime

                                                            Draw and compute
                                                            synthetic population
                                                                                                            New instrumentation
                                                                                                            better observational constraints
                                                           Apply observational
                                                           detection bias
                                                                                                              Predictions
                                                                                                              (going back to the full
                                                                                                              synthetic population)
                    Observed population                              Stat.
                                                                  Comparison:
                                                             Observable sub-population                                   Model
                                                             - Frequencies                                               solution
              No match: change                               - Orbits, masses, radii, luminosities
                                                             - Architecture, multiplicity                   Match        found
              parameters, improve                            - Correlations
              model, reject model                                      …..

        One learns a lot even if a synthetic population does not match the observed one!
Radial velocity detection bias
Get sub-population of observable synthetic planets
Naef et al. 2004 822 stars
Mayor et al. 2011
Elodie ~10 m/s Instrumental precision HARPS ~1 m/s
Includes effects of
- Orbital eccentricity
- Stellar metallicity, rotation rate, and jitter
- Actual measurement scheduleTransits, direct imaging, microlensing 122 Arnaud Cassan, Takahiro Sumi, Daniel Kubas
Batalha et al. 2013 Chauvin et al. 2014 Cassan et al. 2006
50%
25%
5%
2%
Transits Direct imagingFigure 2. PLANET detection efficiency Microlensing
from the 2004 season (preliminary dia
probe radii of close-in planets probe luminosities ofparameter
distant probe cold planets around
function of planet mass and orbital separation. The crosses are the detected plane
error bars.
giant planetsmore than ten years of observations (CassanM dwarfs
et al. 2008). The Fig. 2 show
nary planet detection efficiency diagram, computed from well-covered events
season.
- Accounting properly for biases is important. Otherwise, the picture might be distorted
(e.g. Hot Jupiters) 4. Summary and prospects
- Models need to predict not only masses and orbits but
Microlensing also
has radii
proven to be aand
robustmagnitudes
method to search for extrasolar plan
separations from their parent stars (⇥ 1 10 AU). It is sensitive to masses d
- Each technique probes different aspects of themass
theory: helps
of the Earth to beat
using ground the parameter
based telescopes and even capable to detect
few fractions of Earth masses when considering space-based telescope scenar
dependency of global models, a weakness of this approach.
Microlensing is also very well-suited for statistical studies on planet abund
Galaxy. In fact, the method is by essence not limited to our close solar neigh
- Once we have the detectable sub-population, towe can compare
a particular it with the actual
type of host stars.
observed one and learn if the model disagrees/agrees with the observations
References
Large surveys with a well defined bias are suited
Mao best for1991,
& Paczyński, statistical
ApJ, 374, L37 comparisonsEnd of part A
You can also read