FINDING ESSENTIAL PARTS OF THE BRAIN IN RS-FMRI CAN IMPROVE DIAGNOSING ADHD BY DEEP LEARNING - arXiv
←
→
Page content transcription
If your browser does not render page correctly, please read the page content below
F INDING ESSENTIAL PARTS OF THE BRAIN IN RS - F MRI CAN
                                                   IMPROVE DIAGNOSING ADHD BY D EEP L EARNING

                                                                 Byunggun Kim1 , Jaeseon Park1 , Taehun Kim 1 , and Younghun Kwon1,2
                                                                             1
                                                                               Department of Applied Artificial Intelligence
                                                                                    1
arXiv:2108.10137v1 [eess.IV] 14 Aug 2021

                                                                                      Department of Applied Physics
                                                                 {byunggunkim, wotjs307, taehunkim, yyhkwon}@hanyang.ac.kr
                                                                   Hanyang University, Ansan, Kyunggi-Do, 425-791, Republic of Korea

                                                                                                 A BSTRACT
                                                    Attention-Deficit/Hyperactivity Disorder(ADHD) is considered a very common psychiatric disorder,
                                                    but it is difficult to establish an accurate diagnostic method for ADHD. Recently, with the development
                                                    of computing resources and machine learning methods, studies have been conducted to classify ADHD
                                                    using resting-state functional magnetic resonance(rs-fMRI) imaging data. However, most of them
                                                    utilized all areas of the brain for training the models. In this study, as a different way from this
                                                    approach, we conducted a study to classify ADHD by selecting areas that are essential for using a
                                                    deep learning model. For the experiment, rs-fMRI data provided by ADHD-200 global competition
                                                    was used. To obtain an integrated result from the multiple sites, each region of the brain was evaluated
                                                    with ‘Leave-one-site-out’ cross-validation. As a result, when we only used 15 important region of
                                                    interest(ROIs) for training, an accuracy of 70.6% was obtained, significantly exceeding the existing
                                                    results of 68.6% from all ROIs. In addition, to explore the new structure based on SCCNN-RNN,
                                                    we performed the same experiment with three modified models: (1) Separate Channel CNN - RNN
                                                    with Attention (ASCRNN), (2) Separate Channel dilate CNN - RNN with Attention (ASDRNN), (3)
                                                    Separate Channel CNN - slicing RNN with Attention (ASSRNN). As a result, the ASSRNN model
                                                    provided a high accuracy of 70.46% when training with only 13 important region of interest (ROI).
                                                    These results show that finding and using the crucial parts of the brain in diagnosing ADHD by Deep
                                                    Learning can get better results than using all areas.

                                           Keywords ADHD · Deep learning · rs-fMRI · AAL116 · ROI

                                           1   Introduction
                                           Attention-Deficit/Hyperactivity Disorder(ADHD) is known as a psychiatric disorder that frequently appears in children.
                                           (Barkley [1997], Faraone et al. [2003], Polanczyk et al. [2007]) However, an accurate diagnostic method for ADHD is
                                           not known yet. (Barkley [1997]) To overcome this difficulty, there have been efforts to find a biomarker between healty
                                           control(HC) and ADHD. For example, functional connectivity (FC) is extracted from fMRI data based on machine
                                           learning methods. (Greicius [2008], Zhu et al. [2008], Dey et al. [2014], Guo et al. [2014], Lin et al. [2014], Sen et al.
                                           [2018], Tang et al. [2021]) They tried to classify ADHD using FC.
                                           In recent years, the models with deep neural networks (Riaz et al. [2017], Zou et al. [2017], Riaz et al. [2018], Mao
                                           et al. [2019], Zhang et al. [2020]) are also used to get the feature. These methods obtained high accuracies compared to
                                           the traditional methods. Most of the studies mentioned so far used the whole regions of the brain.
                                           However, we need to focus on the results that the difference feature between ADHD and HC might be in a specific
                                           or some of the region of interest (ROI). (Eloyan et al. [2012], Lin et al. [2014]) Therefore, it is natural that we have a
                                           question ‘Is it good to cover all brain areas in the diagnosis of ADHD through a neural network model?’
                                           In this study, we want to find a specific answer to the question. The chosen dataset, evaluation method, and models are as
                                           follows. At first, because the measure parameter was different with each site, we combined all sites of data as the training
                                           dataset to avoid biased results. Next, we evaluated the trained model with Leave-One-Site-Out Cross-validation(LOSO)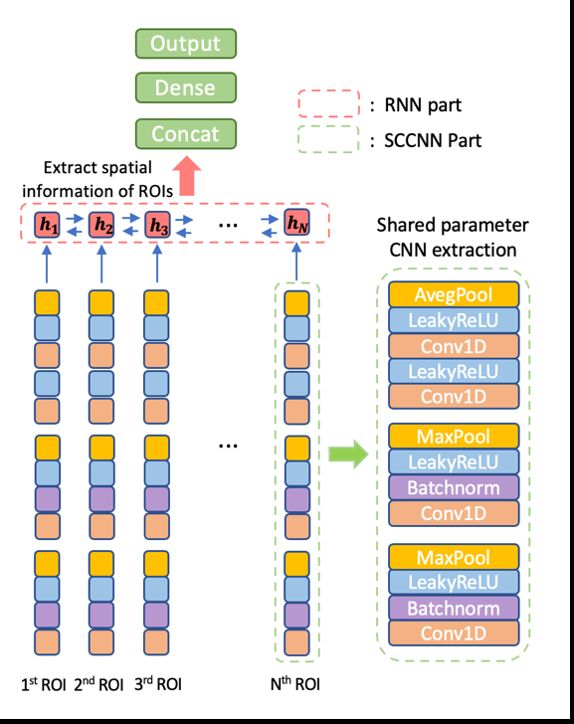
(Zhang et al. [2020]) and compared it, using the ROIs that we used for the training. The model architectures for
this experiment are ‘Separated channel CNN - RNN(SCCNN-RNN)’ proposed by (Zhang et al. [2020]) and the new
architecture based on it. Each of the models has the same number of trainable parameters regardless of the number of
ROIs. It means that we can control the variance of the result from the model capacity. So we can get a more accurate
result related to the importance of the ROIs.
The experimental procedures were also designed to examine the existence of some critical areas in the identification of
ADHD. First of all, with the SCCNN-RNN model, we examine the importance of the individual ROI by using only one
ROI feature for the model training. Then, the ROIs were ranked according to the results. In the second experiment, By
selecting some of the ranked ROI that have a considerable influence on the diagnosis of ADHD, we investigated how it
affects the classification accuracy. We found in the second experiment that using only high-ranked ROIs is much better
than using whole ROIs for the classification. We conducted experiments on three other new architecture models based
on ‘SCCNN-RNN’ to supplement this result.
In conclusion, even with a small amount of ROIs, the evaluation of the result show 70.6% accuracy. In the next 2, 3
sections, we will explain the data selection and descriptions of the models for the experiment.

2     Method

2.1   To diagnosis the ADHD, is it necessary that we take the whole regions of the brain?

As mentioned in the Introduction, several studies have been conducted to find the biomarker between HC and ADHD
patients. In recent years, the models with deep neural networks have been used to understand the biomarker. In order to
do it, they used the whole regions of the brain.
However, there were the results that the difference feature between ADHD and HC might be in a specific or some of the
ROIs. (Eloyan et al. [2012], Lin et al. [2014]) Along this line, we conduct a study to answer the question:Is it good to
cover all brain areas in the diagnosis of ADHD through a neural network model?
Fortunately, in our study, we may answer the question. As the result of our investigation, we can show that the
SCCNN-RNN model using a small amount of ROIs provides 70.6% accuracy, which exceeds the existing results of
68.6% using all ROIs.

2.2   Data selection for experiment (Why we use the AAL 116 template)

The rs-fMRI, as the 4-dimensional structure, has both spatial and temporal information of the brain. Therefore, the raw
data obtained from a single subject contains a large amount of low-dimensional (x, y, z, t) features. It means that we
need lots of data samples to learn a meaningful hidden feature of ADHD with a neural network. Fortunately, ‘Neuro
Bureau’ (Bellec et al. [2017]) provides many data samples(∼1k) preprocessed with various methods (Athena, NIAK,
Burner) used in the ADHD-200 Global competition. Nevertheless, there are some difficulties in using them directly
for the experiment. For the first reason, as we said before, The number of data samples is still small enough to use
low-dimensional data for training directly.
Furthermore, the second reason is ADHD-200 Global competition’s dataset consisted of several sites. In other words,
Each site of fMRI data was collected with different parameters of MRI devices. If one trains the model with the fMRI
data samples from the specific site, it occurs biased result to the initial setting of the measuring device.
In this study, we try to use as many data samples as possible and obtain results that are not dependent on the measuring
device. To overcome these situations, we constructed a training dataset from multiple sites together. And we extracted
feature vectors that are less sensitive to the unique biological information (phenotype) and measure parameters. In
previous studies, handcraft feature extraction (Brown et al. [2012], Dai et al. [2012]) was frequently used. However,
these can depend on the context in which the fMRI data are measured. So it is not a proper method for our situations.
For that reason, we take the Automated Anatomical Labelling(AAL 116) (Tzourio-Mazoyer et al. [2002]) for the feature
extraction method.
If we use the AAL 116 template, we expect it is possible to effectively extract features, according to contribution on the
116 interest regions (ROIs) in low-dimensional fMRI data. In summary, we choose the dataset from the five sites (NYU,
Peking, OHSU, KKI, NI) preprocessed by the NIAK pipeline(Lavoie-Courchesne et al. [2012]) from The Neuro Bureau
ADHD-200 preprocessed Repository. And then, we extract high-level features using the AAL template. Through these
processes, we showed that a specific ROI is useful for diagnosing ADHD in general fMRI data.

                                                            2
2.3 Separate Channel CNN - RNN Architecture
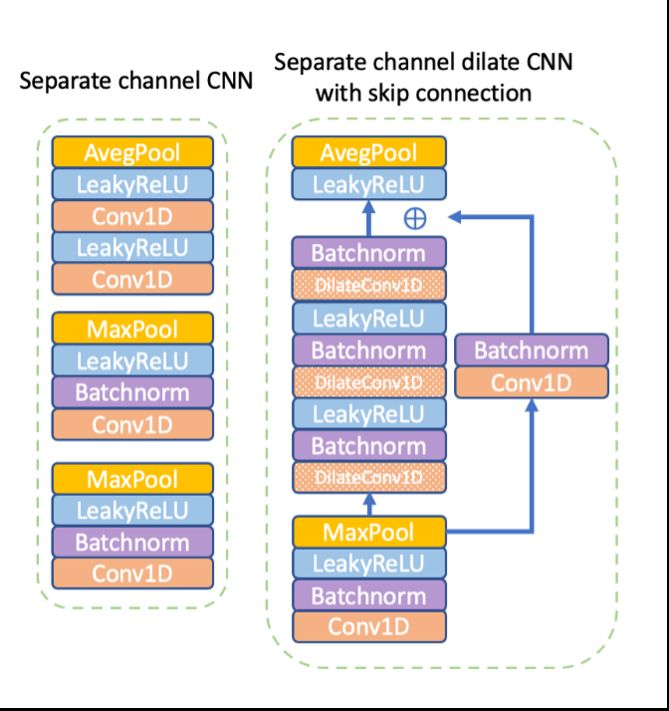
Figure 1: Architecture of SCCNN - RNN. After passing the SCCNN part that extracts the bold signal of each ROI
through convolution layers and the RNN part that learns the relationship between multiple ROIs, ADHD is determined
from the output of the last step of RNN through two fully connected layers.
As we mentioned before, we want to find out the meaningful ROIs for diagnosing ADHD and HCs. To this end, we
selected ‘the Separate Channel CNN - RNN(SCCNN-RNN)’ proposed by (Zhang et al. [2020]) as the base model
architecture for the experiment, which satisfies the following two reasons.
The first reason is that ‘SCCNN-RNN’ can extract spatial and temporal information from fMRI data. Specifically,
‘SCCNN-RNN’ can be divided into two parts with different purposes. The SCCNN part can extract the feature of the
BOLD signal in each ROI with 1-D CNN. The RNN part can learn the spatial relation of the ROIs.
And the second reason is that ‘SCCNN-RNN’ architecture can always keep the same number of learnable weights
regardless of the change in the input data dimension. For example, we train several models with different ROIs and
compare them with evaluation results. If the input’s shape changes the number of trainable parameters, the model’s
learning capacity can also be changed. It means that we compared the influence of the ROI with inconsistent results.
Therefore, to avoid this situation, we controlled the trainable parameters.
Now, we explain a detailed setting of the SCCNN-RNN for our experiments. It is shown in Fig 1. In the SC-CNN part,
we stack four layers with 1D CNN. The convolution layer’s channel number is ‘32’, ‘64’, ‘96’, ‘96’, respectively. And
the stride size is ‘1’, and the filter size is ‘3’ as common parameters on the convolution layers. In the RNN part, we used
the Bidirectional LSTM cell(Graves and Schmidhuber [2005]) because it’s mechanisms were proved the performance
in many sequence data domains such as speech recognition (Graves et al. [2013]) and language model (Sundermeyer
et al. [2012]) and so on. The hidden state numbers of each step are set to ‘128’. The output of the last T-step of the
RNN are connected with one fully connected layer with ‘128’ neurons. At last, the classification layer is put as the last
layer with a softmax activation to output the two-dimension vectors as the probability of ADHD and HCs.
As we said, the ‘SCCNN-RNN’ structure is a proper and straightforward model to learn the spatial and temporal features
from the rs-fMRI data for our experiment. Therefore, in the next section, we expand this structure to explore the more
efficient result.
2.4 Other modified models based on the ‘SCCNN - RNN’ architecture
To make the modified models from the ‘SCCNN - RNN’ structure, we applied some ideas from the speech emotion
recognition(SER) model (Meng et al. [2019], Xie et al. [2019], Peng et al. [2020]). In other words, we chose ideas of
the three different speech emotion recognition models. The reason is that speech emotion recognition using a neural
network also requires a structure for obtaining emotion information in a long sequence with a small amount of data.
It is similar to our problems. For this reason, this study was conducted to investigate the neural network structure to
obtain features from fMRI data and various SCCNN-RNN-based model structures. And it also shows that selecting and
using a region with high impact is more helpful in disease identification than using all regions.
3(a) (b) (c)
Figure 2: Differences in the proposed model architectures. (a) Separate Channel CNN - RNN with Attention (ASCRNN)
(b) Separate Channel dilate CNN - RNN with Attention (ASDRNN) (c) Separate Channel CNN - slicing RNN with
PNR
Attention(ASSRNN). All models contain the attention mechanism (ci = j=1 αij hj : attention weight, hj : output in
j step on the RNN, RN : Number of ROIs used in training) in common. In (a), only attention mechanism from SCCNN
- RNN structure is applied. In (b), the Dilate CNN and skip connection on the SCCNN part based on the ASCRNN is
applied. In (c), the slicing BiLSTM based on the ASCRNN is applied.
As you can see in Fig 2, these three modified models from ‘SCCNN-RNN’ have slight differences. However, the
attention mechanism is applied in common. The attention mechanism usually improves the performance of the models
if the training data is sequential. In ‘SCCNN-RNN’ structure, it only uses the last hidden state outputs from BiLSTM as
the next layer’s inputs. Therefore, it is structurally difficult to learn the importance of ROIs, To overcome it, we put into
the attention mechanism to focus on the important ROI with all step’s hidden states.
In the recent years, the attention mechanism has been used as several ways(Bahdanau et al. [2014], Luong et al. [2015],
Vaswani et al. [2017]). In our study, we chose attentive attention method proposed in (Zhang et al. [2020]). Specifically,
to learn the correlation between the two reference ROIs, after linear transformation of comparison vector with learnable
weight matrix , map into non-linear function is considered. It should be noted that in this study, despite using the same
method as the previous, there is difference. In (Zhang et al. [2020]), the attention was stacked after ‘SCCNN’ part. but
we stack in order of SCCNN part, RNN part, and attention mechanism. The reason for applying the attention method in
this way is to consider not only the relationship between two areas, but also the relationship between several areas. For
example, hj of jth BiLSTM’s hidden state consists of the forward hidden state ~hj ,contained with information from 1st
ROI to jth ROI, and backward hidden state h~j , contained with information from RN th ROI to jth ROI in reverse order.
And we learn the correlation αij between hi and hj with the attention layer. Therefore all ROIs that we choose can be
considered in one step. The equations 1, 2 and 3 describe the process. We call this model as ‘Separate Channel CNN -
RNN with Attention’ (ASCRNN). This attention is also applied to the two models proposed later in the same way.
h i
hj = ~hj , h~j , 1 ≤ j ≤ NR , (1)
αij = attentive (hi , hj ) (2)
NR
X
ci = αij hj (3)
j=1
The next modified model called ‘Separate Channel dilate CNN - RNN with Attention(ASDRNN)’ is focused on the
BOLD signal extraction. It differs from the SCCNN part. From previous studies (Mao et al. [2019]), it can be seen that
4learning with only the relationship within a specific frame of the BOLD signal is helpful in the diagnosis of ADHD.
With this fact, we replace the 1-D CNN with dilation 1-D CNN (Yu and Koltun [2015]). Also, to treat the gradient
vanishing problem that emerged from the deep neural networks, we applied the skip connection (He et al. [2016]) after
the last batch normalization layer. The detailed structure of Separate Channel dilated CNN can be seen in Fig 2(b) and
3. In dilation 1-D CNN, dilate rate is set as ‘2’.
Figure 3: The comparison of separate channel CNN and Separate channel dilate CNN with skip connection architectures.
Fig 2(c) is the last modified model named Separate Channel CNN - slicing RNN with Attention(ASSRNN). This model
takes a segmented area as input instead of giving the entire ROI area as input to the RNN to get the relationship between
partitioned regions. To do that, instead of BiLSTM in the ASCRNN model, we applied the slicing BiLSTM(Peng et al.
[2020]). The slicing BiLSTM’s inputs are the series of subsequences splatted from the original sequence with constant
window size(w) and stride size(l). This can be expected to focus on the relationship within the small number of ROIs
and avoid the gradient vanishing problem that may appear as the time step of the input becomes longer in the RNN
structure. This process can be found in below 4, 5 and 6 equations
NR − l
s= 0, 1, ..., d e (4)
w
[x1+sw , ..., xl+sw ] if 0 ≤ s ≤ d NRw−l e − 1
x(s) = (5)
[xNR −l+1 , ..., xNR ] else
hs = BiLST M x(s) (6)
3 Experiment Result and Discussion
3.1 Settings in Training and Evaluation
To analysis the result to choice of the ROIs, all parameters required for learning were chosen as identical ones in our
experiments. The parameter setting is based on the results obtained through the experiment. Specifically, we used Adam
optimizer (Kingma and Ba [2014]). The learning rate was chosen to be 1e-4. Xavier initialization(Glorot and Bengio
[2010]) was used as the Initialization method for all trainable weights. Also, to prevent the overfitting problem, we used
l2 regularization with factor 0.0005. The leaky ReLU (Maas et al. [2013]) with 0.1 slope coefficient was chosen as
the activation function. Next, to avoid bias due to an imbalanced dataset corresponding to ADHD and HC, the same
number of each class (ADHD, HC) was sampled for all mini-batch. The mini-batch size was set to be 32. And then,
we set binary cross entropy for the loss function. The evaluation method of the accuracy of the models was chosen by
5NYU Peking OHSU KKI NI Total
ADHD 147 101 43 25 36 352
HC 110 143 70 69 37 429
Total 257 244 133 94 73 781
Table 1: The data composition of each site that we used in our experiments
‘Leave-one-site-out cross validation(LOSO)’. By proceeding with the evaluation with the data set of another site not
used for training the model, it is possible to avoid the dependent characteristics (parameters of the measurement device).
And the experiment results for the ROIs that play an essential role in diagnosis can be general.
3.2 Detail of the dataset composition
We used rs-fMRI data samples provided by the ADHD-200 competition (Bellec et al. [2017]) for the experiment. They
consist of the data from eight institutions (NYU : New York University child study center, Peking : Peking University,
OHSU : Oregon Health Sciences University, KKI : Kennedy Krieger Institute, NI : NeuroIMAGE, BHBU : Bradley/
Brown University, Pitt : University of Pittsburgh, WUSTL : Washington University at Saint Louis) Among them,
BHBU, Pitt, and WUSTL are difficult to use for supervised learning, so five other sites (NYU, Peking, OHSU, KKI, NI)
are used. Moreover, to compensate for the lack of data, all data (training data, test data) of each site were combined and
considered one site dataset. So, the overall structure of the data we used is shown in Table 1. And rs-fMRI sample is
preprocessed, as we mentioned before. See in section 2.2.
3.3 Analysis selecting an important region of the brain according to AAL 116 ROI using a neural network
model of SCCNN-RNN
To determine the importance of individual ROIs for ADHD discrimination, we evaluated the accuracy through
independent neural network model trained with specific ROI. For the experiment, we used ‘SCCNN-RNN’ models
with LSTM. Fig 4 shows the diagnosis accuracy trained with specific ROI. The distribution of the accuracy obtained
in the experiment is in a large range(minimum accuracy : 61.93% with index=77, minimum accuracy : 68.47% with
index=28). This indicates a meaningful result when learning with only one ROI because it has fewer fMRI features than
all ROIs. It can be expected that there may be a region that plays an important role in discriminating ADHD. Based on
these results, in next experiment, we will show how learning by selecting a few important ROIs differs from using all
ROIs.
Figure 4: The accuracy according to individual ROI when we trained the SCCNN-RNN with only one individual ROI.
3.4 Accuracy analysis for ADHD discrimination according to ROI ranking in SCCNN-RNN
The experiment is performed to determine how the association between important ROIs can be understood in the ADHD
discrimination. The specific progress of the experiment is as follows. According to the ROI ranking from the result
6of section 3.3 , the regions at the top are selected sequentially, and the number of ROI features is gradually increased.
And the experiment is carried out with the independent neural network models. Also, the same model(SCCNN-RNN)
is used in order to reduce the difference that will appear due to the change in the number of parameters of the neural
network model according to the increase of the input’s data size.
Fig 5 shows the result of the model’s accuracy trained with ranking ROIs. From the (blue line) on Fig 5, two facts can
be observed. First, it can be confirmed that high accuracy is obtained when learning by selecting ROIs in a certain order
is performed, where the learning is done by selecting ROIs in the order obtained. It can be seen that some ROIs play an
important role for the diagnosis. As shown in Fig 5, the ranking that achieves high accuracy is the case of using the
ROI in the top 20. In particular, an accuracy of 70.6% was obtained when ROI up to 15th Rank was used for training.
Another fact is that as the ROI used for learning increases, it is hard to tell areas that provide higher results than before.
This means that using lots of ROIs can be a hindrance in diagnosing ADHD. When selecting the ROI in reverse order,
we can see the results with the (orange line) on Fig 5. Relatively low accuracy is obtained when using up to 20th rank
of reverse ranks, but it can be seen that the accuracy tends to be increased when gradually more ROIs is used. In other
words, It means that learning with ROIs of low importance determined by accuracy does not help much in the diagnosis,
but if the number of ROIs used for subsequent learning increases, it could be helpful. That is, ROIs with a high rank
complement ROIs with a low rank.
Figure 5: The accuracy as we increase the number of learning ROIs when we trained the SCCNN-RNN. (blue line) The
accuracy in the case of learning by selecting in order of ROIs with the highest Rank. (orange line) The accuracy in the
case of learning by selecting in order of ROI with the lowest Rank
3.5 Accuracy analysis for ADHD discrimination according to ROI ranking in modified models
To investigate the impact on importance of ROI, we perform experiments with other modified models (ASCRNN,
ASDRNN, ASSRNN) that we mention in section 2.4. The experiment is performed in the same way as described in
section 3.4. However, the number of ROI used for learning was up to the 20th rank, as a result of Fig5. With Fig 6 and
Table 2, we can describe the result as follows:First, when learned with selected ROIs according to its rank, higher results
can be expected than using all ROIs. Further, all models provide accuracy around 68% to 70% despite using fewer
areas than all 116 areas. In particular(Table 2), in the case of SCCNN-RNN and ASSRNN, the accuracies of 70.6(15)%
and 70.46(13)% can be obtained, which are exceeding 70% accuracy. This is a result that exceeds the previous result
(68.6%) by 2%. Second (Fig 6), with all the modified models based on SCCNN-RNN, the number of ROIs providing
good accuracy lies between 10 and 20. This is slightly different from the case where only a small number of areas (ex.
1-5 rank ROI) are used. To summarize, it seems that a specific part of the brain must be used to improve the diagnosis.
The best accuracy was obtained for the simplest model(SCCNN - RNN). There is an improvement of about 7%, in the
case of using ROIs with higher rankings.
4 Conclusion
Recently, the diagnosis accuracy of ADHD and HC has been gradually improved with rs-fMRI data through deep
learning methods. However, there is difficulty improving the performance of deep learning. Even though there are many
reasons, one of them is the limitation of medical data related to ADHD. Also, it is hard to find the medical biomarker
7Figure 6: The accuracy when we trained the other modified models(ASCRNN, ASDRNN, ASSRNN) as we increase
the number of ROIs based the rank order
LOSO accuracy with specific ROIs
Proposed paper Model name LOSO accuracy with all ROls
(Number of ROIs used in the experiment)
Riaz et al. [2017] FCNet 60.4 -
Riaz et al. [2018] DeepfMRI 67.9 -
Zhang et al. [2020] SCCNN - Attention 68.6 -
Zhang et al. [2020] SCCNN - RNN 63.6 70.6(15)
- ASCRNN 65.2 69.97(20)
- ASDRNN 68.4 68.05(17)
- ASSRNN 66.86 70.46(13)
Table 2: Comparison of accuracy in ADHD-200 classification models using AAL template
that distinguishes between ADHD and normal. Nevertheless, rs-fMRI data are frequently used because they contain
various information about the brain. In this study, we showed that finding ROI providing important areas in the brain
can help diagnose ADHD. Moreover, it was found that only using 15 ROIs in the importance order can provide a more
outstanding performance improvement (70.6%) in the diagnosis than using all areas. It implies that establishing the
good criteria for the importance of the ROI can give diagnostic accuracy. Thus, we will consider a critical area detection
method using deep neural networks in the future study. Further, in deep learning models, their decision process seems
to be a black box. However, this can be a major drawback in diagnosing diseases. Therefore, we will look at how deep
learning models can understand ADHD by studying the decision process of various deep learning models.
Acknowledgments
This work is supported by the Basic Science Research Program through the National Research Foundation of Korea
funded by the Ministry of Education, Science and Technology (NRF2018R1D1A1B07049420) and Institute of Infor-
mation & communications Technology Planning & Evaluation(IITP) grant funded by the Korea government(MSIT)
(No.2020-0-01343, Artificial Intelligence Convergence Research Center (Hanyang University ERICA).
References
D. Bahdanau, K. Cho, and Y. Bengio. Neural machine translation by jointly learning to align and translate. arXiv
preprint arXiv:1409.0473, 2014.
R. A. Barkley. Behavioral inhibition, sustained attention, and executive functions: constructing a unifying theory of
adhd. Psychological bulletin, 121(1):65, 1997.
P. Bellec, C. Chu, F. Chouinard-Decorte, Y. Benhajali, D. S. Margulies, and R. C. Craddock. The neuro bureau adhd-200
preprocessed repository. Neuroimage, 144:275–286, 2017. ISSN 1053-8119.
8M. R. Brown, G. S. Sidhu, R. Greiner, N. Asgarian, M. Bastani, P. H. Silverstone, A. J. Greenshaw, and S. M. Dursun.
Adhd-200 global competition: diagnosing adhd using personal characteristic data can outperform resting state fmri
measurements. Frontiers in systems neuroscience, 6:69, 2012. ISSN 1662-5137.
D. Dai, J. Wang, J. Hua, and H. He. Classification of adhd children through multimodal magnetic resonance imaging.
Frontiers in systems neuroscience, 6:63, 2012. ISSN 1662-5137.
S. Dey, A. R. Rao, and M. Shah. Attributed graph distance measure for automatic detection of attention deficit
hyperactive disordered subjects. Frontiers in neural circuits, 8:64, 2014. ISSN 1662-5110.
A. Eloyan, J. Muschelli, M. B. Nebel, H. Liu, F. Han, T. Zhao, A. D. Barber, S. Joel, J. J. Pekar, and S. H. Mostofsky.
Automated diagnoses of attention deficit hyperactive disorder using magnetic resonance imaging. Frontiers in systems
neuroscience, 6:61, 2012. ISSN 1662-5137.
S. V. Faraone, J. Sergeant, C. Gillberg, and J. Biederman. The worldwide prevalence of adhd: is it an american
condition? World psychiatry, 2(2):104, 2003.
X. Glorot and Y. Bengio. Understanding the difficulty of training deep feedforward neural networks. In Proceedings of
the thirteenth international conference on artificial intelligence and statistics, pages 249–256. JMLR Workshop and
Conference Proceedings, 2010.
A. Graves and J. Schmidhuber. Framewise phoneme classification with bidirectional lstm and other neural network
architectures. Neural networks, 18(5-6):602–610, 2005.
A. Graves, A.-r. Mohamed, and G. Hinton. Speech recognition with deep recurrent neural networks. In 2013 IEEE
international conference on acoustics, speech and signal processing, pages 6645–6649. Ieee, 2013.
M. Greicius. Resting-state functional connectivity in neuropsychiatric disorders. Current opinion in neurology, 21(4):
424–430, 2008. ISSN 1350-7540.
X. Guo, X. An, D. Kuang, Y. Zhao, and L. He. Adhd-200 classification based on social network method. In International
Conference on Intelligent Computing, pages 233–240. Springer, 2014.
K. He, X. Zhang, S. Ren, and J. Sun. Deep residual learning for image recognition. In Proceedings of the IEEE
conference on computer vision and pattern recognition, pages 770–778, 2016.
D. P. Kingma and J. Ba. Adam: A method for stochastic optimization. arXiv preprint arXiv:1412.6980, 2014.
S. Lavoie-Courchesne, P. Rioux, F. Chouinard-Decorte, T. Sherif, M.-E. Rousseau, S. Das, R. Adalat, J. Doyon,
C. Craddock, D. Margulies, et al. Integration of a neuroimaging processing pipeline into a pan-canadian computing
grid. In Journal of Physics: Conference Series, volume 341, page 012032. IOP Publishing, 2012.
P. Lin, J. Sun, G. Yu, Y. Wu, Y. Yang, M. Liang, and X. Liu. Global and local brain network reorganization in
attention-deficit/hyperactivity disorder. Brain imaging and behavior, 8(4):558–569, 2014. ISSN 1931-7565.
M.-T. Luong, H. Pham, and C. D. Manning. Effective approaches to attention-based neural machine translation. arXiv
preprint arXiv:1508.04025, 2015.
A. L. Maas, A. Y. Hannun, and A. Y. Ng. Rectifier nonlinearities improve neural network acoustic models. In ICML
Workshop on Deep Learning for Audio, Speech, and Language Processing, 2013.
Z. Mao, Y. Su, G. Xu, X. Wang, Y. Huang, W. Yue, L. Sun, and N. Xiong. Spatio-temporal deep learning method for
adhd fmri classification. Information Sciences, 499:1–11, 2019. ISSN 0020-0255.
H. Meng, T. Yan, F. Yuan, and H. Wei. Speech emotion recognition from 3d log-mel spectrograms with deep learning
network. IEEE access, 7:125868–125881, 2019.
Z. Peng, X. Li, Z. Zhu, M. Unoki, J. Dang, and M. Akagi. Speech emotion recognition using 3d convolutions and
attention-based sliding recurrent networks with auditory front-ends. IEEE Access, 8:16560–16572, 2020.
G. Polanczyk, M. S. De Lima, B. L. Horta, J. Biederman, and L. A. Rohde. The worldwide prevalence of adhd: a
systematic review and metaregression analysis. American journal of psychiatry, 164(6):942–948, 2007.
A. Riaz, M. Asad, S. M. R. Al-Arif, E. Alonso, D. Dima, P. Corr, and G. Slabaugh. Fcnet: a convolutional neural
network for calculating functional connectivity from functional mri. In International Workshop on Connectomics in
Neuroimaging, pages 70–78. Springer, 2017.
A. Riaz, M. Asad, S. M. R. Al Arif, E. Alonso, D. Dima, P. Corr, and G. Slabaugh. Deep fmri: An end-to-end deep
network for classification of fmri data. In 2018 IEEE 15th International Symposium on Biomedical Imaging (ISBI
2018), pages 1419–1422. IEEE, 2018.
B. Sen, N. C. Borle, R. Greiner, and M. R. Brown. A general prediction model for the detection of adhd and autism
using structural and functional mri. PloS one, 13(4):e0194856, 2018. ISSN 1932-6203.
9M. Sundermeyer, R. Schlüter, and H. Ney. Lstm neural networks for language modeling. In Thirteenth annual
conference of the international speech communication association, 2012.
Y. Tang, C. Wang, Y. Chen, N. Sun, A. Jiang, and Z. Wang. Identifying adhd individuals from resting-state functional
connectivity using subspace clustering and binary hypothesis testing. Journal of attention disorders, 25(5):736–748,
2021. ISSN 1087-0547.
N. Tzourio-Mazoyer, B. Landeau, D. Papathanassiou, F. Crivello, O. Etard, N. Delcroix, B. Mazoyer, and M. Joliot.
Automated anatomical labeling of activations in spm using a macroscopic anatomical parcellation of the mni mri
single-subject brain. Neuroimage, 15(1):273–289, 2002. ISSN 1053-8119.
A. Vaswani, N. Shazeer, N. Parmar, J. Uszkoreit, L. Jones, A. N. Gomez, Ł. Kaiser, and I. Polosukhin. Attention is all
you need. In Advances in neural information processing systems, pages 5998–6008, 2017.
Y. Xie, R. Liang, Z. Liang, C. Huang, C. Zou, and B. Schuller. Speech emotion classification using attention-based
lstm. IEEE/ACM Transactions on Audio, Speech, and Language Processing, 27(11):1675–1685, 2019.
F. Yu and V. Koltun. Multi-scale context aggregation by dilated convolutions. arXiv preprint arXiv:1511.07122, 2015.
T. Zhang, C. Li, P. Li, Y. Peng, X. Kang, C. Jiang, F. Li, X. Zhu, D. Yao, and B. Biswal. Separated channel attention
convolutional neural network (sc-cnn-attention) to identify adhd in multi-site rs-fmri dataset. Entropy, 22(8):893,
2020.
C.-Z. Zhu, Y.-F. Zang, Q.-J. Cao, C.-G. Yan, Y. He, T.-Z. Jiang, M.-Q. Sui, and Y.-F. Wang. Fisher discriminative
analysis of resting-state brain function for attention-deficit/hyperactivity disorder. Neuroimage, 40(1):110–120, 2008.
ISSN 1053-8119.
L. Zou, J. Zheng, C. Miao, M. J. Mckeown, and Z. J. Wang. 3d cnn based automatic diagnosis of attention deficit
hyperactivity disorder using functional and structural mri. IEEE Access, 5:23626–23636, 2017. ISSN 2169-3536.
10You can also read