Expanded Bruker Strategy and TAM - Bruker 2021 and Beyond: Project Accelerate 2.0
←
→
Page content transcription
If your browser does not render page correctly, please read the page content below

Bruker 2021 and Beyond: Project Accelerate 2.0

Expanded Bruker Strategy and TAM
- Unbiased Proteomics and Multiomics
- Spatial Biology and Single-Cell Multiomics
- Microbiology and Molecular Diagnostics

JP Morgan 2021 Healthcare Conference
Frank H. Laukien, President & CEO
January 11, 2021

© Bruker Corporation                           Innovation with Integrity
Bruker Corporation Safe Harbor Statement
Any statements contained in this presentation that do not describe historical facts may constitute forward-looking statements within
the meaning of Section 27A of the Securities Act of 1933, as amended, and Section 21E of the Securities Exchange Act of 1934, as
amended, including statements regarding management’s expectations for preliminary 2020 results and for future financial and
operational performance; expected growth and business outlook, including market size, growth and market position; statements
regarding our business and investment focus; expected success of our portfolio or technology investments, including our Project
Accelerate initiatives; product launches; and capital expenditures. These statements include words such as “anticipate”, “expect”,
“estimate”, “future”, “plan”, “goals”, and similar terms. Forward-looking statements are based on current expectations, forecasts and
assumptions of our management and are subject to risks and uncertainties that could cause actual results to differ materially from
those indicated, including, but not limited to, risks and uncertainties relating to: the length and severity of the COVID-19 pandemic; the
impact of the pandemic on global economic conditions and the length and severity of any resulting recession; adverse changes in
conditions in the global economy and continued volatility in the capital markets; the integration of businesses we have acquired or
may acquire; fluctuations in foreign currency exchange rates; our ability to successfully implement our restructuring initiatives and cost
reduction initiatives; our ability to improve operating margins, profitability and cash flow; changing technologies; product
development and market acceptance of our products; the cost and pricing of our products; competition; loss of key personnel;
dependence on collaborative partners, key suppliers and contract manufacturers; capital spending and government funding policies;
changes in governmental regulations; the use and protection of intellectual property rights, litigation and other risk factors discussed
from time to time in our filings with the Securities and Exchange Commission, or SEC. These and other factors are identified and
described in more detail in our most recent reports filed with the SEC, including, without limitation, our annual report on Form 10-K
for the year ended December 31, 2019, our most recent quarterly reports on Form 10-Q and our current reports on Form 8-K. We
expressly disclaim any intent or obligation to update these forward-looking statements other than as required by law.
                                                                                                                                         2
Bruker Preliminary FY 2021 Outlook
Strong YoY revenue growth, margin expansion and EPS growth expected in FY 2021

  Preliminary Q4 2020 Revenue:
                                                                             Preliminary FY 2021 Year-over-year Outlook(1)(2):
  • We currently expect Q4 2020
    revenue of $620 - $625 million,
    including ~4.5% FX tailwind.                                           • Expect organic revenue growth in high single digits

                                                                           • Expect non-GAAP EPS of at least $1.60.
  • Sequential QoQ recovery in 2020
                                                                             (>20% YoY growth vs. current FactSet consensus for FY 2020)
  • Expected Q4 2020 YoY growth of                                         • We currently expect to issue financial guidance for FY 2021,
    +3% to +4% stronger than                                                 when we report our Q4 and FY 2020 results in February.
    previous scenarios of -2% to -6%.
(1) All  year-over-year increases compared to FY 2020 results, which we expect to release in February 2021.
(2)   Assuming no dramatic deterioration of the COVID-19 pandemic, including further hard lockdowns in key markets, and steady progress with vaccinations.
Because the Company’s financial statements for the fiscal year ended December 31, 2020 have not yet been finalized or audited, the preliminary statement regarding the Company’s
expectations regarding its fiscal year 2020 revenue and FX tailwind are subject to change, and the Company’s actual revenue growth for this period may differ materially from this
preliminary estimate. Accordingly, you should not place undue reliance on this preliminary estimate.
Reconciliation of non-GAAP financial measures to the most directly comparable GAAP measures is available at the end of this presentation.                                        3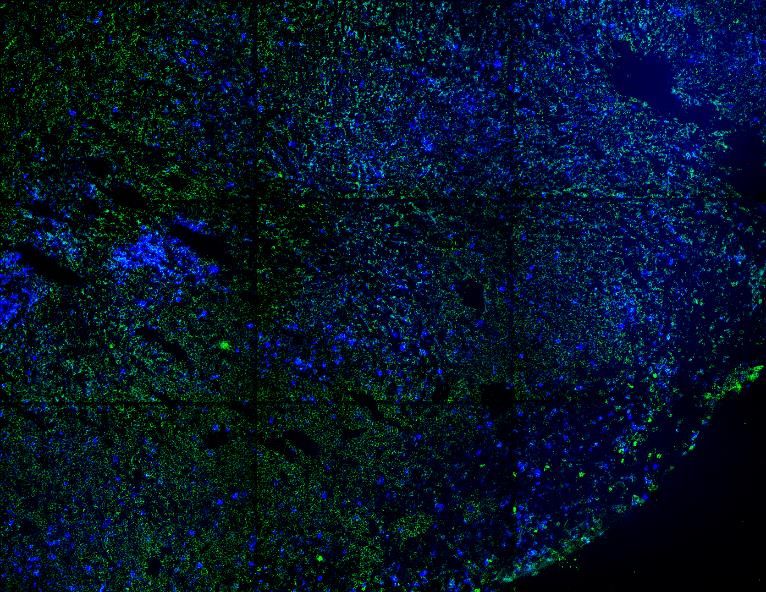
Introducing Project Accelerate 2.0
 High Value                                                      Expanded Strategy & Incremental TAMs:
                Innovative                                       • Unbiased Proteomics & Multiomics: $5-6B TAM
                         Differentiated
                                                                 • Spatial Biology & Single-Cell Multiomics: $3-5B TAM
        Life Science Tools &
                                                                 • Microbiology & Molecular Dx: ~$20B TAM
        Diagnostic Solutions                                          TAM = total addressable market

timsTOF® Platform:     Microscopy &      MALDI Biotyper & PCR:    High-field NMR:                NMR and MS:      Leading Nano Tools:
  4D Proteomics         Cytometry:       Clinical Microbiology Functional Structural           Unique Biopharma   Materials Research,
 4D Metabolomics     Spatial Biology &    & Infectious Disease Biology, Translational            Solutions for      Next-Gen Semi
Tissue SpatialOMx Single-Cell Multiomics     Molecular Dx           Phenomics                      Biologics          Metrology
                                                                                                                                 4
Bruker’s Dual Strategy:
                                                        • Transforming our portfolio for
Project Accelerate 2.0 & Operational Excellence
                                                          attractive secular growth trends
drive customer success and profitable growth
                                                        • Driving key product innovation cycles
                                                        • Six high-growth, high-margin
                                                          Project Accelerate 2.0 initiatives
                          Profitable                      with expanded scope and TAMs
                           Growth
                                                        • Positioning company for break-out
                                                          opportunities in proteomics and
                                                          spatial & single-cell biology
             Portfolio                       Cost       • Operational Excellence, including
                                                          commercial and R&D excellence
                    Commercial Excellence               • Managing core for profitable growth
                                                          and gains in market share
                   Product R&D Excellence

                    Operational Excellence             Bruker well-positioned in diverse and
                                                       attractive life science tools and
        Bruker Core Value: Innovation with Integrity   molecular diagnostics markets.
                                                                                                  5
Project Accelerate 2.0
Faster growth from six expanded
high-growth, high-margin initiatives                  Unbiased                          Unbiased 4D Proteomics &
                                                    Proteomics &                        4D Multiomics, Functional
                                                     Multiomics                         Structural Biology
 Consumables, Software,
 Service & Aftermarket                                                                 MS and NMR solutions for
                                                                      Biopharma &      proteomics, multiomics, tissue
Consumables, assays, services,     Aftermarket                                         SpatialOMx, functional
                                                                         Applied
libraries & scientific software                                                        structural biology, biomolecular
                                                                                       condensates

                                                                                        Biopharma & Applied
 Next-gen Nanomaterials
 Research & Semi Metrology                                                             High-value NMR, MS and
                                                                                       FTIR/NIR solutions for drug
Enabling R&D and QC of next-                                                           discovery, development and
gen logic, memory, displays,                                                           pharma PAT; Applied food
renewable energy, nanotools       Next-gen Nano                       Microbiology &   analysis and forensics
and nanomaterials                  & Semi Tools                        Molecular Dx

                                                                                        Microbiology, Viral &
 Spatial Biology & Single-Cell                                                          Molecular Diagnostics
 Targeted Multiomics                              Spatial Biology &
                                                     Single-Cell                       High-value solutions for faster,
Next-gen super-res microscopy                                                          accurate and broadly scalable
& cytometry for immunology,                         Multiomics
                                                                                       infectious disease diagnostics,
oncology, single-cell and                                                              now including viral MDx
subcellular spatial biology and
targeted multiomics                                                                                                   6
Project Accelerate 2.0
     Expanded Strategic Scope and Incremental TAMs for Bruker
                      Unbiased Proteomics                                                                       Spatial Biology &                                            Microbiology &
                        & Multiomics(1)                                                                      Single-Cell Multiomics(2)                                       Molecular Dx(3)
                                                                                                                                                                    Bruker TAM:
                                                                 Overall TAM:                                                                                           $4B
Bruker TAM:                                                                                                                                            Overall TAM:
                                                                    $5-6B
    $2B                                                                                                                                                   $3-5B
                                                                                 Bruker TAM:
                                                                                     $1B

                                                                                                                                                                                                                                Overall TAM:
                                                                                                                                                                                                                                   $20B

(1)Proteomics
            & Multiomics Overall TAM includes proteomics instrumentation, unbiased tissue spatialomics and multiomics tools, and relevant portion of HPLC markets. Proteomics reagents not included. Genomics markets not included.
Bruker Unbiased Proteomics & Multiomics TAM includes MS-based proteomics, structural biology by NMR, single crystal diffraction, SPR and unbiased tissue spatialomics with mass spec read-out.
(2)Spatial
        Biology & Single-Cell Analysis Overall TAM includes relevant single-cell targeted analysis systems, relevant portion of high content imaging and flow cytometry markets, relevant portion of immunohistochemistry markets, and fluorescence
microscopy. Bruker Spatial Biology & Targeted Single-Cell Multiomics TAM includes spatial cell marker immuno-profiling for suspended cells and tissues, targeted proteomics, subcellular, single-cell and tissue and fluorescence microscopy.
(3)Microbiology
              and Molecular DX Overall TAM includes bacterial and fungal identification, antibiotic susceptibility testing, molecular diagnostics, viral diagnostics, COVID-19 diagnostics and hospital hygiene testing.
Bruker Microbiology and Infectious Disease (ID) Molecular DX TAM includes bacterial and fungal identification and relevant portions of antibiotic susceptibility testing, molecular diagnostics, COVID-19 diagnostics and hospital hygiene markets.
Sources: Bruker estimates, SDi Global Assessment Report, Frost & Sullivan, DeciBio and various industry reports.                                                                                                                                      7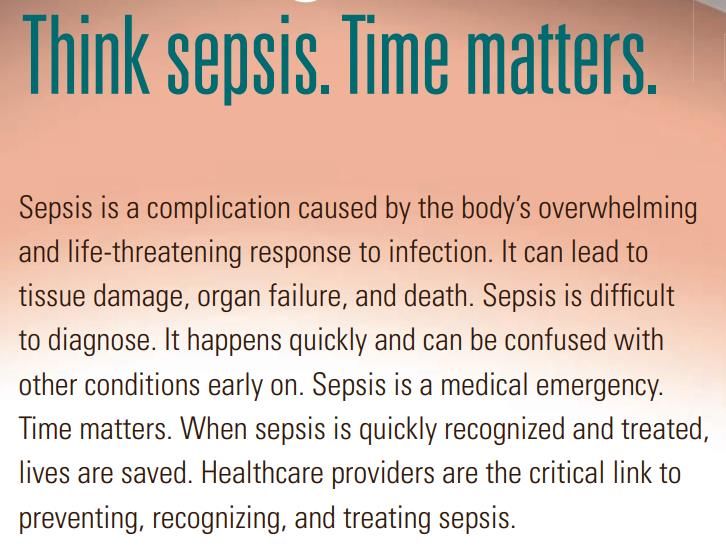
Unbiased 4D Proteomics by TIMS/PASEF
 timsTOF is unlocking the transformative                                                Pioneering Unbiased 4D
 power of CCS-enabled, deep 4D proteomics:                                              Proteomics for Large Cohort Validation
                                                            Large-cohort plasma          •   Excellent speed and robustness for >50 runs/day
                                                            proteomics, PTMs
                                                                                         •   CCS-enabled 4D TIMS/PASEF for greater depth
          $750M                                             Tissue & cell culture
          SAM*                                              proteomics, PTMs             •   timsTOF flex MALDI imaging cell or tissue selection
                                                                                             for deep unbiased spatial proteomics
   Expect Bruker
   SAM* to go up                                            Biopharma proteomics,
    more than 2x
                                                            PTMs, mAbs, ADC, HCPs        H1-2022: unbiased quantitative true single-cell
                                                                                         proteomics (SCP) complements SC-RNA-seq
                                                                                         •   Early access customers in H2-2021
                                                            Cancer multiomics,
              timsTOF installed base                                                     •   Breakthrough paper by Mann-group: unbiased,
                                                            liquid biopsy proteomics,
                now at >250 units                                                            quantitative true single-cell proteomics (SCP)
                                                            cancer glycomics
                                                                                         •   Single-cell protein and RNA levels different; proteomics
                                                                                             yields quantitative SC biology
                                                            Quantitative, true           •   Cellular proteomes have high copy numbers for
                                                            single-cell proteomics           meaningful quantitative SCP (vs. sparse SC-RNA)
*Bruker internal estimates.
SAM = Bruker served addressable market for proteomics MS.
                                                                                                                                                        8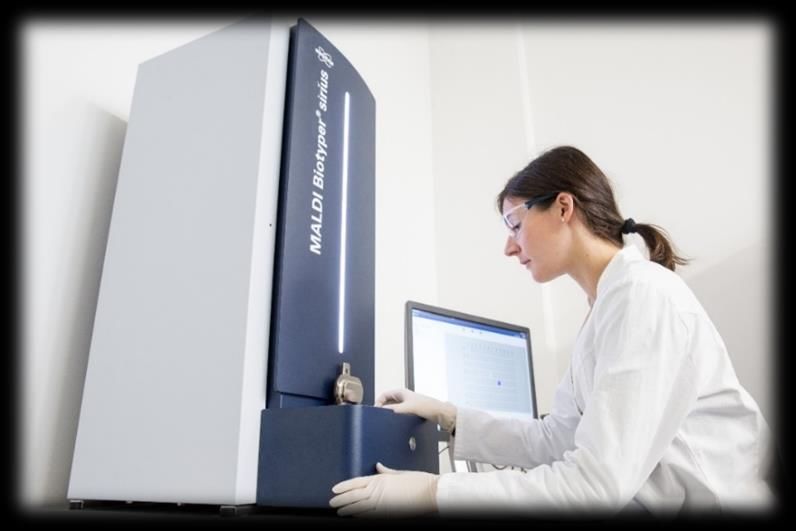
Unbiased 4D Proteomics by TIMS/PASEF
                                            •   Novel MALDI-2 option for timsTOF fleXTM
Recent timsTOF Innovations
                                                 ✓ 10x-100x sensitivity for many small molecules and lipids
                                                 ✓ increases applications range of MALDI based MS imaging

                                            •   Revolutionary CCS-enabled 4D Proteomics workflows:
                                                 ✓ dia-PASEF for high throughput and SCP

              MALDI-2 fig from Science,
                                                 ✓ prm-PASEF for targeted assays
              Vol. 348., Issue 6231, 2015
                                                 ✓ caps-PASEF for cross-linking
                                                 ✓ PaSER™ ‘Run and Done’ GPU-search

                                            • New multiomics collaboration with Seer for marketing
                                              combined Proteograph-timsTOF proteomics solution

                                            •   COVID-19 research examples on timsTOF:
                                                 ✓ Tian, W., et al., ’Immune suppression in the early stage of
                                                   COVID-19 disease’. Nat Commun 11, 5859 (2020).
                                                 ✓ Wu, M., et al., ’Transcriptional and proteomic insights into
                                                   the host response in fatal COVID-19 cases’. PNAS 45, v117,
                                                   28336 (2020).
                                                                                                          9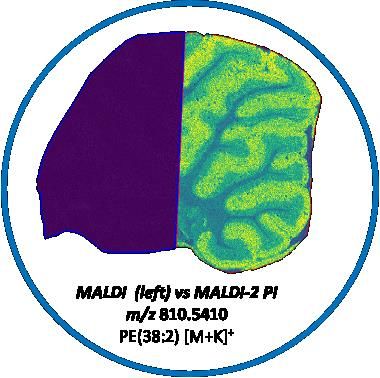
Functional Structural Biology by GHz-NMR                                               GHz NMR enables Discoveries
                                                                                       in disease research, e.g., COVID-19,
Unique capabilities                                                                    Alzheimer’s, CVD and Cancer
- dynamics, function & binding of globular proteins
- intrinsically disordered proteins and protein regions                                •   Example: Viral RNA replication in host-cell
                                                                                           membraneless organelle formed by IDRs
- ubiquitous ‘biomolecular condensates’ in cell biology

“We will use the 1.2 GHz for characterizing droplets and oligomers of
                                                                                       •   1.2 GHz system customer acceptances in 2020:
intrinsically disordered proteins that are key players in many diseases,                   ✓   CERM/Florence, Italy (Q2)
such as COVID-19 and neurodegeneration and cancer. These important
disordered systems currently cannot be studied at atomic resolution with
                                                                                           ✓   ETH Zürich, Switzerland (Q3)
other methods, such as X-ray crystallography or cryo-EM.”                                  ✓   Max Planck Institute, Göttingen, Germany (Q4)
Prof. Christian Griesinger, Director, Max Planck Institute for Biophysical Chemistry
                                                                                       •   4-5 GHz-class NMR acceptances expected in 2021
                                                                                       •   Additional European 1.2 GHz order in Q4 2020

                 NMR of intrinsically partially disordered SARS-CoV-2 N
               (nucleocapsid) protein, acquired on 1.2 GHz NMR, Markus
                          Zweckstetter et al., MPI Goettingen
                                                                                                                                               10
COVID Disease Research: Drug binding by High-Field NMR
Phenomics Research by NMR & Mass Spec
Investigating Structures, Dynamics, Function and Collaboration with ANPC, Murdoch University to support
Binding of SARS-CoV-2 Viral RNA and Proteins COVID-19 pheno-convesion and ‘long COVID’ research
• International COVID19 NMR Consortium: 30 groups, 15 countries • Research on variation in COVID-19 severity, patient pheno-
• NMR functional, structural and binding information near conversion and recovery
physiological conditions • Bruker NMR and timsTOF Pro, impact II and MRMS perform
− Location, affinity and kinetics of ligand binding deep metabolomics of plasma to study COVID pheno-
− Dynamic changes at viral RNA or protein binding site to conversion and pheno-reversion during ‘long COVID’
understand inhibitor efficacy • Bruker expects validation of ‘long COVID’ risk stratification
− For repurposed and novel therapies and recovery assay in 2021
•“Bruker offers us access to its research facilities, support for our •“At the ANPC, we are dedicating 100% of our resources to the
NMR spectrometers, as well as analysis software. The COVID19 COVID-19 fight […] to identify specific biomarkers to figure out who
NMR consortium benefits greatly from this collaboration, and we has it, how we can detect it and stratify patients by severity risk and
are fortunate to have Bruker as a key partner.” assess the real-time patient responses to treatments.”
Prof. Harald Schwalbe, CoFounder/Coordinator of COVID19 NMR consortium Prof. Jeremy Nicholson, Pro Vice Chancellor for Health, Murdoch University
11Spatial Biology & Single-Cell Multiomics
Canopy quantitative, high-resolution spatial biology Bruker ChipCytometry™:
& targeted single-cell multiomics research now
Quantitative Spatial Biology & Single-Cell
Targeted Proteomics
single-cell
resolution now • High-plex imaging for quantitative spatial tissue
profiling and suspended single cells (e.g., PBMCs)
8-log
dynamic • High-resolution now
range
• Highest dynamic range for superior quantitation
PD-1 expression in H&N tumor tissue
Human lung carcinoma tissue – 13-plex
− single-cell resolution targeted spatial biology with
biomarker quantitation across 8-log range
• Applications in immunology, immuno-oncology,
infectious disease research, and targeted
proteomics
CD45
CD4
FOXP3 • Serves translational research in biopharma and
PD-1 academic medical centers (AMCs)
Data revealed that 11.8% of
T-cells are expressing PD-1 • 135+ validated antibodies; compatible with other
commercial antibody probes for targeted proteomics
T-cell infiltration in H&N tumor tissue
Quantitative data provides actionable insight 12Spatial Biology & Single-Cell Multiomics Single Cell & Sub-Cellular
Vutara™ VXL Best-in-Class Super-Resolution Targeted Spatial Genomics,
Biological Workstation for Spatial Biology Transcriptomics and Proteomics
oligoFISSEQ – interphase cell
and metaphase spread • Multiscale widefield & super-resolution imaging
DNA conformation via oligoSTORM • Leading-edge OligoSTORM, ORCA, and DNA PAINT
• Unique integrated fluidics
Research on DNA, RNA & protein spatial biology
Courtesy of Professor Ting
Wu. Harvard Medical
School, 2020
• Genome: 3D DNA conformation and chromatin
structure via oligoSTORM and ORCA
• Transcriptome: RNA expression via DNA PAINT and FISH
• Proteome: Localization of targeted proteins, subcellular
structures via DNA PAINT, FISH and dSTORM
“Vutara was key to doing our oligoSTORM super-resolution work. It “I see the potential of the Vutara VXL in spatial omics research and I
is the only platform that can offer that level of performance and am excited to collaborate with Bruker. Having multimodal imaging
depth of imaging to enable the results we were after. We are with integrated fluidics and software support for ORCA, smFISH,
excited to further our oligoFISSEQ work on this exciting platform.” seqFISH, and MERFISH, the Vutara VXL will be the ideal platform for
Ting Wu, Professor, Dept. of Genetics, Harvard Medical School spatial transcriptomics, or multiomics RNA expression and 3D DNA
folding in the same cells.”
Alistair Boettiger, Asst Professor, Developmental Biology, Stanford
13Microbiology & Molecular Diagnostics
Expanding Infectious Disease Strategy and TAM
Existing Dx Solutions New Assays & Platforms
Fast MBT ID Growth MBT Product
• MALDI Biotyper (MBT) installed base ~4,300 systems Development
• Applied proteomics
• Rapid adoption of 3rd generation MALDI Biotyper® sirius replaces biochemical ID • Sepsityper rapid ID from
• Gains in MALDI market positive blood cultures
• ~200 million pathogen IDs p.a. on MALDI Biotypers • New: MBT sirius • Functional resistance assays
• RUO colistin-resistance STAR Carba/Cepha
assay
• Rapidly growing assay, consumables and service revenues • Work-in-progress (WIP):
MBT selected fast AST
Non-Clinical Markets MDx Expansion
• MBT regulatory • IR Biotyper for hygiene/HAI
approval in USA, Europe • Molecular Dx for acute TB
for food testing (AOAC1)
COVID-19 testing:
• Epidemiology and • Ramp NA extraction
pathogen tracking, e.g. • SARS-CoV-2 assay with
US CDC, China CDC endemic hCoV rule-out
• Winter 4-plex panel for
CV19/FluA&B/RSV
MALDI Biotyper installation • Rapid antigen PoC tests
in Wuhan in February 2020
(1) AOAC = official method of analysis / ISO 14Microbiology & Molecular Diagnostics
Expanding & ramping our SARS-CoV-2 test portfolio(1) SARS-CoV-2 Testing in Europe
• Bruker-Hain products for SARS-CoV-2(1):
✓ Automated sample prep systems
✓ Nucleic acid (NA) extraction kits
MariPOC® system
✓ FluoroType® SARS-CoV-2 two-gene PCR with rule-
out of endemic human coronaviruses (hCoVs)
• FluoroType SARS-CoV-2/Flu A&B/RSV Winter
Four-Plex PCR panel(1)
SARS-CoV-2/Flu/RSV Test Kit LFA AntigenTest
•“…For winter, with an increased incidence of influenza infections, • New in 2021: Rapid POC antigen testing
we needed differentiation of multiple respiratory viruses in one test
✓ mariPOC® automated antigen testing
to avoid workload or costs… We are very pleased with the
Manufacturing & distribution collaboration (1)(2)
performance of this winter four-plex panel, which we now use
broadly for our respiratory disease samples.” ✓ Lateral Flow Assay (LFA) antigen test:
Dr. Steffi Czieschnek, Medical Healthcare Center Suhl, Germany Distribution collaboration(1)(3)
(1) CE-IVD for Europe.
(2) Distribution agreement for various European countries.
(3) Distribution in Bruker-Hain´s Europe and Africa core countries.
15
15Microbiology & Molecular Diagnostics
MBT Sepsityper Kit US IVD® December 2020 FDA Clearance
Fast Identification From Positive Blood Cultures
Sepsis • When every hour counts
Direct ID from positive blood culture (PBC)
• ID possible in 15-20 minutes after PBC alert
• Efficient and faster results to treating physicians
• Enabling change of therapy with earlier ID
• De-escalation or targeted antimicrobial
treatment
• Reduced length of hospital stay and costs
• Improved patient outcomes
MALDI Biotyper Sirius One
https://www.cdc.gov/vitalsigns/pdf/2016-08-vitalsigns.pdf
https://www.cdc.gov/sepsis/datareports/index.html
16Microbiology & Molecular Diagnostics FDA Clearance
MBT Sepsityper Kit US IVD®: Early Adopter Feedback CE-IVD Mark
•“…The MBT Sepsityper Kit US IVD will be •“Rapid (MBT) Sepsityper identification •“The MBT Sepsityper data has allowed us
the next step for a lot of clinical has become instrumental in terms of our to adjust antibiotic therapy according to our
microbiology laboratories. Many are patient care. Especially in critically ill local antibiogram. This, at times, has
currently using multiplex PCR tests, but patients, the improved turn-around-time allowed us to narrow or stop certain
once you have the MALDI Biotyper, it is allows disease specific treatment which antibiotic treatments while in other cases,
more cost-effective to use the MBT conserves health-care resources and, it has allowed us to escalate antibiotic
Sepsityper Kit US IVD for fast identification most importantly, improves patient coverage pending sensitivity data. It has
than PCR syndromic panels.” outcomes.” become a crucial tool for our Antimicrobial
Mr. Ike Northern, Director of Infectious Dr. Elisabeth C. Shearon, Medical Director, Stewardship team.”
Disease Testing and Immunology, Alverno Laboratories in Hammond, Indiana Dr. Steven D. Burdette, Chief of Infectious
CompuNet Clinical Laboratory, Dayton, OH Diseases, Miami Valley Hospital, Dayton OH
* All quoted early adopters have self-validated the research-use-only (RUO) version of the MBT Sepsityper kit prior to FDA-clearance of the MBT Sepsityper Kit US IVD.
17Questions & Answers – Project Accelerate 2.0 Expanded Bruker Strategy and TAM - Unbiased Proteomics and Multiomics - Spatial Biology and Single-Cell Multiomics - Microbiology and Molecular Diagnostics © Bruker Corporation Innovation with Integrity
Appendix

© Bruker Corporation   Innovation with Integrity
Growth, Profitability & Margin Expansion
2016-2019: Track Record of Improving Financial Performance(1)

                Revenue Growth                                               Non-GAAP Operating Profit Margin                                                 Non-GAAP EPS
                                                                                        (OPM)

                                           $2.07B
                                                        $1.96B                                                                                                                    $1.57
                              $1.9B                                                                                      17.6%
                 $1.8B                                                                                      16.8%
                                                                                               15.9%                                 15.7%                              $1.40
    $1.6B                                                                            15.0%
                                                                                                                                                                                            $1.30
                                                                                                                                                   $1.19     $1.21

    2016A        2017A        2018A        2019A         LTM                         2016A     2017A        2018A       2019A         LTM         2016A      2017A     2018A      2019A      LTM
                                                      9/30/2020                                                                    9/30/2020                                              9/30/2020

Drivers (2016-2019)
Volume and Product Mix                                                           Operational Excellence                                         Operational Scalability & Portfolio
•   MALDI Biotyper (MBT)                                                         •   Bruker Management Process                                  • Selected portfolio pruning, strategic portfolio
•   FTIR/NIR/Raman                                                               •   Outsourcing, best-cost product development                   reorientation towards attractive secular trends
•   NMR recovery                                                                 •   Commercial excellence, including CRM expansion             • Exited small plants and streamlined production
•   Aftermarket                                                                  •   Highly disciplined operating expense management            • Established shared service centers
Footnotes:
(1)YTD 2020 results negatively impacted by lower revenue during the COVID-19 pandemic.

LTM: for the last twelve months ended September 30, 2020.
EPS – Earnings per share.                                                                                                                                                                           20
A reconciliation of non-GAAP OPM and non-GAAP EPS to the most directly comparable GAAP measures is available at the end of this presentation.
Bruker Corporation
Reconciliation of GAAP to Non-GAAP Financial Measures (Unaudited)
Three Months Nine Months Last Twelve
Ended Ended Months Ended
(in millions, except per share amounts) Twelve Months Ended December 31, December 31, September 30, September 30,
(1)
2016 2017 (1) 2018 2019 2019 2020 2020
Revenue $ 1,611.3 $ 1,765.9 $ 1,895.6 $ 2,072.6 $ 599.9 $ 1,360.0 $ 1,959.9
Reconciliation of Non-GAAP Operating Income, Non-GAAP
Profit Before Tax, Non-GAAP Net Income, and Non-GAAP EPS
GAAP Operating Income $ 181.8 $ 219.5 $ 262.4 $ 300.9 $ 117.7 $ 135.5 $ 253.2
Non-GAAP Adjustments:
Restructuring Costs 20.8 16.2 9.4 1.4 2.8 5.7 8.5
Acquisition-Related Costs 11.1 10.2 7.3 16.8 1.6 (0.5) 1.1
Purchased Intangible Amortization 21.7 29.6 28.9 38.3 9.1 26.8 35.9
Other Costs 7.1 5.4 9.9 6.6 1.3 8.6 9.9
Total Non-GAAP Adjustments: $ 60.7 $ 61.4 $ 55.5 $ 63.1 $ 14.8 $ 40.6 $ 55.4
Non-GAAP Operating Income $ 242.5 $ 280.9 $ 317.9 $ 364.0 $ 132.5 $ 176.1 $ 308.6
Non-GAAP Operating Margin 15.0% 15.9% 16.8% 17.6% 22.1% 12.9% 15.7%
Non-GAAP Interest & Other Expense, net (13.4) (22.3) (17.7) (20.5) (6.5) (15.4) (21.9)
Non-GAAP Profit Before Tax 229.1 258.6 300.2 343.5 126.0 160.7 286.7
Non-GAAP Income Tax Provision (35.9) (64.7) (78.5) (96.6) (43.3) (40.2) (83.5)
Non-GAAP Tax Rate 15.7% 25.0% 26.1% 28.1% 34.4% 25.0% 29.1%
Minority Interest (0.9) (1.7) (1.3) (0.8) (0.2) (1.2) (1.4)
Non-GAAP Net Income Attributable to Bruker 192.3 192.2 220.4 246.1 82.5 119.3 201.8
Weighted Average Shares Outstanding (Diluted) 162.2 159.1 157.2 156.6 155.4 154.8
Non-GAAP Earnings Per Share $ 1.19 $ 1.21 $ 1.40 $ 1.57 $ 0.53 $ 0.77 $ 1.30
(1)The Company adopted Accounting Standards Update (ASU) 2017-07 as of January 1, 2018 under the retrospective approach. Accordingly, the 2016 and 2017 income statement accounts have been restated to reflect ASU 2017-07.
21Bruker Corporation
Reconciliation of GAAP to Non-GAAP Financial Measures (Unaudited)
Three Months Nine Months Last Twelve
Ended Ended Months Ended
(in millions, except per share amounts) Twelve Months Ended December 31, December 31, September 30, September 30,
(1)
2016 2017 (1) 2018 2019 2019 2020 2020
Reconciliation of GAAP and Non-GAAP Gross Profit
GAAP Gross Profit $ 745.3 $ 816.0 $ 900.0 $ 995.3 $ 296.3 $ 626.8 $ 923.1
Non-GAAP Adjustments:
Restructuring Costs 11.0 5.6 2.6 5.2 1.1 1.3 2.4
Acquisition-Related Costs 2.1 5.7 3.9 12.2 3.0 0.5 3.5
Purchased Intangible Amortization 18.7 24.0 21.6 23.5 5.1 15.1 20.2
Other Costs 0.1 0.8 0.6 0.8 - (0.1) (0.1)
Total Non-GAAP Adjustments: 31.9 36.1 28.7 41.7 9.2 16.8 26.0
Non-GAAP Gross Profit $ 777.2 $ 852.1 $ 928.7 $ 1,037.0 $ 305.5 $ 643.6 $ 949.1
Non-GAAP Gross Margin 48.2% 48.3% 49.0% 50.0% 50.9% 47.3% 48.4%
Reconciliation of GAAP and Non-GAAP Selling, General and Administrative (SG&A) Expenses
GAAP SG&A Expenses $ 389.8 $ 415.2 $ 444.7 $ 500.2 $ 130.3 $ 338.2 $ 468.5
Non-GAAP Adjustments:
Purchased Intangible Amortization 3.0 5.6 7.3 14.9 4.0 11.6 15.6
Non-GAAP SG&A Expenses $ 386.8 $ 409.6 $ 437.4 $ 485.3 $ 126.3 $ 326.6 $ 452.9
(1)The Company adopted Accounting Standards Update (ASU) 2017-07 as of January 1, 2018 under the retrospective approach. Accordingly, the 2016 and 2017 income statement accounts have been restated to reflect ASU 2017-07.
22Bruker Corporation
Reconciliation of GAAP to Non-GAAP Financial Measures (Unaudited)
Three Months Nine Months Last Twelve
Ended Ended Months Ended
(in millions, except per share amounts) Twelve Months Ended December 31, December 31, September 30, September 30,
(1)
2016 2017 (1) 2018 2019 2019 2020 2020
Reconciliation of GAAP and Non-GAAP Tax Rate
GAAP Tax Rate 13.0% 59.4% 26.0% 29.4% 38.1% 25.0%
Non-GAAP Adjustments:
Tax Impact of Non-GAAP Adjustments -1.0% -0.1% -0.6% -1.3% -0.7% -0.7%
Tax Authority Settlements 0.1% 0.0% 0.0% 0.0% 0.0% 0.0%
Valuation Allowance Release 3.7% 0.0% 0.0% 0.0% 0.0% 0.0%
U.S. Tax Reform- Toll Charge 0.0% -27.8% -2.7% 0.6% 0.0% 0.0%
U.S. Tax Reform- Tax Rate Change 0.0% -0.6% 0.1% 0.0% 0.0% 0.0%
U.S. Tax Reform- Change in APB 23 0.0% -6.5% 3.5% 0.0% 0.0% 0.1%
Other Discrete Items -0.1% 0.6% -0.2% -0.6% -3.0% 0.6%
Total Non-GAAP Adjustments: 2.7% -34.4% 0.1% -1.3% -3.7% 0.0%
Non-GAAP Tax Rate 15.7% 25.0% 26.1% 28.1% 34.4% 25.0%
Reconciliation of GAAP and Non-GAAP Earnings Per Share (Diluted)
GAAP Earnings Per Share (Diluted) $ 0.95 $ 0.49 $ 1.14 $ 1.26 $ 0.44 $ 0.57 $ 1.01
Non-GAAP Adjustments:
Restructuring Costs 0.13 0.10 0.06 0.01 0.02 0.04 0.06
Acquisition-Related Costs 0.07 0.06 0.05 0.11 0.01 - 0.01
Purchased Intangible Amortization 0.14 0.19 0.18 0.24 0.06 0.17 0.23
Other Costs 0.04 0.04 0.06 0.04 0.01 0.06 0.07
Bargain Purchase Gain (0.06) - - - - - -
Income Tax Rate Differential (0.08) 0.33 (0.09) (0.09) (0.01) (0.07) (0.08)
Total Non-GAAP Adjustments: 0.24 0.72 0.26 0.31 0.09 0.20 0.29
Non-GAAP Earnings Per Share (Diluted) $ 1.19 $ 1.21 $ 1.40 $ 1.57 $ 0.53 $ 0.77 $ 1.30
(1)The Company adopted Accounting Standards Update (ASU) 2017-07 as of January 1, 2018 under the retrospective approach. Accordingly, the 2016 and 2017 income statement accounts have been restated to reflect ASU 2017-07.
23Bruker Corporation
Reconciliation of GAAP to Non-GAAP Financial Measures (Unaudited)
Three Months Nine Months Last Twelve
Ended Ended Months Ended
(in millions, except per share amounts) Twelve Months Ended December 31, December 31, September 30, September 30,
(1)
2016 2017 (1) 2018 2019 2019 2020 2020
Reconciliation of GAAP and Non-GAAP Interest & Other Income (Expense), net
GAAP Interest & Other Income (Expense), net $ (4.2) $ (21.7) $ (17.7) $ (20.5) $ (6.5) $ (15.4) $ (21.9)
Non-GAAP Adjustments:
Bargain Purchase Gain (9.2) (0.6) - - - - -
Non-GAAP Interest & Other Income (Expense), net $ (13.4) $ (22.3) $ (17.7) $ (20.5) $ (6.5) $ (15.4) $ (21.9)
Reconciliation of Impact of Adoption of ASU 2017-07 (2)
Cost of revenues (2.8) (3.0) (2.1)
Selling, general and administrative (0.7) (0.7) (1.1)
Research and development (1.1) (1.1) (0.7)
Interest and other income (expense), net 4.6 4.8 3.9
Net Impact to Net Income and Earnings per Share: - - -
With respect to the Company’s preliminary outlook for 2021 non-GAAP EPS, we are not providing the most directly comparable GAAP financial measure or
corresponding reconciliations to such GAAP financial measure on a forward-looking basis, because we are unable to predict with reasonable certainty certain
items that may affect such measures calculated and presented in accordance with GAAP without unreasonable effort. Our expected non-GAAP EPS exclude
primarily the future impact of restructuring actions, unusual gains and losses, acquisition-related expenses and purchase accounting fair value adjustments.
These reconciling items are uncertain, depend on various factors outside our management’s control and could significantly impact, either individually or in
the aggregate, our future period EPS calculated and presented in accordance with GAAP.
(1)The Company adopted Accounting Standards Update (ASU) 2017-07 as of January 1, 2018 under the retrospective approach. Accordingly, the 2016 and 2017 income statement accounts have been restated to reflect ASU 2017-07. 24You can also read