Domestic Economic Conditions - Reserve Bank of Australia

Page created by Brandon Berry
 
CONTINUE READING
Domestic Economic Conditions - Reserve Bank of Australia
3. Domestic Economic Conditions

A recovery in economic activity is underway        and have also increased the financial buffers of
across the country, but is proceeding at an        many households and businesses; an increase in
uneven pace. Some industries remain                financial buffers is an unusual outcome during
constrained by mandated and voluntary social       an economic downturn. Measures introduced
distancing, particularly in hospitality and        by the Bank have supported financial market
tourism, while some other industries are feeling   functioning and the flow of credit, and reduced
the effects of the broader economic downturn.      interest rates for borrowers. All these measures
The recovery has also varied across the country.   will encourage a swifter recovery. While earlier
The recent outbreak in Victoria and the            fiscal measures were centred on supporting
associated strict lockdown measures induced a      incomes and retaining jobs, recent
temporary setback there, but the economic          announcements have been more targeted
recovery has continued elsewhere. Nationally,      towards stimulating private demand, which had
more than half of the employment lost in the       taken a significant hit because of the pandemic.
initial downturn has been regained, but            It is also likely that the disruption to how
significant spare capacity remains in the labour   businesses and households operate, work and
market.                                            consume will lead to some structural change in
This recovery follows the biggest peacetime        the economy and entail a period of adjustment.
contraction in the Australian economy since the    More generally, and as set out in the ‘Economic
early 1930s. The national accounts confirmed       Outlook’ chapter, a high degree of uncertainty
that the Australian economy contracted by          will be a feature of the outlook for some time.
7 per cent in the June quarter, the largest
decline since the quarterly accounts began in      Domestic COVID-19 cases have fallen
1959. The decline in GDP was immense, but less     significantly
severe than in many other advanced economies       Most states have recorded a small number of
because health outcomes here were less severe      new daily COVID-19 cases over recent months,
and policy support was substantial.                but many of these have been returned travellers
The near-term economic outlook will depend         in hotel quarantine and there have been few
significantly on health outcomes, the prevention   instances of local transmission that are not
of the spread of the virus, and advances in        linked to known contacts. The number of daily
medical treatment. The substantial policy          domestic COVID-19 cases over recent months
stimulus implemented by the Australian and         has largely reflected case numbers in Victoria;
state governments and the Bank has played an       these have declined significantly, from an
important role in supporting the economy and       average of around 270 in July to below 5 in late
will continue to do so. Policy measures            October, and local transmission has fallen to a
introduced since the start of the pandemic have    few cases per fortnight (Graph 3.1).
helped to keep employment relationships intact

                                                   S TAT E M E N T O N M O N E TA R Y P O L I C Y – N O V E M B E R 2 0 2 0   37
Since August, state governments outside of                                         was a shallower but still noticeable dip in
     Victoria have generally made targeted                                              Sydney, while the other capital cities appeared
     adjustments to social distancing restrictions in                                   to have been less affected. Indicators of mobility,
     response to local outbreaks, and have also                                         outside of Melbourne, have been relatively
     announced plans to ease restrictions further if                                    steady or declined a little over the past month or
     health outcomes allow it. Even so, some                                            so and remain below their level at the start of
     restrictions are likely to remain in place for some                                the year in all states. Survey measures of
     time, possibly until a vaccine becomes widely                                      business sentiment have continued to pick up
     distributed.                                                                       over recent months, while measures of
     Restrictions in Melbourne have begun to be                                         consumer sentiment increased sharply following
     lifted under the Victorian Government’s                                            the release of the Australian Government
     ‘roadmap’ for reopening the economy in steps,                                      Budget (Graph 3.3).
     which seeks to balance reopening the economy
     and containing the virus. The first target was met
     in late September, a touch ahead of schedule,
     and restrictions were relaxed slightly. The next,
                                                                                                                         Graph 3.2
     more substantive, step of reopening started in                                                                 Mobility Indicators
     late October. The last step of the plan, which                                                   By mode of transport or location, 1 March 2020 = 100
                                                                                         index                Driving                        Transit stations             index
     would bring restrictions on activity in the state
                                                                                          100                                                                             100
                                                                                                                                        Adelaide, Brisbane
     broadly in line with other parts of the country, is                                                             Sydney                 and Perth
     conditional on reaching a target of no new                                            50                                                                             50
                                                                                                           Melbourne
     locally acquired cases in a 14-day period.
                                                                                         index                Walking                             Retail*                 index

     Over recent months, individuals have also                                            100                                                                             100
     voluntarily adjusted their behaviour in response
                                                                                           50                                                                             50
     to concerns about the spread of the virus.
     Reflecting a combination of mandated and                                               0
                                                                                                     M A M J J A S O N M A M J J A S O N
                                                                                                                                                                          0

     voluntary responses, indicators of mobility                                                 *   Retail data are state based
                                                                                                 Sources: Apple; Google LLC (2020), ‘Google COVID-19 Community
     dipped around July and August (Graph 3.2).                                                           Mobility Reports’, available at
                                                                                                          https://www.google.com/covid19/mobility/ viewed on 4 November
                                                                                                          2020; RBA
     Given the lockdown measures in Victoria, there
     was a marked fall in mobility in Melbourne; there

                                                                                                                         Graph 3.3
                                      Graph 3.1                                                       Business and Consumer Sentiment*
                                                                                                          Net balance, deviation from long-run average
                                                                                           ppt                                                                            ppt
               Confirmed COVID-19 Cases in Australia                                                                           Business
                             Three-day moving average, by state                             0                                                                             0
         no                                                                       no                                                   Conditions
                                                                                          -30                                                                             -30
                                          Victoria                                                                                                     Confidence
       450                                                                        450     -60                                                                             -60

                                                                                           ppt                                Consumer**                                  ppt
                                                                                           10                                                                             10
       300                                                                        300
                                                                                            0                                                                             0
                 New South Wales
                                                                                          -10                                                                             -10
       150                                                                        150     -20                                                                             -20
                              Other states
                             and territories                                              -30                                                                          -30
                                                                                                          2008               2012               2016               2020
                                                                                                 *   Latest observations are September 2020 for business confidence and
          0                                                                       0                  conditions and October 2020 for consumer confidence
                 M       A       M       J       J       A       S      O     N                  ** Average of Westpac–Melbourne Institute and ANZ–Roy Morgan
                                               2020                                                  surveys
              Sources: covidlive.com.au; government health departments; RBA                      Sources: ANZ–Roy Morgan; NAB; RBA; Westpac–Melbourne Institute

38    R E S E R V E B A N K O F AU S T R A L I A
Employment was quick to rebound                                                worked remain well below their previous level
initially, but the improvement has                                             (Graph 3.4). Average hours worked have almost
slowed more recently                                                           fully recovered for part-time workers, as activity
Employment and hours worked remain well                                        has picked up in industries that employ a
below their pre-pandemic levels, as does                                       relatively large share of part-time workers, such
activity. The initial recovery in employment was                               as hospitality. However, average full-time hours
faster than had been earlier expected, but the                                 have recovered only about half of their initial fall
pace of improvement has slowed since August.                                   (Graph 3.6). In September, around
This slowing at the national level has been partly                             900,000 employees were working reduced hours
driven by developments in Victoria; between                                    for economic reasons, over half of whom were
July and September employment there                                            full-time workers. The number of people
decreased by 2.2 per cent while increasing by                                  working reduced hours has steadily fallen in
1.9 per cent in the rest of Australia (Graph 3.4).                             recent months in most states and is around half
Timelier payroll data indicate that the number of                              the number in April, but has remained elevated
payroll jobs nationally are a bit lower than they                              in Victoria.
were in August.
Labour market conditions initially improved
quickly once health-related restrictions started
to be eased from May. Of the 870,000 employ-                                                                         Graph 3.5
ment losses between March and May, about half                                                      Change in Payroll Jobs by Industry
                                                                                                                  Since week ending 14 March
have since been recovered, but employment in                                     Public admin
                                                                                      Financial
September was still 3.3 per cent lower than in                                          Utilities
                                                                                   Healthcare
                                                                                        Mining
March. Increases in employment have been                                                 Retail
                                                                                     Education
broad based across industries, although the                                     Manufacturing                                  18 Apr*
                                                                                 All industries
number of payroll jobs remains below pre-                                           Wholesale
                                                                                  Professional
pandemic levels in most cases (Graph 3.5).                                               Admin
                                                                                     Transport                                                           17 Oct
                                                                                         Rental                                                          (latest)
Consistent with the increase in employment,                                      Construction
                                                                                Other services
                                                                                   Agriculture
total hours worked nationally have recovered                                        Info media
                                                                                            Arts
about half of their initial fall; the recovery has                              Accom & food
                                                                                                -40            -30       -20          -10            0              %
been stronger outside of Victoria but hours                                    *   The lowest weekly value of the aggregate payroll jobs index
                                                                               Sources: ABS; RBA

                              Graph 3.4
                Employment and Hours Worked                                                                          Graph 3.6
                             February 2020 = 100
 index
                  Employment                  Hours worked
                                                                       index                             Average Hours Worked
                                                                                   hours                                                                            hours
                                                                                                                                         Part time
                                                                                                                                           (RHS)
  100                                                                  100           41                                                                             17
                                               Rest of Australia
                                                                                     40                                                                             16

   95                                                                  95
                                                                                     39                                                                             15
                             Victoria
                                                                                                        Full time
                                                                                                          (LHS)
   90                                                                  90            38                                                                             14

                                                                                     37                                                                             13

   85                                                                  85
          F M A M J           J   A     S F M A M J      J   A     S                 36                                                                           12
                2020                            2020                                   2004              2008             2012              2016              2020
         Sources: ABS; RBA                                                                 Sources: ABS; RBA

                                                                               S TAT E M E N T O N M O N E TA R Y P O L I C Y – N O V E M B E R 2 0 2 0                     39
Unemployment and other measures of                                                          since the pandemic began has been a sharp
     underutilisation remain high                                                                decline in labour market participation. In
     The unemployment rate increased from                                                        particular, of those people who lost employ-
     5.2 per cent in March to 6.9 per cent in                                                    ment, a large share exited the labour force (at
     September (Graph 3.7). The rise in unemploy-                                                least temporarily); in many cases these people
     ment has been smaller than initially expected, in                                           were able to access government income
     part because much of the labour market                                                      support programs (such as JobSeeker) that were
     adjustment to the downturn was through                                                      expanded in response to the pandemic.
     employees working fewer hours while retaining                                               Although the number of people outside the
     their jobs, rather than becoming unemployed.                                                labour market has been steadily declining over
     The retention of employees during this period                                               recent months, there are still more than
     has been strongly underpinned by the                                                        200,000 people who left the labour force early in
     JobKeeper program. Consistent with many                                                     the pandemic and are yet to return, most of
     employees working fewer hours, broader                                                      whom are in Victoria. As restrictions continue to
     indicators of spare capacity in the labour market                                           ease, it is likely that more people will look to re-
     remain high. The heads-based                                                                enter the labour force, encouraged by increasing
     underemployment rate was around                                                             employment opportunities and tighter
     11½ per cent in September, having declined a                                                JobSeeker eligibility criteria (JobSeeker mutual
     little from its highest ever rate in April. Hours-                                          obligation requirements for recipients outside of
     based measures of underutilisation – which                                                  Victoria were reinstated in August). To help
     reflect the additional hours that unemployed                                                gauge the effect of these various factors, the
     and underemployed people would like to work                                                 ABS provides some alternative measures of
     – have also declined from their recent peaks, but                                           unemployment that include employees working
     remain elevated. The number of people working                                               zero hours and those employees who moved
     zero hours for economic reasons in September                                                out of the labour force in March and are yet to
     2020 was still around four times as high as in                                              return; these measures have declined in recent
     September 2019.                                                                             months but remain elevated (Graph 3.8).

     Another key driver of the smaller-than-expected
     increase in the measured unemployment rate

                                       Graph 3.7                                                                                  Graph 3.8
                       Labour Underutilisation Rates
                                          Heads-based
                                                                                                                           Unemployment Rate
        %                                                                                   %                                 Comparison of measures
                                                                                                    %                                                                        %

                                                                                                    14                                                                       14
        18                                                                                  18                            Plus net flows out of labour force
                                                Underutilisation rate*                                                               since March*
                                                                                                    12                                                                       12

        12                                                                                  12
                                                                                                    10                                                                       10
                                                                                                                           Plus employees with zero hours
                                                                                                                                for economic reasons
                                                                                                     8                                                                       8
         6                                                                                  6

                                                               Unemployment rate                     6                                                                       6
                  Underemployment rate**
         0                                                                            0                                                  Unemployment rate
              1980          1988          1996          2004          2012         2020              4                                                                       4
                                                                                                             M   J    S       D     M      J    S      D        M     J  S
             *    Sum of the unemployment and underemployment rates
                                                                                                                  2018                      2019                    2020
             **   Full-time workers on reduced hours for economic reasons and
                  part-time workers who would like, and are available, to work more hours                *   ‘Effective unemployment rate’ used by government
             Sources: ABS; RBA                                                                           Sources: ABS; RBA

40   R E S E R V E B A N K O F AU S T R A L I A
The jobs outlook remains subdued, but                                                    support for businesses and increased social
is improving                                                                             assistance payments. State and territory govern-
Forward-looking indicators of employment such                                            ments also provided support to households and
as job advertisements and vacancies have                                                 businesses, mainly in the form of relief from
picked up since May, but remain lower than                                               taxes and fees and increased funding of public
their pre-pandemic levels (Graph 3.9). Surveys                                           services.
and information from business liaison indicate                                           More recent policies announced in the 2020/21
that employment intentions have improved but                                              Australian Government Budget, released in early
remain subdued, and are mixed across                                                     October, were targeted at supporting the
industries. An elevated share of firms still expect                                      recovery. The measures included bringing
to reduce headcount over the year ahead, but                                             forward tax cuts to households and expanding
an increasing number of firms report that they                                           and extending depreciation allowances to
expect to lift headcount or reinstate regular                                            encourage business investment (Graph 3.10).
hours, contingent on continued improvement in                                            Additional expenditure on infrastructure was
business conditions. Contacts expecting to                                               also announced.
remain eligible for the JobKeeper extension tend
                                                                                         The net fiscal impact of the Australian Govern-
to be exposed to travel or tourism, or have
                                                                                         ment Budget on the economy is equivalent to
experienced significant revenue loss because of
                                                                                         around 7 per cent of GDP in 2020/21. This is
the restrictions in Melbourne.
                                                                                         mostly reversed over subsequent years. The
                                                                                         fiscal deficit of the Australian Government is
The Australian Government Budget                                                         expected to increase to 11 per cent of GDP in
contained further substantial fiscal                                                     2020/21, as a result of the significant fiscal
support for the economy …                                                                support provided by COVID-19 stimulus policies
Following the outbreak of the pandemic, the                                              and the decline in revenue alongside the
Australian and state governments announced                                               decline in activity. This represents the largest
fiscal policy measures aimed at limiting the
contraction in activity and large-scale losses of
employment. The initial packages of fiscal
                                                                                                                            Graph 3.10
support from the Australian Government were
                                                                                                Australian Government Budget Measures
centred on the JobKeeper program, cash flow                                                                         2020/21 Budget, select measures
                                                                                              $b                                                                                 $b

                                 Graph 3.9
                                                                                              20                                                                                 20
                      Labour Market Indicators
   %                                            Employment intentions*             ppt
              Per cent of labour force
                                                        NAB survey
                                                                                                                       Near-term*
  2.5                                                                              30
              Advertisements
                  (NSC)                                                                       10                                                                                 10
  2.0                                                                              15
                                                                                                                                        Over forward estimates
                      Vacancies**
                         (ABS)
  1.5                                                                              0
                                                                                               0                                                                                 0
                                                   3-months-ahead
                                                                                                                                 ts

                                                                                                                                  k
                                                                                                                                  e

                                                                                                                                es

                                                                                                                                  it

                                                                                                                                 ts

                                                                                                                                ps

  1.0                                                                              -15
                                                                                                                              ac

                                                                                                                              ed
                                                                                                                               ur
                                                                                                                            cu

                                                                                                                            en
                                                                                                                   rit ent

                                                                                                                            ur

                                                                                                                            hi

            Advertisements
                                                                                                                           ct
                                                                                                                             f

                                                                                                                          -b

                                                                                                                            r
                                                                                                                          of

                                                                                                                         es
                                                                                                                        ym
                                                                                                                          s

                                                                                                                          C
                                                                                                                          x

                                                                                                                         u
                                                                                                              t w tm

                                                                                                                      rry

                                                                                                                      ea
                                                                                                                       ta
                                                                                                                      e-

                 (ANZ)
                                                                                                                        r

                                                                                                                     tic
                                                                                                                     ng
                                                                                                                     st

                                                                                                                   pa
                                                                                                           se es

                                                                                                                   m
                                                                                                                  ca
                                                                                                                   e

                                                                                                                fra

                                                                                                                en
                                                                                                                 iri
                                                                                                                m
                                                                                                        as Inv

                                                                                                               ld
                                                                                                              lth

                                                                                                               H
                                                                                                             ss

  0.5                                                                              -30
                                                                                                             pr
                                                                                                             In
                                                                                                            co

                                                                                                           ho
                                                                                                          ea

                                                                                                           er

                                                                                                         ap
                                                                                                         Lo
                                                                                                         In

                                                  12-months-ahead
                                                                                                        se
                                                                                                        ak
                                                                                                        H

                                                                                                       g
                                                                                                    ou
                                                                                                   bM

                                                                                                     in
                                                                                                  is
                                                                                                 H
                                                                                              Jo

                                                                                               id

  0.0                                                                              -45
                                                                                            bs

               2010       2015       2020        2010        2015           2020
                                                                                         Su

        *   Net balance for the following period; deviation from average;                          *   Cost over the next two financial years, except for the investment asset
            12-months-ahead measure seasonally adjusted by the RBA                                     write-off and loss carry-back, which shows the cost over 2021/22 and
        ** Survey was suspended between May 2008 and November 2009                                     2022/23
        Sources: ABS; ANZ; NAB; National Skills Commission (NSC); RBA                              Source: Australian Treasury

                                                                                         S TAT E M E N T O N M O N E TA R Y P O L I C Y – N O V E M B E R 2 0 2 0                     41
peacetime Australian Government fiscal deficit                                     … and policy measures have continued
     observed in Australia. By 2023/24, the deficit is                                  to support household cash flow
     expected to have declined to 3 per cent of GDP;                                    Policy measures have provided significant
     at that time, new policy measures would no                                         support to household cash flow. As a result,
     longer be contributing to the deficit, which                                       household disposable income increased in the
     would be driven instead by general government                                      June quarter, despite the large contraction in
     spending and automatic stabilisers such as                                         economic activity, and is expected to have
     ongoing elevated unemployment benefit                                              increased further in the September quarter
     payments and reduced taxation revenues. While                                      (Graph 3.12). Income support has mostly come
     Australian Government debt has increased due                                       from the JobKeeper program, which increased
     to spending measures and lower revenue,                                            unincorporated business income and supported
     interest payments are still expected to decline as                                 labour income, and from the temporary increase
     a share of GDP over the forecast period,                                           in social assistance payments. Eligibility for
     reflecting the decline in interest rates to                                        JobKeeper was tightened in late September and
     historically low levels (Graph 3.11).                                              payments were reduced, in particular for part-
     As well as supporting households and                                               time workers. (For a discussion of income
     businesses by adjusting taxes and transfers, the                                   support policies in other economies, see ‘Box A:
     Australian and state governments have added to                                     Income Support Policies for Advanced
     demand directly by the provision of public                                         Economies during the COVID-19 Pandemic’.)
     goods and services. Public consumption                                             Household cash flow has been further boosted
     increased by 3 per cent in the June quarter, and                                   for those households who made early
     was the main source of expenditure growth in                                       withdrawals from superannuation since April;
     the economy, led by state and local government                                     these withdrawals have totalled $35 billion,
     spending. Public investment is likely to increase                                  equivalent to around 10 per cent of quarterly
     over coming quarters as ‘shovel ready’ projects                                    household disposable income. In aggregate, the
     get underway.                                                                      increase in cash flow from these sources has
                                                                                        been partly offset by a decline in other income,
                                                                                        partly driven by a fall in financial income
                                                                                        alongside steep declines in equity prices earlier
                                                                                        in the year.

                                                                                                                        Graph 3.12
                                        Graph 3.11
                                                                                                         Household Disposable Income
          Australian Government Interest Payments                                                                    Nominal year-ended growth
                              2020/21 Budget, per cent of GDP                              %                                                                              %
        %                                                   Treasury
                                                                                %
                                                            forecasts

       1.5                                                                      1.5
                                                                                           5                                                                              5
                                                                Gross
       1.0                                                                      1.0

                               Net
       0.5                                                                      0.5        0                                                                              0

       0.0                                                                      0.0                         Total        Unincorporated businesses          Tax payable
                                                                                                            Labour       Social assistance                  Other*
                                                                                           -5                                                                             -5
       -0.5                                                                      -0.5           2010          2012          2014         2016          2018       2020
                 93 / 94      99 / 00       05 / 06   11 / 12    17 / 18   23 / 24              *   Includes financial income, interest payable and other
              Source: Australian Treasury                                                       Sources: ABS; RBA

42   R E S E R V E B A N K O F AU S T R A L I A
The Australian Government Budget included           travel, as spending by Australians travelling
policies that will provide additional support to    overseas typically accounts for around 5 per cent
many households in 2020/21. In addition to          of consumption.
bringing forward tax cuts, the low and middle       The prevalence of the virus and the
income tax offset will continue to be available     accompanying activity restrictions weighed
for this financial year. These measures are         heavily on household spending in Victoria in the
expected to reduce household income tax by          September quarter. Retail sales fell sharply in
around $24 billion over the next two years,         August, and information from the Bank’s liaison
mostly concentrated in 2021/22. Pensioners and      program indicates that store closures severely
some other households will also receive two         impacted sales growth in Melbourne. Retailers
$250 payments, to be paid from November             anticipate that conditions will improve
2020 and early 2021, in addition to the two         substantially alongside health outcomes and as
payments of $750 received earlier this year.        trading restrictions are eased over coming
                                                    months.
Income support has enabled a swift
                                                    The increase in household income and
rebound in spending since restrictions
                                                    contraction in consumption in the June quarter
were lifted
                                                    meant the household saving rate increased
A range of partial indicators suggest household     sharply to 20 per cent, the highest it has been
spending has partly recovered over the past six     since 1974 (Graph 3.14). Much of the increase in
months, supported by the easing in restrictions     the saving rate was due to restrictions on
on activity and policies to support household       household activity and reduced opportunity to
cash flow. After declining by 13 per cent over      consume in the quarter, but precautionary
the first half of the year, household consumption   savings by some households concerned about
is forecast to increase by close to 10 per cent     future income would also have contributed.
over the second half.                               Some survey indicators suggest that households
Consumption patterns have shifted considerably      in most income brackets had a higher rate of
as households and retailers have adjusted to        saving over recent quarters; but that is likely to
restrictions. Sales of household goods and food     obscure some significant variation within each
remained elevated in September. Spending at         group. Households are expected to consume a
cafes & restaurants improved but remained
below its pre-COVID level (Graph 3.13). Online
retail sales continued to grow strongly in recent                                      Graph 3.13
months, to account for more than 10 per cent of                                  Retail Sales Values
                                                                                      December 2019 = 100
total retail sales. Sales of motor vehicles also      index                                                                     index
                                                                            Household goods                          Rest of
increased strongly in many states.                     120
                                                                                                                    Australia
                                                                                                                                120
                                                                    Food
Spending on discretionary services has                 100                                                                      100
remained weak compared with other types of                        Other*
                                                                             Total                                 Victoria
                                                         80                                                                     80
consumption, although there are signs of
improvement in some areas as restrictions ease.          60
                                                                                       Cafes &
                                                                                                                                60
                                                                  Clothing &
For example, payments data and information                         footwear          restaurants
                                                         40                                                                     40
from the Bank’s liaison program point to an
                                                         20                                                                     20
increase in domestic travel spending from its                 N D J F M A M J J A S N D J F M A M J J A S
                                                              2019       2020       2019       2020
trough in the June quarter. Some of this                      *   Includes department stores and other retailing

expenditure is likely to be instead of overseas               Sources: ABS; RBA

                                                    S TAT E M E N T O N M O N E TA R Y P O L I C Y – N O V E M B E R 2 0 2 0            43
larger share of their income as opportunities to                             where lower dwelling investment in previous
     spend increase and household income declines                                 years has limited the supply of new rental stock.
     alongside the tapering in fiscal policy support.                             More generally, lower rental income could
                                                                                  present cash flow challenges for some property
     Housing market conditions across the                                         investors if weak rental market conditions
     country are uneven                                                           continue, and may also weigh on investor
     Housing prices in Melbourne and Sydney have                                  demand for new properties.
     declined since the August Statement, while
     prices have increased in the other capital cities                            Policy is supporting detached housing
     and regional Australia (Graph 3.15). New listings                            construction
     have increased in most cities since August, but                              Fiscal and monetary policy measures are
     remain a little below average for this time of year                          supporting conditions for detached residential
     (Graph 3.16). The exception was Melbourne,                                   construction in the near term. Building
     where new residential property listings fell                                 approvals for detached dwellings rose strongly
     sharply because of the restrictions that were in                             over the September quarter (Graph 3.18). Survey
     place, but rebounded strongly in October as                                  measures of new orders for detached homes
     restrictions on in-person auctions and
     inspections were lifted. Auction clearance rates
     declined in September to below 40 per cent in                                                                   Graph 3.15
                                                                                                                   Housing Prices
     Melbourne, and many scheduled auctions were                                                        January 2000 = 100, seasonally adjusted
                                                                                   index                                                                                   index
     withdrawn, but recovered to around 60 per cent
                                                                                    350                                                                                    350
     in October. Auction clearance rates in Sydney                                                       Melbourne                                      Hobart

     have increased to around 70 per cent over the                                  300
                                                                                                                                             Canberra
                                                                                                                                                                           300
                                                                                                       Brisbane
     same period, and auction volumes have been                                     250                                                                                    250
                                                                                                                                                            Adelaide
                                                                                               Perth
     around average.                                                                200                                                                                    200

                                                                                                                  Sydney                         Darwin
     Rental vacancy rates remain elevated in Sydney,                                150                                                                                    150

     and have increased further in Melbourne                                        100                                                                                    100
     (Graph 3.17). Advertised rents in Sydney and
                                                                                     50                                                                                    50
                                                                                               2004           2012         2020       2004         2012             2020
     Melbourne have declined, driven by apartment
                                                                                           Sources: CoreLogic; RBA
     rents. By contrast, vacancy rates have declined
     and rents have increased strongly in Perth,
                                                                                                                     Graph 3.16
                                                                                                New Residential Property Listings*
                                   Graph 3.14                                                                   Rolling 28-day sum, weekly
                                                                                    ’000                 Sydney                              Melbourne                     ’000
               Household Consumption and Income
        %                                                                   %        12                                                                                    12
                                 Real, year-ended growth
        10                                                                  10                      2016–19 range
               Consumption                                                            8                                                                                    8
         5                                                                  5
                                                                                      4                                                                                    4
         0                                                                  0                          2020
                                                     Disposable income              ’000                                                                                   ’000
        -5                                                                  -5                           Brisbane                                Perth
                                                                                      6                                                                                    6
       -10                                                                  -10
                                                                                      4                                                                                    4
        %                             Saving ratio                          %
        15                                                                  15        2                                                                                    2

         0                                                                  0         0                                                                                    0
                                                                                            J FMAM J J A SOND                     J FMAM J J A SOND
       -15                                                                  -15            *   Properties advertised for sale across multiple sources or multiple
                1995        2000       2005      2010        2015        2020                  times in the same 28-day period are only counted once
             Sources: ABS; RBA                                                             Sources: CoreLogic; RBA

44   R E S E R V E B A N K O F AU S T R A L I A
have increased, although liaison has suggested                                        August and September, and to a lesser extent in
that sales of greenfield land and new homes                                           October. Victoria typically accounts for around
have moderated a little following a period of                                         one-third of national construction activity, so
strong demand driven by policy measures,                                              these restrictions weighed on dwelling and non-
including the Australian Government’s                                                 residential building investment in the
HomeBuilder scheme. Liaison indicated that the                                        September quarter.
time limits to qualify for HomeBuilder have                                           Approvals for higher-density dwellings remain
caused some builders to reach capacity for the                                        very low nationally. The strict timelines on the
remainder of the year. State government policies                                      HomeBuilder scheme mean that higher-density
are also supporting demand, particularly in                                           construction projects are unlikely to qualify.
Western Australia. The value of large alterations                                     Developers have reported that sales of off-the-
& additions has also increased strongly in recent                                     plan apartments remained weak, with some
months.                                                                               developers delaying commencements of
Construction activity in Melbourne was curtailed                                      planned projects.
by limits on the number of workers allowed on                                         Forward-looking indicators for non-residential
construction sites and restrictions on                                                construction activity have weakened further;
movements between construction sites in                                               private non-residential building approvals have
                                                                                      fallen significantly, and commencements of new
                                Graph 3.17                                            private building projects fell in the June quarter
             Advertised Rents and Vacancy Rates*                                      (Graph 3.19). As the existing pipeline of
                      Sydney                           Melbourne
   %                Vacancy rate                      Vacancy rate             %      commenced projects is worked through in
   5                                                                           5
    4                                                                          4
                                                                                      coming quarters, non-residential construction
    3                                                                          3      activity is expected to fall. The pipeline of non-
    2                                                                          2
    1                                                                          1
                                                                                      mining infrastructure work also eased further in
   %           Monthly rent growth               Monthly rent growth           %      the June quarter, led by renewable electricity
  1.0                                                                          1.0
                                                                                      projects.
  0.5                                                                          0.5
  0.0                                                                          0.0
  -0.5                                                                         -0.5
  -1.0                                                                         -1.0
             2010        2015        2020      2010        2015         2020
         *   Seasonally adjusted
         Sources: CoreLogic; RBA; REINSW; REIV

                                                                                                                        Graph 3.19
                                Graph 3.18
                                                                                                Non-residential Construction Indicators
             Detached Housing Activity Indicators                                                                          Private sector
 ’000                                       AIG construction new               ’000        $b                            Building approvals                  $b
                                                                                                                               Nominal
               ABS approvals                      orders*
   10                                                                          10           4                                                                4

    8                                                                          8            2                                                                2

 ’000                                                                          ’000        %                   Infrastructure work yet to be done*           %
                                                                                                                       Per cent of quarterly GDP

   10                                                                          4            8                                                                8

    8                                                                          2            4                                                                4
                         HIA                             Greenfield
                    new home sales                        lot sales
    6                                                                          0            0                                                                 0
                2010      2015       2020         2010       2015       2020                 2004               2008             2012              2016   2020
         *   Rescaled to have the same mean and variance as ABS approvals                       *   Excludes resources and other heavy industry
         Sources: ABS; AIG; HIA; RBA; Research4                                                 Sources: ABS; RBA

                                                                                      S TAT E M E N T O N M O N E TA R Y P O L I C Y – N O V E M B E R 2 0 2 0    45
Policy has also cushioned the decline in              The pandemic has interrupted
     business investment                                   Australia’s trade
     Non-mining business investment, including             Australia’s trade in goods and services has fallen
     non-residential construction, fell by 5 per cent in   sharply since the outbreak of COVID-19
     the June quarter, to be 9 per cent lower over the     (Graph 3.23). Restrictions on international travel
     year. While sharp, the fall in investment was         resulted in a collapse in exports and imports of
     smaller than had been expected. This was              tourism, education and passenger transport
     largely because the fall in machinery &               services. These are unlikely to recover until
     equipment investment was moderated by a               international travel restrictions are eased, which
     significant take-up of tax incentives for             is assumed to take place around the end of 2021
     investment that were announced in March, such         (see ‘Economic Outlook’ chapter). At the same
     as the expanded instant asset write-off.              time, exports of resources and rural goods have
     Investment in computer software and research &
     development also fell in the quarter.
                                                                                            Graph 3.20
     Firms’ expectations for investment were little                     Machinery & Equipment Investment
                                                                                Private, non-mining sector, chain volume
     changed in the most recent ABS Capital                   $b                                                                                   $b
     Expenditure (Capex) survey, which was
                                                              18                                                                                   18
     conducted in July and August. Firms continue to
     report that they will substantially reduce               16                                                                                   16

     investment this financial year, including in             14                                                                                   14
                                                                                                             Capex survey
     machinery & equipment (Graph 3.20). All                                                                 expectations*
                                                              12                                                                                   12
     industries expect to reduce investment over the
     coming year (Graph 3.21). However, the Capex             10                                                                                   10

     survey was conducted prior to the October                 8                                                                              8
                                                                             2005            2009           2013             2017          2021
     Australian Government Budget, which                           *   Average real quarterly spending implied by firms’ expectations;
                                                                       adjusted for past average differences between expected and realised
     expanded and extended tax incentives for                          spending, and deflated using RBA forecast for the implicit price deflator
                                                                   Sources: ABS; RBA
     business investment. These policies are
     expected to reduce the fall in machinery &
     equipment investment over the next two years                                           Graph 3.21
     by easing cash flow constraints (especially for                       Capital Expenditure by Industry*
                                                                                          Nominal, financial years
     small businesses) and encouraging firms to               $b                                                                                   $b
                                                                             Goods-related                              Services
     bring forward spending. Take-up of the policies                    Transport, postal &
                                                                           warehousing
                                                                                                                   Expectations
                                                                                                             Other business
                                                                    Manufacturing
     is also expected to increase as the economic             14
                                                                                                                services**
                                                                                                                                                   14

     recovery continues and firms become more
     confident about future demand.                           10
                                                                                                           Rental, hiring
                                                                                                                                                   10
                                                                                                           & real estate
     Mining sector investment increased by                                                                  Other selected
                                                                                                            services***
                                                                   Retail & wholesale trade
                                                               6                                                                                   6
     1 per cent in the June quarter as work on
                                                                                                                 Utilities
                                                                                 Construction
     replacement iron ore projects continued.
     Investment expectations from liaison and the              2                                                                                   2
                                                                         10 / 11     15 / 16     20 / 21        10 / 11      15 / 16    20 / 21
                                                                   *
     Capex survey continue to suggest a modest                         Non-mining industries included in the ABS capital expenditure (Capex)
                                                                       survey; expectations are firms’ estimates of capital expenditure;
                                                                       adjusted for past average differences between expected and realised
     increase in spending in the year ahead, driven by                 spending
                                                                   ** Includes information media & telecommunications, finance &
     further work on iron ore and coal projects                        insurance, and professional, scientific & technical services
                                                                   *** Includes accommodation & food, administrative & support services,
                                                                       arts & recreation, and other services
     (Graph 3.22).                                                 Sources: ABS; RBA

46   R E S E R V E B A N K O F AU S T R A L I A
declined, and imports of consumption and                                                  level in the June quarter; producers sought to
investment goods have fallen in line with                                                 capitalise on higher iron ore prices. However,
weaker domestic demand. The decline in                                                    partial trade data and information from the
imports was larger than in exports over the first                                         Bank’s liaison program suggest that iron ore
half of the year, so the trade surplus was higher                                         export volumes declined in the September
on average. That said, the surplus has been                                               quarter as Australian firms undertook
generally narrower in recent months, driven by a                                          maintenance, and liquefied natural gas (LNG)
pick-up in goods imports, which reflects the                                              export volumes were affected by extended
recovery in domestic demand.                                                              maintenance at some LNG facilities and weak
Resource exports declined by around 2 per cent                                            global demand. Coal exports also look to have
over the first half of the year. The decline was led                                      declined further in recent months.
by lower coal exports because global demand                                               Goods imports were very weak in the June
for coal has been weak and some producers                                                 quarter, but have picked up more recently in line
scaled back production in response to lower                                               with the recovery in domestic demand. Imports
prices (Graph 3.24). By contrast, iron ore export                                         of motor vehicles have recovered particularly
volumes increased further and reached a record                                            strongly, following a pick-up in vehicle sales as a
                                                                                          result of the significant take-up of tax incentives
                                                                                          for investment in the June quarter.
                                 Graph 3.22
                    Mining Capital Expenditure*                                           The outlook for the rural sector remains
                                         Nominal
   $b                                                                               $b
                                                                                          favourable
  150                                                                               150
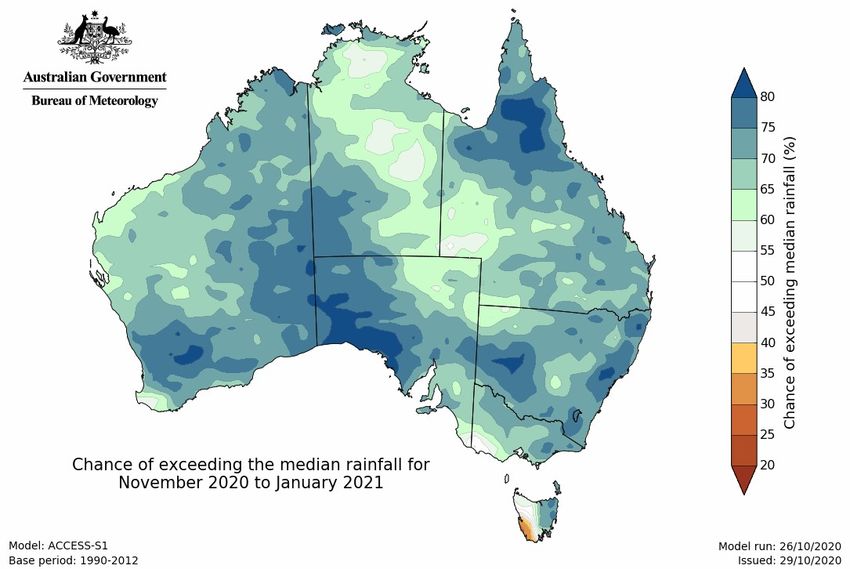
                           National accounts                                              The Bureau of Meteorology has declared that La
  120                                                                               120   Niña is underway. This weather pattern typically
                                                                                          results in above-average rainfall across eastern
   90                                                                               90
                                                                         Previous         Australia during spring and summer; this
                                                                    Estimates
   60                                                                               60    generally provides favourable growing
   30                                                                               30    conditions for cereals, although it also increases
                                                                                          the risk of flooding (Figure 3.1). At the same
    0                                                                               0
                 08 / 09             12 / 13             16 / 17              20 / 21     time, improved pasture conditions will continue
        *   Estimates are firms’ expected capital expenditure; adjusted for past
            average differences between expected and realised spending                    to support farmers to further rebuild herds and
        Sources: ABS; RBA

                                                                                                                           Graph 3.24
                                 Graph 3.23
                                                                                                                        Resource Exports*
                   Trade in Goods and Services                                                                              Log scale, quarterly
                               Current prices, monthly                                         Mt                                                             Mt
   $b                                                                               $b
                                                                                                                                                   LNG
                                                                                                                                                   (RHS)
   35                                                                               35
                        Imports
                                                                                             200                                                              12
   25                                                                               25
                                            Exports

   $b                                                                               $b                        Iron ore
                                     Trade balance                                                              (LHS)
                                                                                             100                                                              6
    6                                                                               6

    0                                                                               0                                    Coal
                                                                                                                         (LHS)
                                                                                               50                                                              3
   -6                                                                               -6                       2008                2012          2016        2020
        2010          2012          2014          2016          2018         2020                   *   Seasonally adjusted by the RBA
        Sources: ABS; RBA                                                                           Sources: ABS; RBA

                                                                                          S TAT E M E N T O N M O N E TA R Y P O L I C Y – N O V E M B E R 2 0 2 0   47
Figure 3.1 : Chance of Exceeding Median Rainfall

     flocks, after the drought left the number of               with government exemptions to travel
     sheep and cattle in Australia at record lows.              restrictions that would allow the movement of
     Accordingly, the Australian Bureau of                      some agricultural workers across borders. Since
     Agricultural and Resource Economics and                    the start of the year, Chinese authorities have
     Sciences (ABARES) expects crop production to
     increase strongly in 2020/21, while meat
                                                                                                 Graph 3.25
     production is expected to decline (Graph 3.25).
                                                                                       Farm Production Volumes*
                                                                                            2015/16 = 100, financial year
     Note: This figure is licenced under the Creative            index                                                                             index
     Commons Attribution Australia Licence
     
     The pandemic has had a limited impact on                     100                                                                              100
                                                                               Total
     agricultural production to date, although weaker                                                                     Livestock-
                                                                                                                            related
     demand has weighed on prices for some higher-                 75                                                                              75

     value agricultural goods. Horticultural harvests
     later in the year could be affected by                        50
                                                                             1996       2001         2006         2011          2016
                                                                                                                                                   50
                                                                                                                                                2021
     international and domestic border restrictions,                     *   Dotted lines represent ABARES’ preliminary estimates for 2019/20
                                                                             and forecasts for 2020/21

     which could disrupt the supply of labour, even                      Sources: ABARES; RBA

48   R E S E R V E B A N K O F AU S T R A L I A
introduced import restrictions and tariffs on
certain agricultural exports from Australia; these
will materially affect some sectors directly
targeted by the measures.

                                                     S TAT E M E N T O N M O N E TA R Y P O L I C Y – N O V E M B E R 2 0 2 0   49
50   R E S E R V E B A N K O F AU S T R A L I A
You can also read