AAA Thanksgiving 2009 Travel Forecast - Thanksgiving Travel Expected to Rise As Confidence Improves
←
→
Page content transcription
If your browser does not render page correctly, please read the page content below

AAA Thanksgiving 2009 Travel Forecast
    Thanksgiving Travel Expected to Rise As
    Confidence Improves

                                                Prepared for:
                             American Automobile Association

                                          November 18, 2009

1                         CONFIDENTIAL FOR INTERNAL USE ONLY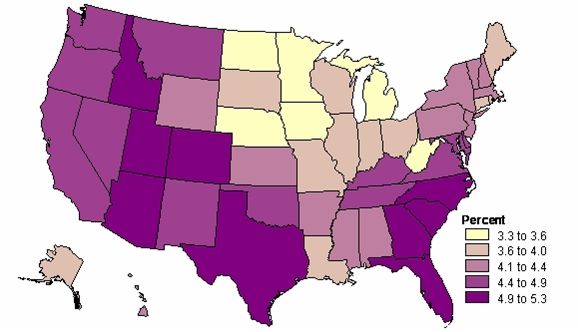
Table of Contents

Holiday Forecast Methodology: A Brief Overview................................................................................................................... 2
Thanksgiving Holiday, 2009 .................................................................................................................................................... 3
Total Travel ............................................................................................................................................................................. 4
Travel by Automobile .............................................................................................................................................................. 6
Travel by Air ............................................................................................................................................................................ 8
Travel by Other Modes.......................................................................................................................................................... 10
Travel Distances ................................................................................................................................................................... 11
Total Spending ...................................................................................................................................................................... 12
Party Composition................................................................................................................................................................. 14
Activities ................................................................................................................................................................................ 15
Top 20 Origin States and Washington, DC MSA .................................................................................................................. 16
Addendum 1: US Economic Forecast Summary: Growth Is Back—Jobs Are Not ............................................................. 18
Addendum 2: US Regional Forecast Summary: The Summer 2009 Forecast, A Glimmer of Hope? ................................ 19

Regional definitions used throughout the report:
New England (NENG): CT, MA, ME, NH, RI, VT
Middle Atlantic (MATL): NJ, NY, PA
South Atlantic (SATL): DC, DE, FL, GA, MD, NC, SC, VA, WV
East South Central (ESC): AL, KY, MS, TN
West South Central (WSC): AR, LA, OK, TX
East North Central (ENC): IL, IN, MI, OH, WI
West North Central (WNC): IA, KS, MN, MO, ND, NE, SD
Mountain (MTN): AZ, CO, ID, MT, NM, NV, UT, WY
Pacific (PAC): AK, CA, HI, OR, WA

1                                                                                                         IHS Global Insight / AAA Thanksgiving 2009 Forecast
Holiday Forecast Methodology: A Brief Overview
In cooperation with AAA, IHS Global Insight has developed a unique approach to forecasting actual travel that explicitly
considers current economic conditions, past Thanksgiving holiday travel trends and behavior, and the recent assessment
of pre-holiday American travel intentions derived from a survey of 1,350 American households. *
The intentions figures act as a leading indicator, but do not constitute the forecast itself. Instead, we overlay other key
travel drivers along with past trends in an effort to project what Americans will actually do this coming Thanksgiving. The
approach recognizes Americans do not always behave as they say they will.
The actual historical travel figures come from the ongoing travel panel database of D.K. Shifflet & Associates, the premier
source of American travel volume and behavior. DKSA interviews over 50,000 American households per month in an
effort to track trip incidence, composition, behavior, and spending…all after the trips have been taken.
Regional holiday traveler forecasts are strongly influenced by the economic conditions that exist in each market. The pain
associated with current economic conditions is of course not evenly distributed throughout the country, nor are their near
term prospects the same. For example, after Thanksgiving travel from New England (CT, MA, ME, NH, RI, VT) reached a
decade low in 2008, New England's improving labor markets in all six states contribute to our expectations for higher than
average Thanksgiving travel in 2009. It will be quite the opposite for East South Central (AL, KY, MS, TN), which saw
unemployment ascend past 10 percent in 2009.
Thanksgiving Holiday Travel Period
For purposes of this forecast the Thanksgiving holiday travel period is defined as trips that include travel of 50 miles or
more away from home during the period from Wednesday, November 25 to Sunday, November 29.
"Burning Issue" Question of the Forecast
Respondents were asked, "How do you think your household spending during the upcoming Thanksgiving holiday will
differ from your Thanksgiving spending last year (2008)? Why?"

*
 The first two holiday travel forecasts conducted by IHS Global Insight and AAA (Memorial Day and Fourth of July 2009)
utilized an initial nationwide sampling of 2,700 households to collect at least 405 respondents planning a holiday trip.
These respondents were interviewed in detail about their intended trips. Beginning with the 2009 Labor Day holiday travel
forecast, 1,350 households will be included in the initial survey and at least 405 respondents will be interviewed in detail
about their intended trips. For Thanksgiving 2009, 512 respondents were interviewed in detail about their intended trips.

2                                                                      IHS Global Insight / AAA Thanksgiving 2009 Forecast
Thanksgiving Holiday, 2009
The Thanksgiving holiday period is consistently one of the busiest travel periods every year. With the holiday's focus on
family and the extended weekend most Americans enjoy, traveling on Thanksgiving has become entrenched in the
American psyche. Economic conditions do play a role in Americans’ decision to travel over the Thanksgiving holiday as
evidenced by last years' 25.2 percent decline in Thanksgiving travel following the sharp sell off in financial markets last
September and the ensuing financial crisis. However, many Thanksgiving travelers have an opportunity to lower their
travel costs during this holiday by choosing to stay with family and friends rather than spending on lodging options.
                                   The decision to travel is also influenced by the travelers' outlook, and not merely the
                                   current economic conditions. Travelers may be confronting challenging times, but the
     “'Less pessimism about        knowledge or belief that the situation is likely to improve has a positive effect on the
            economy."              psychology of the traveler. The downturn in the U.S. economy one year ago was just
        SATL Respondent            beginning, whereas today, even with higher unemployment and less money in
                                   consumers' wallets, the economy appears to be on the verge of a recovery and the
outlook is brighter than one year ago. Consumer confidence has risen over the past year in anticipation of better days to
come, and Americans may feel more economically secure and as a result more willing to travel, particularly during a
holiday such as Thanksgiving. AAA and IHS Global Insight forecast that 38.4 million domestic travelers will take to the
roads, airways and rails this Thanksgiving travel period, an increase of 1.4 percent or just above 548,000 travelers over
2008.
As was true for households grappling with travel decisions in the summer and through Labor Day, there are a number of
economic considerations to weigh. Continued job losses and weakened household wealth and incomes continue to
dampen enthusiasm for overall travel, but Thanksgiving travel is buoyed by improved consumer confidence, and the
opportunity to economize by staying with family or friends and the essential nature of the holiday.
                                                                       CHART 1
                                                          THANKSGIVING TRAVELERS 2000-2009
                                                                TOTAL PERSON-TRIPS*

                        70                                                                                                 30%
                                                                                  58.6
                        60                                                                                                 20%
                                                                                                     50.6
                               48.4                                     46.8                 47.6

                                                                                                                                  (percent change)
                        50               44.1
                                                   41.5                                                                    10%
                                                             38.2                                                   38.4
            (million)

                                                                                                            37.8
                        40
                                                                                                                           0%
                        30
                                                                                                                           -10%
                        20

                        10                                                                                                 -20%

                        0                                                                                                  -30%
                              2000      2001      2002       2003      2004      2005       2006    2007    2008   2009F

                                                          Person Trips (left)            % change (right)

                        * 2000-2008 represent actual travel results. 2009 is a forecast.

3                                                                                          IHS Global Insight / AAA Thanksgiving 2009 Forecast
Total Travel
Driving the growth in total travel this Thanksgiving holiday are anticipated increases in the number of regional travelers in
the New England (CT, MA, ME, NH, RI, VT), South Atlantic (DC, DE, FL, GA, MD, NC, SC, VA, WV), East North Central
(IL, IN, MI, OH, WI), West South Central (AR, LA, OK, TX), Mountain (AZ, CO, ID, MT, NM, NV, UT, WY) and Pacific (AK,
CA, HI, OR, WA) regions. Regional travel growth rates are expected to be as low as just 0.3 percent in the Mountain
region, ranging to above 8.0 percent for both the New England and Pacific regions.
After travel in New England trenched in 2008, a recovery of 8.8 percent growth is expected for 2009 based on the region's
slightly lower unemployment rate relative to the nation and the improving labor markets in all six states. For residents of
the Pacific region, travel is poised to expand 8.3 percent after three years of
consecutive travel contractions. The recession hit the Pacific region particularly
                                                                                      "Finally got a job and have some
hard, but this deterioration finally appears to be moderating.
                                                                                       discretionary money available."
Regional Thanksgiving travel period declines are expected to range from a
                                                                                                PAC Respondent
decline of only 2.6 percent, for residents of the West North Central states (IA,
KS, MN, MO, ND, NE, SD), to a decline of 8.2 percent in the East South Central
(AL, KY, MS, TN) states.
                                    The small decline expected in the West North Central states is likely after the region
                                    slipped into recession in 2009, although it still boasts the lowest unemployment rate of
       “Lower Budget.”
                                    any region (8.0 percent). A 4.7 percent decline is expected for the Middle Atlantic region
     MATL Respondent                (NJ, NY, PA), which has witnessed a slightly lower unemployment rate than the nation
                                    as a whole but has been hurt by the decline of several major financial institutions.
The largest decline is expected in the East South Central region (AL, KY, MS, TN), which saw its unemployment rate
climb to over 10 percent in 2009, the highest it has been in the region since 1984. The region has been hampered by its
high concentration of jobs in the trade and manufacturing sectors, which are particularly vulnerable to cyclical influences.
                                                        TABLE 1
                                        PROJECTED THANKSGIVING 2009 PERSON-TRIPS
                                   ALL MODES OF TRANSPORTATION BY REGION OF RESIDENCE

                                                             Total            Person-      Share of  % Change
                                                           Population          Trips      Population    from
                                                           (millions)        (millions)    Traveling Last Year
                         Total US                            305.5             38.4         12.6%       1.4%
                         New England                          14.3              1.5         10.2%       8.8%
                         Middle Atlantic                      40.7              3.7          9.0%      -4.7%
                         South Atlantic                       58.7              7.5         12.7%       2.6%
                         East North Central                   46.5              6.4         13.7%       2.7%
                         East South Central                   18.2              3.4         18.9%      -8.2%
                         West North Central                   20.2              4.3         21.5%      -2.6%
                         West South Central                   35.5              4.5         12.7%       7.5%
                         Mountain                             22.0              2.5         11.3%       0.3%
                         Pacific                              49.3              4.6          9.4%       8.3%
                         Source: IHS Global Insight / D.K. Shifflet & Associates, Ltd.

4                                                                                IHS Global Insight / AAA Thanksgiving 2009 Forecast
The 38.4 million Americans expected to travel over the 2009 Thanksgiving holiday period represent 12.6 percent of the
total U.S. population. The West North Central should have the highest traveler incidence – 21.5 percent of its total
population. The Middle Atlantic is expected to have the lowest incidences, with only 9.0 percent of persons travelling 50
miles or more away from home. Residents of this region and New England show lower travel incidences as many may
have family close by, a trait shown in the shorter overall travel distances these regions exhibit over the Thanksgiving
holiday.
In terms of absolute numbers, Thanksgiving holiday travelers in the South Atlantic, East North Central, West North
Central, West South Central and Pacific regions are all expected to pass the four-million mark. The South Atlantic region
is expected to reach 7.5 million travelers, leading all regions.
Automobile is the dominant mode of transportation for the Thanksgiving holiday, accounting for 86 percent or 33.2 million
travelers. With air prices rapidly increasing as the 2009 Thanksgiving holiday approaches and overall air capacity down,
air travel is expected to decline sharply from last year, accounting for just 6 percent of all Thanksgiving travelers. Other
modes (trains, watercraft, multi-modal travel) account for the remaining 8 percent of the total person-trips.
CHART 2
DISTRIBUTION OF 2009 US THANKSGIVING TRAVELERS
BY MODE OF TRANSPORTATION
Other Air
8% 6%
Autom obile
86%
Source: IHS Global Insight / D.K. Shifflet & Associates, Ltd.
5 IHS Global Insight / AAA Thanksgiving 2009 ForecastTravel by Automobile
A vast majority of travelers make decisions about Thanksgiving travel plans in October, and with lower gasoline prices in
October 2009 relative to 2008, many travelers will be more inclined to travel by automobile rather than air this holiday.
With lower gasoline prices, continued reduction in air capacity and recent increases
in airfare, the share of automobile travel is expected to increase in 2009 as “Driving instead of flying will
travelers shift away from air travel. With a depressed overall economy, travelers save a lot of money.”
are more likely to choose the road in lieu of air travel when making travel plans this
ESC Respondent
Thanksgiving, in an effort to keep costs as low as possible. For Thanksgiving 2009,
the number of those traveling by automobile is expected to witness slightly steeper
growth than overall travel, up by 2.1 percent from 2008 while overall travel increases by 1.4 percent. AAA and IHS Global
Insight expect 33.2 million Americans to travel by car over the Thanksgiving holiday travel period in 2009. In 2008, 32.5
million Americans traveled by automobile during the Thanksgiving holiday.
The distribution of growth rates across regions is similar to that for overall travel, with New England, West South Central
and Pacific regions anticipating the largest increases. The West North Central and East South Central regions are home
to largest share of residents travelling by car, both with more than 15 percent of population taking to the road this
Thanksgiving Holiday.
TABLE 2
PROJECTED THANKSGIVING 2009 PERSON-TRIPS
BY AUTOMOBILE AND REGION OF RESIDENCE
Total Trips by Share of % Change
Population Automobile Population from
(millions) (millions) Traveling Last Year
Total US 305.5 33.2 10.9% 2.1%
New England 14.3 1.3 8.9% 9.6%
Middle Atlantic 40.7 3.2 7.8% -4.0%
South Atlantic 58.7 6.3 10.7% 3.3%
East North Central 46.5 5.6 12.0% 3.3%
East South Central 18.2 2.9 15.7% -7.9%
West North Central 20.2 3.9 19.4% -2.2%
West South Central 35.5 4.0 11.3% 8.1%
Mountain 22.0 2.1 9.6% 1.2%
Pacific 49.3 3.9 8.0% 9.1%
Source: IHS Global Insight / D.K. Shifflet & Associates, Ltd.
6 IHS Global Insight / AAA Thanksgiving 2009 ForecastCHART 3
THANKSGIVING TRAVELERS 2000-2009
AUTOMOBILE PERSON-TRIPS*
60 40%
49.9
50 30%
43.0
40.2
(percent change)
38.6 38.8 20%
40 36.0 34.4 33.2
(million)
32.5
30.8 10%
30
0%
20
-10%
10 -20%
0 -30%
2000 2001 2002 2003 2004 2005 2006 2007 2008 2009F
Person-Trips (left) % change (right)
*2000-2008 represent actual travel results. 2009 is a forecast.
CHART 4
AVERAGE OCTOBER* GASOLINE PRICES
NATIONAL AVERAGE PER GALLON REGULAR UNLEADED
2000-2009
$4.00
$3.50
$3.09
$3.00 $2.76 $2.80
$2.55
$2.50 $2.24
$1.99
$2.00
$1.55 $1.56
$1.45
$1.50 $1.34
$1.00
$0.50
$0.00
2000 2001 2002 2003 2004 2005 2006 2007 2008 2009
Source: AAA Fuel Gauge Report
* October gasoline prices are emphasized because prices observed several weeks prior to the holiday are likely to influence holiday travel
planning, while actual holiday prices are typically less influential.
7 IHS Global Insight / AAA Thanksgiving 2009 ForecastTravel by Air
Given the current economic conditions and the rapid increase in air fares over the past few weeks, AAA and IHS Global
Insight forecast that only 2.3 million travelers will take to the skies this Thanksgiving
holiday, a decline of 6.7 percent from the 2.5 million flying in 2008. The number of
“Booked flight last seats available for flying has been decreasing as airlines cut capacity in an effort to
minute…which caused reduce costs. Meanwhile, recently increasing air fares for the Thanksgiving holiday
price to be much higher along with high ancillary fees and continued security issues will further hold down air
than previous years." travel this Thanksgiving.
PAC Respondent With the impact of the recession, some travelers are substituting automobile travel for
air travel. Lower gasoline prices in October (which is considered the month in which
travel plans are often being finalized) compared to a year prior adds further justification for more travel by automobile as
opposed to airplane. Although fuel prices had increased nearly 20 cents per gallon as this forecast was finalized, this
development was unlikely to alter the decision to fly versus drive since airline seat availability becomes severely limited as
the holiday approaches.
Residents in all regions are expected to decrease their air travel this Thanksgiving. The share of population travelling by
air ranges from 0.6 percent (Middle Atlantic and East South Central) to 1.0 percent (Mountain). This year air travel during
the Thanksgiving holiday is expected to fall more than 62 percent from the decade-high of 6.2 million person-trips in 2000;
dramatic change in consumer behavior for this holiday.
TABLE 3
PROJECTED THANKSGIVING 2009 PERSON-TRIPS
BY AIR AND REGION OF RESIDENCE
Total Person- Share of % Change
Population Trips by Air Population from
(millions) (millions) Traveling Last Year
Total US 305.5 2.3 0.8% -6.7%
New England 14.3 0.1 0.7% -0.7%
Middle Atlantic 40.7 0.2 0.6% -13.0%
South Atlantic 58.7 0.5 0.8% -6.4%
East North Central 46.5 0.4 0.8% -6.4%
East South Central 18.2 0.1 0.6% -16.6%
West North Central 20.2 0.2 0.8% -11.4%
West South Central 35.5 0.3 0.8% -2.0%
Mountain 22.0 0.2 1.0% -8.3%
Pacific 49.3 0.4 0.7% -1.1%
Source: IHS Global Insight / D.K. Shifflet & Associates, Ltd.
8 IHS Global Insight / AAA Thanksgiving 2009 ForecastCHART 5
THANKSGIVING TRAVELERS 2000-2009
AIR PERSON-TRIPS*
7.0 30%
6.2
6.0 5.1
20%
4.9 4.9 10%
(percent change)
5.0 4.5 4.4
4.1 4.1
0%
(million)
4.0
-10%
3.0 2.5 2.3
-20%
2.0
-30%
1.0 -40%
0.0 -50%
2000 2001 2002 2003 2004 2005 2006 2007 2008 2009F
Person-Trips (left) % change (right)
*2000-2008 represent actual travel results. 2009 is a forecast.
9 IHS Global Insight / AAA Thanksgiving 2009 ForecastTravel by Other Modes
TABLE 4
PROJECTED THANKSGIVING 2009 PERSON-TRIPS
BY OTHER MODES AND REGION OF RESIDENCE
Person-
Trips by
Total Other Share of % Change
Population Modes Population from
(millions) (millions) Traveling Last Year
Total US 305.5 2.9 0.9% 1.2%
New England 14.3 0.1 0.5% 9.7%
Middle Atlantic 40.7 0.2 0.6% -3.9%
South Atlantic 58.7 0.7 1.2% 3.4%
East North Central 46.5 0.4 0.9% 3.4%
East South Central 18.2 0.5 2.6% -7.8%
West North Central 20.2 0.3 1.3% -2.1%
West South Central 35.5 0.2 0.7% 8.2%
Mountain 22.0 0.2 0.7% 1.3%
Pacific 49.3 0.3 0.7% 9.2%
Source: IHS Global Insight / D.K. Shifflet & Associates, Ltd.
10 IHS Global Insight / AAA Thanksgiving 2009 ForecastTravel Distances
Thanksgiving holiday period travelers will log an average of 815 miles round-trip this upcoming holiday, a higher round-trip
distance than was seen in the summer holidays. Over one-third (37 percent) of travelers will stay relatively close to home,
with expected round-trips of 250 miles or less. About one-fourth of holiday travelers
will log between 251 and 700 miles. And 38 percent will travel over 701 miles round-
“Traveling further away."
trip. New England travelers will stay closest to home, with an average round-trip
distance of just 387 miles. Travelers from the West South Central and South Atlantic WSC Respondent
region will top the charts, logging over 1000 miles round-trip.
Seventy percent or more of travelers from the West South Central and South Atlantic regions will travel more than 400
miles over the Thanksgiving holiday, which is significantly higher than the national average of just 53 percent. Travelers
from New England region are at the other end of the spectrum, with a mere 22 percent of trips over 400 miles, the lowest
in the nation.
TABLE 5
EXPECTED ROUND-TRIP DISTANCE TRAVELED
THANKSGIVING 2009 HOLIDAY
TOTAL US AND BY REGION OF RESIDENCE
50-150 151-250 251-400 401-700 701-1500 Over 1500 Average
miles miles miles miles miles miles Miles
(Percentage of Travelers)
Total US 18% 19% 9% 15% 17% 21% 815
New England 39% 18% 21% 13% 3% 6% 387
Middle Atlantic 23% 40% 4% 12% 14% 8% 525
South Atlantic 7% 15% 8% 12% 35% 24% 1077
East North Central 17% 23% 7% 8% 9% 35% 941
East South Central 21% 33% 13% 17% 1% 15% 563
West North Central 18% 14% 12% 30% 19% 7% 643
West South Central 5% 9% 17% 19% 18% 33% 1162
Mountain 26% 14% 6% 18% 21% 14% 661
Pacific 27% 13% 9% 18% 10% 23% 664
Source: D.K. Shifflet & Associates, Ltd.
Numbers may not sum due to rounding
11 IHS Global Insight / AAA Thanksgiving 2009 ForecastTotal Spending
AAA and IHS Global Insight have noticed that with a brighter economic outlook this year, many survey respondents
indicated that they would be spending more this year than last year. About 68 percent of respondents who traveled during
Thanksgiving last year indicated that they would spend at least as much as they did last year over the holiday.
While some of the increases are due to longer trips or higher prices, many travelers are planning to spend more this
Thanksgiving because they chose not to travel last Thanksgiving. Many survey
respondents indicated that they did not travel last year due to less discretionary “Last year we did not travel,
income and higher job uncertainty. On average, travelers appear to want to travel so we are spending more
and spend this Thanksgiving, especially given many did not travel during
this year."
Thanksgiving of 2008.
WSC Respondent
Thanksgiving holiday period travelers expect to spend $718 per household this
upcoming holiday period. Transportation costs take up about 32 cents of the traveler dollar while the categories where
the spending is likely to happen at the destination, including accommodation, food and
beverages, and shopping and entertainment, take 68 cents of the total holiday dollar.
"Will be staying with family." With the main purpose of the Thanksgiving holiday being a visit with friends and family,
SATL Respondent it is not surprising that only 15.7 percent of travelers' Thanksgiving spending will be
used on accommodations.
Travelers from the West North Central region will be the thriftiest travelers this Thanksgiving, spending $368. Those
travelers have the lowest average spend in two categories - accommodations and entertainment. However, these
residents will spend 29 percent of their budget on fuel transportation. Visitors from the East North Central region top the
charts with $883 in expected expenditures over the holiday, likely due to the fact that this region has the second largest
number of travelers.
The West North Central and the West South Central regions are expected to spend the largest percentages of their
budgets on transportation this Thanksgiving, allocating 38 percent and 42 percent, respectively. Residents of the West
North Central states will spend primarily on fuel, whereas travelers coming from the West South Central will conversely
spend predominantly on non-fuel transportation.
TABLE 6
EXPECTED TRIP SPENDING BY CATEGORY
THANKSGIVING 2009 HOLIDAY
TOTAL US AND BY REGION OF RESIDENCE
East East West West
Total New Mid- South North South North South
US England Atlantic Atlantic Central Central Central Central Mountain Pacific
Total Expenditures $718 $457 $576 $796 $883 $502 $368 $820 $677 $817
Fuel Transportation $101 $70 $96 $115 $107 $75 $108 $91 $120 $91
Other Transportation Spending $130 $31 $44 $114 $213 $3 $31 $250 $107 $174
Accommodations $113 $36 $138 $111 $153 $100 $35 $86 $99 $146
Food & Beverages $150 $118 $132 $193 $144 $133 $71 $136 $147 $180
Shopping $117 $108 $89 $145 $141 $103 $95 $111 $118 $103
Entertainment/Recreation $70 $78 $46 $78 $94 $80 $26 $46 $64 $91
Other $37 $17 $30 $39 $32 $8 $2 $100 $22 $33
Source: D.K. Shifflet & Associates, Ltd.
Numbers may not add due to rounding.
12 IHS Global Insight / AAA Thanksgiving 2009 ForecastCHART 6
US 2009 THANKSGIVING SPENDING
DISTRIBUTION BY CATEGORY
Other
Fuel
5%
Ent/Rec 14%
10%
Other
Shopping
Transp.
16%
18%
Lodging
Food & Bev.
16%
21%
Source: IHS Global Insight / D.K. Shifflet & Associates, Ltd.
CHART 7
EXPECTED TRIP SPENDING ON GASOLINE
TOTAL US AND BY REGION OF RESIDENCE
$140
$120
$115
$120 $108 $107
$101 $96
$100 $91 $91
$75
$80 $70
$60
$40
$20
$0
SATL PAC NENG WSC Total ESC WNC MTN MATL ENC
US
Source: IHS Global Insight / D.K. Shifflet & Associates, Ltd.
13 IHS Global Insight / AAA Thanksgiving 2009 ForecastParty Composition
The Thanksgiving holiday is unique because it causes travelers to convene, unlike many other holidays where travel
parties journey independently to a destination. Party composition is therefore less
important during Thanksgiving, because travelers are assembling together, often
“'More emphasis on family."
with extended families. Thanksgiving family gatherings may also have travelers
coming from different regions throughout the country, which would not be noticed WSC Respondent
by the party composition data. While party compsition, in terms of numbers, is
less significant during Thanksgiving, it is worth nothing that the majority of travelers over the holiday do come from the
same household; only 23 percent of travelers this Thanksgiving plan to travel with somebody outside of their household.
TABLE 7
PARTY COMPOSITION
THANKSGIVING 2009 HOLIDAY
TOTAL US AND BY REGION OF RESIDENCE
Three or
One Adult Two Adults more Adults Families
Total US 18% 35% 16% 31%
New England 9% 26% 41% 24%
Middle Atlantic 31% 18% 27% 25%
South Atlantic 9% 33% 32% 25%
East North Central 21% 40% 4% 36%
East South Central 12% 33% 13% 42%
West North Central 24% 20% 7% 49%
West South Central 15% 45% 4% 36%
Mountain 20% 40% 10% 31%
Pacific 18% 47% 8% 26%
Source: D.K. Shifflet & Associates, Ltd.
Numbers may not add due to rounding.
14 IHS Global Insight / AAA Thanksgiving 2009 ForecastActivities
As different travel parties from across the country assemble together this Thanksgiving, it is not surprising that dining and
visiting with friends or relatives top the charts in expected primary activities for this holiday. While the focus of this holiday
is the Thanksgiving meal, 68 percent of travelers expect to visit friends or relatives. Shopping ranks third in the list of
expected major activities for Thanksgiving, with 50 percent of travelers expected to
shop over the holiday. The day after Thanksgiving, dubbed "Black Friday," is one of
“Plan on going out shopping
the largest shopping days of the year and will likely drive the shopping push over the
holiday. Destinations, party composition and demographics, among other things, will on Black Friday."
impact the importance of some activities relative to others, but Thanksgiving is ENC Respondent
dominated by eating and friends and family.
TABLE 8
EXPECTED PRIMARY ACTIVITIES
THANKSGIVING 2009 HOLIDAY
TOTAL US AND BY REGION OF RESIDENCE
East East West West
Total New Mid- South North South North South
US England Atlantic Atlantic Central Central Central Central Mtn. Pacific
Visit with friends/relatives 68% 62% 73% 60% 75% 52% 71% 67% 82% 68%
Dining 57% 72% 60% 53% 46% 34% 53% 58% 78% 69%
Shopping 50% 64% 38% 49% 46% 52% 49% 53% 49% 60%
Touring/sightseeing 24% 25% 31% 12% 18% 31% 16% 26% 19% 36%
Watch sporting events 17% 23% 9% 14% 16% 16% 15% 28% 27% 18%
Visit museums, art exhibits, etc. 17% 13% 20% 13% 15% 16% 13% 18% 13% 24%
Night Life 17% 39% 13% 15% 19% 18% 8% 13% 9% 23%
Visit historic sites 14% 7% 16% 15% 9% 10% 5% 19% 13% 20%
Hike, bike, etc. 12% 22% 14% 7% 15% 6% 6% 11% 10% 14%
Go to beach/waterfront 11% 7% 14% 4% 15% 20% 1% 11% 14% 16%
Attend festivals, craft fairs, etc. 11% 7% 27% 9% 5% 15% 1% 11% 8% 12%
Visit national or state parks 11% 4% 17% 3% 8% 17% 2% 17% 15% 14%
Attend concerts, plays, dance, etc. 10% 6% 12% 15% 5% 15% 0% 6% 9% 12%
Gambling 8% 29% 5% 11% 1% 0% 6% 3% 4% 15%
Play golf 7% 1% 1% 9% 8% 12% 0% 4% 3% 16%
Visit theme/amusement parks 6% 4% 9% 3% 7% 20% 0% 1% 2% 7%
Observe & conserve nature/culture - 5% 6% 3% 3% 11% 1% 0% 2% 7% 6%
Hunt, fish, etc. 4% 0% 0% 4% 5% 5% 5% 9% 10% 3%
Spa 4% 1% 8% 3% 1% 8% 0% 3% 6% 5%
Look at real estate 3% 4% 15% 1% 0% 0% 2% 1% 3% 0%
Boat/sail 2% 1% 2% 2% 0% 7% 0% 1% 1% 2%
Snow ski, snow board, other 2% 1% 2% 2% 1% 0% 2% 0% 0% 3%
Attend show: boat, car, home, etc. 1% 0% 5% 1% 1% 0% 0% 0% 0% 0%
Compete in sporting events 0% 0% 0% 0% 0% 0% 0% 0% 6% 0%
Other 7% 8% 9% 3% 12% 0% 5% 9% 13% 3%
Source: D.K. Shifflet & Associates, Ltd.
15 IHS Global Insight / AAA Thanksgiving 2009 ForecastTop 20 Origin States and Washington, DC MSA
Regional economics will impact travel by origin market with the relative economic situation impacting travel decisions in
each region. The top 20 origin states and the Washington, DC MSA will account for almost 75 percent of Thanksgiving
travel in 2009. While California will generate the most travelers this upcoming holiday (3.5 mn), Tennessee will generate
the most travelers as a share of its population, with 20.9 percent of the local population expected to travel over
Thanksgiving. Domestic travel is dominated by automobile travel. Air travel accounts for a very small share of total, with
Virginia and Washington, DC having the highest shares of travel by air expected for the holiday.
TABLE 9
TOP 20 ORIGIN MARKET (AND DC) PERSON-TRIPS FORECAST
TOTAL US AND BY STATE OF RESIDENCE AND BY MODE OF TRANSPORTATION
Total Travel Automobile Travel Air Travel
Population Person-Trips Percent of Person-Trips Percent of Person-Trips Percent of
(Thousands) (Thousands) Population (Thousands) Population (Thousands) Population
Total US 305,460 38,389 12.6% 33,170 10.9% 2,330 0.8%
California 37,335 3,519 9.4% 3,001 8.0% 267 0.7%
Texas 25,048 3,336 13.3% 2,955 11.8% 200 0.8%
New York 19,582 1,970 10.1% 1,707 8.7% 130 0.7%
Florida 18,548 2,128 11.5% 1,793 9.7% 140 0.8%
Illinois 13,015 2,030 15.6% 1,776 13.6% 123 0.9%
Pennsylvania 12,496 904 7.2% 783 6.3% 60 0.5%
Ohio 11,507 1,503 13.1% 1,315 11.4% 91 0.8%
Michigan 9,947 1,246 12.5% 1,090 11.0% 76 0.8%
Georgia 9,939 1,166 11.7% 982 9.9% 77 0.8%
Virginia 7,876 1,153 14.6% 972 12.3% 76 1.0%
Washington, DC 5,975 978 16.4% 824 13.8% 64 1.1%
North Carolina 9,488 1,167 12.3% 983 10.4% 77 0.8%
New Jersey 8,733 795 9.1% 688 7.9% 52 0.6%
Washington 6,693 608 9.1% 518 7.7% 46 0.7%
Arizona 6,724 683 10.2% 581 8.6% 59 0.9%
Massachusetts 6,542 714 10.9% 627 9.6% 53 0.8%
Indiana 6,438 818 12.7% 716 11.1% 50 0.8%
Tennessee 6,317 1,320 20.9% 1,095 17.3% 42 0.7%
Missouri 5,964 1,134 19.0% 1,025 17.2% 41 0.7%
Maryland 5,659 794 14.0% 669 11.8% 52 0.9%
Wisconsin 5,674 778 13.7% 681 12.0% 47 0.8%
Total Top 20 (plus DC) 239,500 28,745 12.0% 24,779 10.3% 1,823 0.8%
Source: IHS Global Insight
Numbers may not sum due to rounding
16 IHS Global Insight / AAA Thanksgiving 2009 ForecastTABLE 10
TOP 20 ORIGIN MARKET (AND DC) PERSON-TRIPS FORECAST – GROWTH RATES
% CHANGE FROM PREVIOUS YEAR'S HOLIDAY
Total Automobile Air
California 8.2% 9.0% -1.2%
Texas 7.5% 8.1% -2.0%
New York -4.6% -3.9% -12.9%
Florida 1.9% 2.6% -7.0%
Illinois 3.6% 4.3% -5.5%
Pennsylvania -4.8% -4.1% -13.1%
Ohio 2.7% 3.4% -6.3%
Michigan 0.7% 1.3% -8.2%
Georgia 2.3% 3.0% -6.7%
Virginia 2.7% 3.4% -6.3%
Washington, DC 3.6% 4.3% -5.5%
North Carolina 2.4% 3.1% -6.6%
New Jersey -4.8% -4.2% -13.2%
Washington 9.2% 10.1% -0.3%
Arizona -0.8% 0.0% -9.4%
Massachusetts 9.1% 10.0% -0.4%
Indiana 2.7% 3.3% -6.4%
Tennessee -8.5% -8.2% -16.8%
Missouri -2.9% -2.5% -11.7%
Maryland 3.9% 4.6% -5.2%
Wisconsin 3.4% 4.0% -5.7%
Source: IHS Global Insight
17 IHS Global Insight / AAA Thanksgiving 2009 ForecastAddendum 1: US Economic Forecast Summary: Growth Is Back—Jobs Are Not PUBLISHED 10/7/2009 A recovery is under way in GDP, but as yet without the strength or duration necessary to turn the labor market around. Recent indicators have been a bit more mixed than in previous months: there have been setbacks for existing home sales and capital goods orders and shipments, while the ISM manufacturing index has edged lower. But they do not undermine the view that the recession trough was in June. Forecast Profile: Still a Mild "W" Shape. Our forecast is little changed this month. We expect 3.6% growth in the third quarter, followed by 2.6% in the fourth, with a major boost from the turn in the inventory cycle as cuts gradually give way to increases (by the New Year). Looking into 2010, we expect the credit-constrained recovery to prove a subpar one, and that growth will ease back to a 1.8% pace in the first half of 2010, after the inventory swing runs its course. But this is a mild W-shaped growth profile, not a double-dip downturn. Growth, But No Jobs. The recovery in output continues to be unaccompanied by a recovery in jobs. Job cuts remained severe at 263,000 in September, and the workweek shrank. As a result, the third quarter will be another huge one for productivity, expected to rise 6.3%, after the 6.6% increase in the second quarter. This is good news for corporate bottom lines, but bad news for household incomes. We cannot imagine that such gains can continue, and expect that firms will have to re-hire sooner after this recession than after the 2001 one. But we still do not expect to see private employment turn decisively higher until the second half of 2010. Consumers Returned in the Third Quarter. We estimate that "cash for clunkers" helped spur consumer spending to a 2.9% growth rate in the third quarter. But even excluding new vehicles, spending rose 1.8%, after declining 0.8% in the second quarter, helped by a strong increase in many retail sales categories during August. Nevertheless, we remain skeptical about the future strength of consumer spending, given that debt burdens are still high, wealth is depleted, credit is tight, and incomes are being squeezed by the still-deteriorating labor market. An Inventory Cycle in Housing, Too. Much better affordability and the first-time homebuyers' tax credit have boosted single-family home sales. We do expect some payback after the credit expires at the end of November (and even if the credit is extended, its impact will fade). Our forecast of home sales therefore remains cautious, but the key reason to expect housing starts to climb in 2010 is that at present production levels, the backlog of unsold homes is being worked off very quickly. Production (i.e., single-family housing starts) will need to increase in order to prevent inventories from falling too low. Business Spending: A Mixed Bag. Capital goods orders have edged lower in the past couple of months, but not sufficiently to overturn a gradual improving trend. We expect business equipment spending to rise 7.3% in the third quarter, with the gains concentrated in high tech and in vehicles. But nonresidential construction is still declining and we do not see a bottom until the second half of 2010. Foreign Trade Flows Bouncing Back Sharply. Incoming evidence points to a sharp rebound in world trade during the third quarter, and we expect both U.S. exports and imports to jump at roughly a 20% annualized rate. Trade will be a drag on U.S. GDP growth in the second half of the year, as the turn in the inventory cycle pulls imports up faster than exports. Inflation Threat Not Immediate. Recent inflation indications continue to show core inflation very quiet, despite rising commodity prices. Wage inflation in the private sector has almost disappeared. We continue to expect no change in interest rates from the Fed until the third quarter of 2010. 18 IHS Global Insight / AAA Thanksgiving 2009 Forecast
Addendum 2: US Regional Forecast Summary: The Summer 2009 Forecast, A
Glimmer of Hope?
PUBLISHED JULY 28, 2009
The current economic situation is grim in almost all states, but the turning point for most state economies is approaching.
IHS Global Insight's Summer 2009 forecast indicates that the worst has passed in most places. Housing and real output
are expected to finally improve in the third quarter of 2009, and although employment is still falling, the pace of job losses
has slowed. The end may not be near—solid growth is a year away—but the era of freefall is over.
While a few states will rebound strongly from the current recession over the next two years, most of the country will take
longer to return to the peak employment levels achieved in the middle of this decade, before the downturn began to grip
their economies. IHS Global Insight's summer forecast indicates that some northern states will lag behind in recovery,
while several states picked for faster recovery were somewhat insulated from the worst of the recession, such as Texas,
the District of Columbia, and North Dakota. Along with a lack of major housing bubbles, the D.C. economy derives its
strength from heavy concentrations in federal government, Texas benefits from its energy sector, and North Dakota gains
strength from a well-developed agriculture sector, an expanding mining sector, and its role as a services center for the
upper Midwest and as a trading route to Canada. These states will rebound in the next 18 months. There will be some
synergy as well. Virginia will recover faster because of its economic integration with the Washington, D.C. area. In this
case, the impetus comes from federal funding and then flows through the private sector across the greater Washington
area.
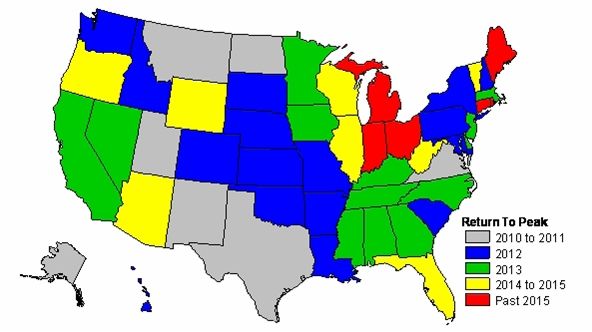
These states will lead the recovery and gain back their lost jobs the quickest—returning to pre-recession employment
levels in the next six to nine quarters. While that might not sound optimistic, it is far better than numerous states in the
Northeast and Midwest, which have suffered severely and will not regain those jobs anytime soon. By the end of its
recession next year, Michigan will have lost nearly 13% of the peak of its job base in 2005; it will take more than a decade
to replace them.
WHEN WILL STATES RETURN TO PEAK EMPLOYMENT?
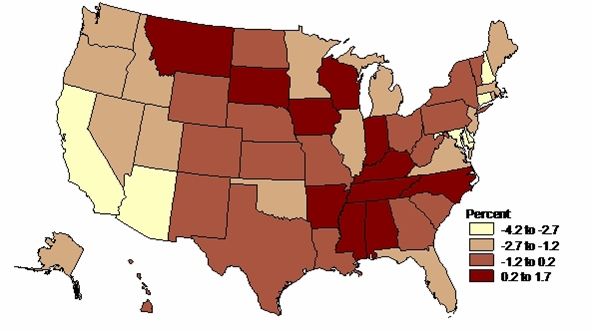
19 IHS Global Insight / AAA Thanksgiving 2009 ForecastReal Estate Market Outlook: Slow Recovery. IHS Global Insight's quarterly State Real Estate Forecast indicates that
prices will continue to decline into 2010, before beginning to moderate, and then climb slowly beginning in late 2011.
Home sales will also see declines again in 2009, with a turnaround beginning in 2010 across most of the country. Nevada,
California, and Arizona were among the only states that saw sales increase in 2008, but these sales consisted mainly of
foreclosed homes being purchased at deeply discounted prices. These areas will see similar sales increases in 2009,
although at a lower rate than in 2008. Foreclosures will continue to drag down the housing market in 2009, but the pace of
loans entering foreclosure will begin to slow in the latter part of the year. Once home sales turn around, prices will begin to
increase, but this cannot happen until the excess inventory of new and existing homes is absorbed. Once this happens,
sales and prices should then see a return to positive growth, and then we can truly enter a period of recovery in the real
estate market.
CHANGE IN EXISTING MEDIAN PRICE, SINGLE-FAMILY HOME, 2009–11
(Average annual percent change)
20 IHS Global Insight / AAA Thanksgiving 2009 ForecastRegional Income Distribution Will Change in Favor of the West and the South. While the road to recovery from the
current economic recession will be a long one, most states will experience significant growth in personal income over the
2009–15 period. Unlike employment recovery, the personal-income-growth outlook provides a clearer picture of the
regional growth pattern. According to IHS Global Insight's Summer 2009 forecast, personal income growth will be
strongest in many western states and in some southern states. This indicates where the post-recession prosperity will be
most pronounced.
PERSONAL INCOME GROWTH, 2009–15
(Average annual percent change)
21 IHS Global Insight / AAA Thanksgiving 2009 ForecastYou can also read