Differences in loading patterns between fast walking and jogging at the same speed in male adults
←
→
Page content transcription
If your browser does not render page correctly, please read the page content below
Li et al. Journal of Leather Science and Engineering            (2020) 2:11
https://doi.org/10.1186/s42825-020-00021-4
                                                                                                                        Journal of Leather Science
                                                                                                                                  and Engineering

 RESEARCH                                                                                                                                           Open Access

Differences in loading patterns between
fast walking and jogging at the same
speed in male adults
Ruoyi Li1,2, Hao Liu1, Mengyuan Guo1, Jitka Badurova3, Luming Yang1,2* and Haojun Fan2

  Abstract
  Fast walking and jogging are two common exercises for people to maintain health in daily life. But the differences
  in loading patterns of fast walking and jogging are still unclear. The purpose of this study was to compare loading
  patterns in fast walking and jogging at the same speed, and to identify how differences in foot mechanics
  influence plantar pressure distribution between the two modes of gait. Totally, 49 healthy males participated in this
  study. Data of pressure parameters, including maximum force (MF), peak pressure (PP), contact area (CA), force-time
  integral (FTI), were recorded by Pedar-X insole plantar pressure measurement system in participants’ fast walking
  and jogging process at 7 km/h. A Load transfer analysis method was used to quantify the plantar load transference
  from fast walking to jogging. The results showed that MF, PP and CA increased in metatarsal regions and midfoot
  regions while decreased in toes regions and heel during jogging when compared with fast walking. FTI decreased
  in all foot regions during jogging compared to fast walking. Under the effects of spring mechanics and the varus of
  rearfoot during jogging, fast walking and jogging reveal different loading patterns. Compared jogging to fast
  walking, load transferred as follow: 1) in transverse direction, load transferred from lateral foot to medial foot in
  metatarsal regions and midfoot regions, 2) in longitudinal direction, load transferred from toes to the metatarsal,
  and from heel to the metatarsal and midfoot. These results also provide suggestions for footwear designs.
  Keywords: Loading patterns, Fast walking, Jogging, Load transfer

1 Introduction                                                                         phases of swing and support [7]. However, fast walking
Fast walking and jogging are both popular forms of exer-                               and jogging gait differ at that the former has a double
cise for humans to maintain health as their moderate ex-                               limb support phase while the latter has a float phase
ercise intensity health [1–4]. Fast walking is determined                              instead [6].
on the basis of natural walking [5]. The walking speed is                                As for fast walking and jogging, few studies have com-
improved to increase the exercise intensity for calorie                                pared the two types of daily exercise. While the plantar
consumption [3]. Jogging is sub-classified from running                                pressure distribution of walking and running has been
by the velocity. In recreational runners, jogging typically                            compared by many researchers [8–10]. Gerych et al. in-
occurring between the speeds of 5–10 mph [6]. The jog-                                 dicated that peak pressure and maximum force signifi-
ging speed can overlap with the fast walking speed. Both                               cantly increased in all foot regions during running, and
fast walking and jogging consist of cyclical subsequent                                contact area significantly increased in midfoot [10].
                                                                                       Chuckpaiwong et al. compared the in-shoe plantar pres-
* Correspondence: ylmll1982@126.com                                                    sure of walking and running, and found that peak pres-
1
 National Engineering Laboratory for Clean Technology of Leather                       sure and maximum force significantly increased during
Manufacture, Sichuan University, Chengdu 610065, China
2                                                                                      running in foot regions while the force-time integral was
 Key Laboratory of Leather Chemistry and Engineering, Sichuan University,
Chengdu 610065, China                                                                  significantly decreased in the rearfoot, lateral midfoot,
Full list of author information is available at the end of the article

                                       © The Author(s). 2020 Open Access This article is licensed under a Creative Commons Attribution 4.0 International License,
                                       which permits use, sharing, adaptation, distribution and reproduction in any medium or format, as long as you give
                                       appropriate credit to the original author(s) and the source, provide a link to the Creative Commons licence, and indicate if
                                       changes were made. The images or other third party material in this article are included in the article's Creative Commons
                                       licence, unless indicated otherwise in a credit line to the material. If material is not included in the article's Creative Commons
                                       licence and your intended use is not permitted by statutory regulation or exceeds the permitted use, you will need to obtain
                                       permission directly from the copyright holder. To view a copy of this licence, visit http://creativecommons.org/licenses/by/4.0/.
Li et al. Journal of Leather Science and Engineering (2020) 2:11 Page 2 of 7
middle forefoot, and lateral forefoot [8]. However, these be placed into the bottom of the shoe. All participants
previous studies were equivocal because the speed as a vari- were sized and fitted with a pair of test shoes (Nike Free
able was not controlled, which was higher in running than 5.0, Nike, America) to counter a possible bias of shoe
in walking. It has been proved that speed could affect plan- type or shoe construction influencing the subjects’ walk-
tar pressure both in walking and running [11–13]. Thus, it ing and running style. The shoe size a US size 8. The
was difficult to distinguish whether the plantar pressure dis- shoes were purchased solely for Pedar data collection
tribution difference was produced by changing the gait pat- and had not been used for any other purpose. The partici-
tern, by the variation in locomotor speed or both factors. pants were requested to wear the same socks provided
Therefore, this study confined fast walking and jogging to during the test. The treadmill (King Smith T211&T221,
the same speed, aiming to eliminate the influence of loco- China) consisted of a walking surface of 1220*420 mm
motor speed. As plantar pressure significantly increased in and could be set to a range of speed from 0.0 km/h to16.0
all foot regions during running in the above studies, we km/h accurately.
hypothesized that plantar pressure would have a great in-
crease during jogging when compared with fast walking. 2.2 Speed selects
In this study, a load transfer analysis method was used In recreational runners, jogging typically occurring be-
to identify how the load transferred from fast walking to tween the speeds of 5–10 mph [6]. But during the pre-test
running. Previous studies had used algorithm and dia- in the participants, it was difficult to continue walking
gram to identify how the load transferred on foot in dif- when the treadmill was set higher than 7 km/h. Also, it
ferent situation [14, 15]. However, a similar approach has reported that when the jogging speed was too slow, it
had not been applied in the comparison of fast walking would differ from typical running by its more characteris-
and jogging. The use of this load analysis method could tic vertical and “bouncy” running style [9]. Therefore, to
promote a better understanding of the differences on avoid the vertical and “bouncy” running style, 7 km/h as
foot loading patterns between fast walking and jogging. the highest fast walking speed for most participants can
It has been reported that walking uses an inverted pen- achieve was selected as the test speed for this study.
dulum model, while running uses a mass-spring model
which can exchanges kinetic and energy very differently. 2.3 Procedure
Muscles and tendons sequentially store elastic strain en- Plantar pressure parameters were recorded as partici-
ergy, and then release the energy through recoil during pants walked and ran on the treadmill at 7 km/h with no
the stance phase [16, 17]. As the component of the slope wearing the same socks and test shoes. Data of
spring mechanism, the longitudinal arch (LA) play a key pressure parameters, including maximum force (MF),
role in the store-release energy process on foot [18, 19]. peak pressure (PP), contact area (CA) and force-time in-
Here we make a hypothesis that the main difference in tegral (FTI), were recorded by Pedar-X insole plantar
the mechanisms of fast walking and jogging was on the pressure measurement system. Prior to testing, all the
function of foot arch. participants had been informed about the procedures. A
Therefore, the purpose of this study was to compare warmup was instructed that included regular stretches
loading patterns in fast walking and jogging at the same as well as walking or running at a preferred speed, giving
speed, and to identify how differences in foot mechanics participants time to familiarize themselves with the
influence plantar pressure distribution between the two treadmill and test shoes. After that, treadmill settings
modes of gait. were adjusted to 7 km/h. Data were collected for 20 s
when the participant walked on the treadmill naturally.
2 Methods And then the participant was instructed to change the
2.1 Participants locomotion into jogging on the treadmill. When the par-
In total, 49 healthy males (age 22.8 ± 1.7 years, body mass ticipant jogging naturally, data would be collected for at
65.3 ± 7.8 kg, height 172.1 ± 3.8 cm), without known neuro- least 20 s. Approximately one-minute rest was provided
logic or lower extremity orthopedic pathology or any bio- during trials if needed.
mechanical abnormality that may affect gait participated in
this study. Informed consent was obtained from each par- 2.4 Statistical analysis
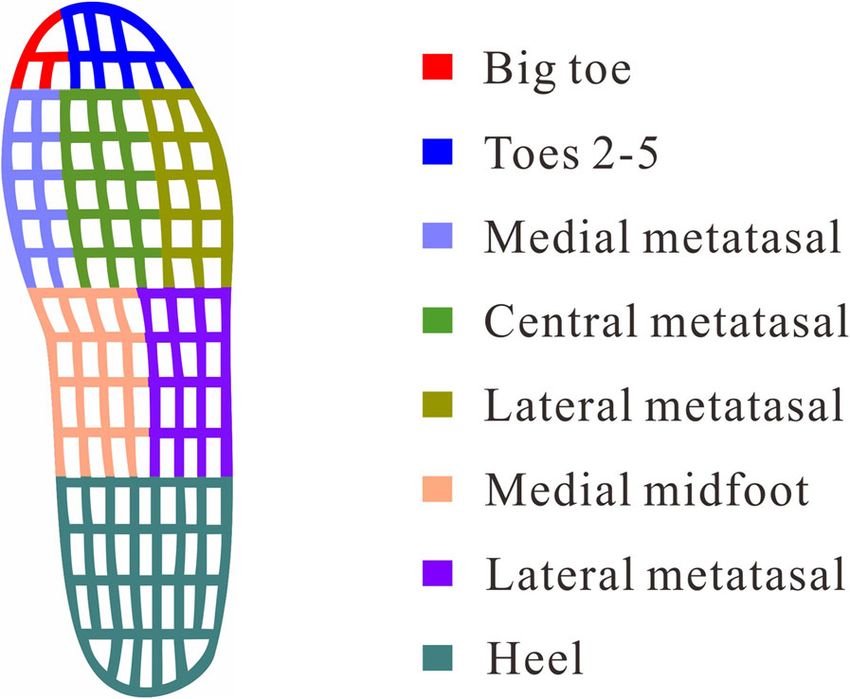
ticipant. The study was approved by the Ethics Committee For the analysis of plantar pressure parameters, the foot
of Sichuan University. was divided into eight anatomical regions (Fig. 1): big
Plantar pressure parameters were measured by Novel toe (BT), toes2–5 (T2–5), medial metatarsal (MM), cen-
Pedar-X in-shoe system (Novel, Munich, Germany) at a tral metatarsal (CM), lateral metatarsals (LM), medial
frequency of 50 Hz. Each pressure insole contained 99 midfoot (MMF), lateral midfoot (LMF) and heel (H). As
capacitive sensors which were calibrated prior to data all participants were right leg dominant, only the right
collection. The insole was flexible so that it could easily foot of each participant was analyzed [20]. For eachLi et al. Journal of Leather Science and Engineering (2020) 2:11 Page 3 of 7
relative FTI of jogging is lower than that of fast
walking (green color regions), and vice versa for a
positive value (yellow color regions).
2. Load transfer within each level from high value
regions to low value regions in transverse (media-
lateral) direction. Load transfer occurs between
adjacent anatomical regions first, and then between
the further regions. After the transfer, the relative
FTI values in each region at the same level tend to
be equal (even in negative values). After the
transfer, the altered values of relative FTI are shown
in red color. The values on the arrows was the
transfer values from one region where the arrow
begins to another region where the arrow ends.
3. After the within-level transfer, load transfers
through levels in longitudinal (anterior-posterior)
Fig. 1 Foot regions direction. Load transfer occurs between adjacent
levels first, and then between the further levels.
participant, the mean plantar pressure parameters were After the transfer, the altered values of relative FTI
calculated based on five successful consecutive steps, are exhibited in red color, which are generally zero.
chosen in the middle of each trial from 20 s of the col-
lected data. Statistical analysis was conducted by SPSS 3 Results
17.0. A Paired-Sample T Test was used to determine the The results showed that fast walking and jogging had
main effects of the experimental conditions. The value different loading patterns. Compared with fast walking,
p < 0.05 was perceived as significant for statistical analysis. MF, PP and CA increased in metatarsal and midfoot re-
gions while decreased in toes and heel regions during
2.5 Load transfer analysis method jogging. Plantar pressure measurements are shown in
A load transfer analysis method was improved which Fig. 2. In contrast to fast walking, MF significantly in-
based on the previous study [14, 15] to quantify the plan- creased during jogging in MM, CM, LM, MMF, LMF,
tar load transference from fast walking to jogging. Since and significantly decreased in BT, T2–5, H. The greatest
FTI is the total load in a certain region of the foot which MF concentrated on H in both fast walking and jogging.
indicates the duration of contact so that the overall load Furthermore, the peak value of MF on H in fast walking
in that region can be fully described, the FTI was calcu- was much higher than that in jogging. PP significantly
lated for each region [15]. FTI was then normalized into increased during jogging in CM, LM, MMF, LMF, and
relative FTI for the contrast between participants. Relative significantly decreased in BT, T2–5, H compared with
FTI was used to assessed the inter-regional load transfer. fast walking. Significant greater contact area was found
in MM, CM, LM, MMF, LMF, and significant lower
FTI ðfoot regionÞ contact area was found in T2–5, H during jogging than
Relative FTI ð%Þ ¼ P 100%
FTI ðfoot regionÞ fast walking. Compared the FTI values with fast walking,
FTI significantly decreased during jogging in all foot re-
Load transference is divided into two parts: 1) transfer- gions. BT, MM and CM were the main loading regions
ence in longitudinal direction and 2) transference in during both fast walking and jogging (Table 1). Mean-
transverse direction, in order to observe the transference while, H also took a great proportion of plantar loading
respectively. Certain rules for the calculation are formu- during fast walking.
lated, as follows: Figure 3 quantifies the plantar load transference from
fast walking to jogging. Difference values of relative FTI
1. Four levels are defined following the anatomical (%) between fast walking and jogging at 7 km/h are indi-
structure along the longitudinal direction: toes cated in Table 1. Compared jogging to fast walking, load
(Level 1, BT and T2–5), metatarsal (Level 2, MM, transferred from BT to T2–5, from LM to MM and CM,
CM and LM), midfoot (Level 3, MMF and LMF) and from LMF to MMF in the transverse direction,
and heel (Level 4, H). The values in each foot showing a trend of transferring load from lateral foot to
region are difference value of relative FTI between medial foot in metatarsal regions and midfoot regions.
the two gait modes (relative FTI of jogging minus In the longitudinal direction, load transferred from level
that of fast walking). A negative value indicates the 1 to level 2, and from level 4 to level 2 and level 3,Li et al. Journal of Leather Science and Engineering (2020) 2:11 Page 4 of 7
Fig. 2 Plantar pressure measurements (*, p < 0.05; **, p < 0.001)
showing that load transferred from toes to the metatar- previous studies which indicate that MF and PP increase
sal, and from heel to the metatarsal and midfoot. in all of the foot regions during running [8, 10]. Because
that locomotion speed could affect the plantar pressures
4 Discussion [11–13] which confuse the effect of changing gait pat-
Our first hypothesis was confirmed that plantar pressure tern in previous studies. Therefore, speed controlling
had a great increase during jogging when compared with should be considered into the comparison of different
fast walking, but the increase only occurred in metatarsal movement modes to eliminate the influence of speeds.
regions and midfoot regions. MF and PP increased in Even at the same speed, fast walking is differentiated
metatarsal and midfoot regions while decreased in toes from jogging in that the former has a period of double
and heel regions. These results are different with limb support which includes the initial contact phase,
loading response phase and pre-swing phase during the
Table 1 Relative FTI (%) in fast walking and jogging at 7 km/h fast walking gait [6]. In the double limb support period,
Foot regions Fast walking Jogging Diff. both feet are in contact with the ground at the same
BT 18.4 17.6 0.8
time. While in the jogging gait, only 1 foot is in physical
contact with the ground in these phases. Additionally,
T2–5 10.2 9.5 0.7
there is a float phase that neither foot was in contact
MM 16.3 20.1 −3.8 with the ground during the jogging gait. Therefore, the
CM 15.2 18.0 −2.8 foot support was stronger to hold the body and drive to
LM 10.1 11.7 −1.6 float during jogging than fast walking, which could result
MMF 5.8 6.4 −0.6 in higher impact on the foot than that in fast walking.
LMF 8.4 8.3 0.1
This provides an explanation that MF and PP increased
during jogging than fast walking in this study. Compared
H 15.7 8.5 7.2
to fast walking, MF and PP increased in metatarsalLi et al. Journal of Leather Science and Engineering (2020) 2:11 Page 5 of 7 Fig. 3 Load transference from fast walking to jogging regions and midfoot regions while decreased in toes and where do not have significant difference between fast heel regions during jogging. This could be caused by the walking and jogging. The great decrease of PP and MF concentration of foot loading on metatarsal and midfoot in toes and heel regions could help reduce the risk of re- regions compared jogging to fast walking. lated injuries, such as foot pain [24] and stress fracture When encumbered with load, the longitudinal arch [25]. Furthermore, to the best of our knowledge, few (LA) lengthen and lower, subsequently recoiling as the shoes were designed especially for fast walking in daily load is removed [21]. Compared with fast walking, the exercise. As fast walking has become more popular, it is compressive deformation in LA was larger because of suggested that shoes for fast walking should be designed the higher force during jogging in metatarsal and mid- based on the specific plantar pressures during fast walk- foot regions. Hence, CA of metatarsal regions and mid- ing to reduce the potential risk of injuries. Besides of the foot regions increased during jogging. The increase of protection on metatarsal and heel in running shoes, CA in these regions during jogging can help relief the shoes designed for fast walking should also provide pro- pressure in these foot regions. The consistent increase of tects in the big toe because of the highest PP in this PP with an accompanied increase in MF during jogging region. compared with fast walking implied that the increase of FTI decreased in all foot regions during jogging com- contact area was not enough to relief the increased pared to fast walking. Since FTI is the total load in a cer- force. tain region of the foot which indicates the duration of In previous studies, peak forces concentrate on fore- contact, both force and ground contact time can affect foot and occur at the end of the stance phase [22, 23]. the FTI values. Additionally, due to plantar force in- However, due to the relatively lower speed in the present creased in many foot regions during jogging, the de- study, the peak MF occurred at the initial contact phase crease of FTI mainly resulted from the reduction of during jogging which was in accordance with fast walk- ground contact time. During fast walking, participants ing. At the initial contact phase during fast walking and shows longer step length to catch the fast speed than jogging in this study, the heel strike generated acute jogging. Compared with fast walking, higher cadence is force on the heel, which caused the result that the great- shown during jogging, which indicate that the time spent est MF concentrated on H in both fast walking and on one gait decreased. Furthermore, previous studies jogging. have indicated that the ratio of stance time to swing Overall, to the aspect of plantar pressures, the risk of time was approximately 62:38 during walking, while in injuries during jogging could be lower than that in fast recreational running the typical ratio was approximately walking. As the greatest-MF region during both fast 35:65 [6]. The decreased of stance phase proportion on walking and jogging, heel had a significantly decrease in jogging gait further contributed to lower contact time MF from 493.9 N to 296.7 N during jogging than that in and lower FTI during jogging. fast walking. While the increase amount of MF in meta- Walking and running are two distinct gait modes tarsal regions and midfoot regions was not that much. which are different in the energy exchange and mechan- As the two of the greatest PP regions during fast walk- ics [6, 26–29]. Walking uses the pendular mechanics ing, BT and H significant decreased during jogging. So which can exchange forward kinetic energy for gravita- that MM became the greatest PP region during jogging tional potential energy during the stance phase. While
Li et al. Journal of Leather Science and Engineering     (2020) 2:11                                                                     Page 6 of 7

running acts as a mass-spring mechanics in which ten-                       LMF → MMF) was revealed. Additionally, running is
dons and ligaments in the compliant lower limb store                        different from walking in what is known as “runner’s
elastic strain energy and then release the energy through                   varus” [6]. When the lateral calcaneus contacts at heel
recoil during the stance phase (Fig. 4, a) [16, 17]. As the                 strike, shod runners show greater rearfoot varus com-
component of the spring mechanism, the longitudinal                         pared to walking. At initial contact, shod runners typic-
arch could maintain flexibility to adapt to alterations in                  ally show a 4° - 8° of varum of the calcaneus [33]. The
surface and loading demand, as well as providing stiff-                     varus of the rearfoot also contributed to the load transfer
ness to complete the forward propulsion [30]. During                        which from lateral foot to medial foot during jogging
fast walking, the less collapse of LA than jogging caused                   compared with fast walking.
that the bearing of foot load were considerably com-                          Limitations still exist in this study. A potential limitation
pleted by toes and heel that toes and heel took a large                     might be the use of a treadmill. The treadmill could con-
proportion of foot loading (44.3%). Due to the stance                       trol the speed accurately during the test, but running on
phase of the gait shortens from about 60% of the gait                       the treadmill was associated with lower plantar pressures
cycle to as little as 30% during running, the considerably                  in foot regions [34]. It was not equivalent to the measure-
reduced stance phase causes increased demands on the                        ments of the ground. Another limitation was that this
foot. Therefore, the spring mechanism of foot arch be-                      study was conducted in healthy males and it was unknown
come active (Fig. 4, b). During stance, LA collapses to                     whether similar findings would be achieved in highly
absorb loading forces as elastic strain energy, and then                    trained athletes, injured participants, old people or chil-
passive elastic recoil which contribute to the generation                   dren where gait parameters would likely vary.
of propulsion. As the component of the LA, metatarsal
and midfoot suffered more proportion of foot loading                        5 Conclusion
during jogging. This also caused the fact that load trans-                  The function of foot arch plays a key role on the difference
ferred from toes to the metatarsal, and from heel to the                    of mechanisms on foot between fast walking and jogging.
metatarsal and midfoot in the longitudinal direction to                     Under the effects of spring mechanics and the varus of
engage the spring mechanism to work effectively during                      rearfoot during jogging, load transferred from lateral foot to
jogging. The second hypothesis that the main difference                     medial foot in metatarsal regions and midfoot regions in
in the mechanisms of fast walking and jogging was on                        transverse direction, and transferred from toes to the meta-
the function of foot arch was then confirmed.                               tarsal, and from heel to the metatarsal and midfoot in lon-
  Further, the LA is consisted of lateral longitudinal arch                 gitudinal direction. As PP had great increases in toes and
(LLA) and medial longitudinal arch (MLA). Actually, the                     heel regions during fast walking than that in jogging, the
MLA has a more elastic structure and play a major role                      risk of injuries in these regions would be higher during fast
in the spring mechanism than the lateral longitudinal                       walking. Since fast walking has become more popular, we
arch [18, 31, 32]. Therefore, the activation of MLA dur-                    suggest that the shoes designed for fast walking should be
ing jogging could cause that foot loading more concen-                      designed based on the specific plantar pressures during fast
trate in the MLA than LLA than that in fast walking.                        walking to reduce the potential risk of injuries. Besides of
Since foot loading more concentrated in the medial lon-                     the protection on metatarsal and heel in running shoes, fast
gitudinal arch during jogging, the transfer of foot loading                 walking shoes should also provide protects in the big toe
from lateral foot to medial foot (LM → MM and CM,                           because of the highest PP in this region.

 Fig. 4 a) The different mechanics of walking and running (During walking, the leg is relatively straight. During running, human flex the knees
 more than that in walking). b) Spring mechanics of arch
Li et al. Journal of Leather Science and Engineering              (2020) 2:11                                                                             Page 7 of 7

Acknowledgements                                                                      14. Bus SA, van Deursen RW, Kanade RV, Wissink M, Manning EA, van Baal JG,
Not applicable.                                                                           et al. Plantar pressure relief in the diabetic foot using forefoot offloading
                                                                                          shoes. Gait Posture. 2009;29(4):618–22.
Authors’ contributions                                                                15. Hu M, Zhou N, Xu B, Chen W, Wu J, Zhou J. The mechanism of force
R.L., J. B., L.Y. and H.F. designed the experiment; R.L., H.L. and M.G. carried out       transference in feet of children ages two to six. Gait Posture. 2017;54:15–9.
the experiment; H.L. and M.G. analyzed experimental data; R.L. and H.L. wrote         16. Claire T, HHPH F, Van Strien C, Louie M. Mechanism of leg stiffness
the manuscript; J. B., L.Y. and H.F. reviewed and improved the manuscript. All            adjustment for hopping on surfaces of different stiffnesses. J Appl Physiol.
authors read and approved the final manuscript.                                           1998;85(3):1044–55.
                                                                                      17. Bramble DL, DE. Endurance running and the evolution of homo. Nature.
Authors’ information                                                                      2004;432(7015):345–52.
Not applicable.                                                                       18. Kelly LA, Lichtwark G, Cresswell AG. Active regulation of longitudinal arch
                                                                                          compression and recoil during walking and running. J Royal Soc Interface.
Funding                                                                                   2014;12(102):20141076.
This work was supported by National Natural Science Foundation of China,              19. Kelly LA, Cresswell AG, Racinais S, Whiteley R, Lichtwark G. Intrinsic foot
grant number: 11502154.                                                                   muscles have the capacity to control deformation of the longitudinal arch. J
                                                                                          Royal Soc Interface. 2014;11(93):20131188.
                                                                                      20. Menz HB. Two feet, or one person? Problems associated with statistical
Availability of data and materials
                                                                                          analysis of paired data in foot and ankle medicine. Foot. 2004;14(1):2–5.
The datasets used and analyzed during the current study are available from
                                                                                      21. MBB RFK, Bibbyt SR, Kestert RC, Alexander RM. The spring in the arch of the
the corresponding author on reasonable request.
                                                                                          human foot. Nature. 1987;325(8):147–9.
                                                                                      22. Pink M, Perry J, Houglum PA, Devine DJ. LOWER-EXTREMITY RANGE OF
Competing interests
                                                                                          MOTION IN THE RECREATIONAL SPORT RUNNER. Am J Sports Med. 1994;
The authors declare that they have no competing interests.
                                                                                          22(4):541–9.
                                                                                      23. Fuglevand J, CFMIM. Ground reaction forces in running: a re-examination. J
Author details
1                                                                                         Biomech. 1987;20(2):147–55.
 National Engineering Laboratory for Clean Technology of Leather
                                                                                      24. Hill CL, Gill TK, Menz HB, Taylor AW. Prevalence and correlates of foot pain
Manufacture, Sichuan University, Chengdu 610065, China. 2Key Laboratory of
                                                                                          in a population-based study: the north West Adelaide health study. J Foot
Leather Chemistry and Engineering, Sichuan University, Chengdu 610065,
                                                                                          ankle Res. 2008;1(1):2.
China. 3Tomas Bata University, 76001 Zlin, Czech Republic.
                                                                                      25. Ostlie DK, Simons SM. Tarsal navicular stress fracture in a young athlete:
                                                                                          case report with clinical, radiologic, and pathophysiologic correlations. J Am
Received: 27 October 2019 Accepted: 30 March 2020
                                                                                          Board Fam Pract. 2001;14(5):381–5.
                                                                                      26. Cappellini G, Ivanenko YP, Poppele RE, Lacquaniti F. Motor patterns in
                                                                                          human walking and running. J Neurophysiol. 2006;95(6):3426–37.
References                                                                            27. Dugan SA, Bhat KP. Biomechanics and analysis of running gait. Phys Med
1. Ho I-J, Hou Y-Y, Yang C-H, Wu W-L, Chen S-K, Guo L-Y. Comparison of                    Rehabil Clin N Am. 2005;16(3):603–21.
    plantar pressure distribution between different speed and incline during          28. Li L, van den Bogert ECH, Caldwell GE, van Emmerik REA, Hamill J.
    treadmill jogging. J Sports Sci Med. 2010.                                            Coordination patterns of walking and running at similar speed and stride
2. Tsatalas T, Giakas G, Spyropoulos G, Sideris V, Lazaridis S, Kotzamanidis C,           frequency. Hum Mov Sci. 1999;18(1):67–85.
    et al. The effects of eccentric exercise-induced muscle damage on running         29. Sasaki K, Neptune RR. Differences in muscle function during walking and
    kinematics at different speeds. J Sports Sci. 2013;31(3):288–98.                      running at the same speed. J Biomech. 2006;39(11):2005–13.
3. Wang WF, Lien WC, Liu CY, Yang CY. Study on tripping risks in fast walking         30. Hicks J. The mechanics of the foot. II. The plantar aponeurosis and the arch.
    through cadence-controlled gait analysis. J Healthc Eng. 2018;2018:2723178.           J Anat. 1954;88(1):25.
4. Chuhong Ma YQ, Tian X. A dynamic observation on college Students'                  31. Birinci T, Demirbas SB. Relationship between the mobility of medial
    cardiopulmonary load in fitness walking and jogging. J Beijing Sport Univ.            longitudinal arch and postural control. Acta Orthop Traumatol Turc. 2017;
    2009;32(5):96–8.                                                                      51(3):233–7.
5. Deguchi K, Enishi T, Sato N, Miura H, Fujinaka Y, Matsuhisa M, et al. Acute        32. Caravaggi P, Matias AB, Taddei UT, Ortolani M, Leardini A, Sacco ICN.
    effect of fast walking on postprandial blood glucose control in type 2                Reliability of medial-longitudinal-arch measures for skin-markers based
    diabetes. Diabetol Int. 2016;7(2):119–23.                                             kinematic analysis. J Biomech. 2019;88:180–5.
6. Lohman EB 3rd, Balan Sackiriyas KS, Swen RW. A comparison of the                   33. Williams KR. Biomechanics of running. Exerc Sport Sci Rev. 1985;13:389–441.
    spatiotemporal parameters, kinematics, and biomechanics between shod,             34. Hong Y, Wang L, Li JX, Zhou JH. Comparison of plantar loads during
    unshod, and minimally supported running as compared to walking. Phys                  treadmill and overground running. J Sci Med Sport. 2012;15(6):554–60.
    Ther Sport. 2011;12(4):151–63.
7. Saibene FMA. Biomechanical and physiological aspects of legged
    locomotion in humans. Europ J App Physio. 2003;88:297–316.                        Publisher’s Note
8. Chuckpaiwong B, Nunley JA, Mall NA, Queen RM. The effect of foot type on           Springer Nature remains neutral with regard to jurisdictional claims in
    in-shoe plantar pressure during walking and running. Gait Posture. 2008;          published maps and institutional affiliations.
    28(3):405–11.
9. Keller TS, Weisberger AM, Ray JL, Hasan SS, Shiavi RG, Spengler DM.
    Relationship between vertical ground reaction force and speed during
    walking, slow jogging, and running. Clin Biomech. 1996;11(5):253–9.
10. Gerych D, Tvrznik A, Prokesova EVA, Nemeckova Z, Jelen K. Analysis of peak
    pressure, maximal force, and contact area changes during walking and
    running with conventional and shock-absorbing insoles in the combat
    boots of the Czech Army. J Mech Med Biol. 2013;13(02):1350042.
11. Chung MJ, Wang MJ. Gender and walking speed effects on plantar pressure
    distribution for adults aged 20-60 years. Ergonomics. 2012;55(2):194–200.
12. Cooper DM, Leissring SK, Kernozek TW. Plantar loading and foot-strike
    pattern changes with speed during barefoot running in those with a
    natural rearfoot strike pattern while shod. Foot. 2015;25(2):89–96.
13. Fourchet F, Kelly L, Horobeanu C, Loepelt H, Taiar R, Millet GP. Comparison
    of plantar pressure distribution in adolescent runners at low vs. high
    running velocity. Gait Posture. 2012;35(4):685–7.
You can also read