Datenbeschreibung - FDZ Data description: Regional Real Estate Price Indices for Germany (RWI-GEO-REDX) - Version 2: 2008-02/2019 - RWI Essen
←
→
Page content transcription
If your browser does not render page correctly, please read the page content below
Datenbeschreibung

RWI – Leibniz-Institut für Wirtschaftsforschung

FDZ Data description:
Regional Real Estate Price Indices for Germany
(RWI-GEO-REDX) - Version 2: 2008-02/2019
Larissa Klick
Sandra Schaffner
Impressum

Herausgeber:
RWI – Leibniz-Institut für Wirtschaftsforschung
Hohenzollernstraße 1–3 | 45128 Essen, Germany

Postanschrift:
Postfach 10 30 54 | 45030 Essen, Germany

Fon: +49 201–81 49-0 | E-Mail: rwi@rwi-essen.de
www.rwi-essen.de

Vorstand
Prof. Dr. Christoph M. Schmidt (Präsident)
Prof. Dr. Thomas K. Bauer (Vizepräsident)
Dr. Stefan Rumpf

© RWI 2019
Der Nachdruck, auch auszugsweise, ist nur mit Genehmigung des RWI gestattet.

RWI Datenbeschreibung
Schriftleitung: Prof. Dr. Christoph M. Schmidt
Gestaltung: Daniela Schwindt, Magdalena Franke, Claudia Lohkamp

FDZ Data description:
Regional Real Estate Price Indices for Germany (RWI-GEO-REDX) - Version 2:
2008-02/2019
Larissa Klick
Sandra Schaffner
Datenbeschreibung

 RWI – Leibniz-Institut für Wirtschaftsforschung

 FDZ Data description:
Regional Real Estate Price Indices for Germany
 (RWI-GEO-REDX) - Version 2: 2008-02/2019
 Larissa Klick
 Sandra Schaffner
Regional Real Estate Price Indices for Germany (RWI-GEO-REDX)

List of contents
List of tables and figures .................................................................................................................4
1 Introduction .....................................................................................................................5
2 Data .................................................................................................................................6
3 Methodology ....................................................................................................................8
4 Results .............................................................................................................................9
5 Data Access ..................................................................................................................... 17
6 References ..................................................................................................................... 18
7 Appendix ....................................................................................................................... 20

 3
RWI

List of tables and figures

Table 1 Changes in the Time Effect on District Level ...................................................................... 10
Table 2 Explanatory Variables in Analysis of House, Apartment and Rent Prices .................................. 20

Figure 1 Time development of the German Price Indices for House Purchases, Apartment Rentals and
 Apartment Purchases ......................................................................................................... 10
Figure 2 Distribution of the Regional Price Index for House Purchases ...................................................11
Figure 3 Regional price indices in 2018 on district level and municipality level for house purchase .......... 13
Figure 4 Regional price indices in 2018 on district level and municipality level for rental apartment......... 14
Figure 5 Regional price indices in 2018 and change in regional price index between 2008 and 2018 for
 apartment purchase on district level .................................................................................... 15
Figure 6 Change in regional price index between 2008 and 2018 on district level................................... 16

4
Regional Real Estate Price Indices for Germany (RWI-GEO-REDX)

1 Introduction
 An important issue in the current German public and political discourse is the development of
housing prices. Sharply increasing rents, shortage of living space in urban areas and rural exodus
are some of the discussed problems. Despite its topicality, few data are available on the recent de-
velopment of housing prices in Germany. To fill this gap, the RWI-GEO-REDX data
(Klick/Schaffner/RWI 2019) set quantifies regional differences in house purchase and apartment rent
prices on the level of districts (Kreise, NUTS 3-level) and municipalities (Gemeindeverband, LAU 1-
level) as well as labor market areas defined by RWI (2018).
 Several methods are used to derive real estate indices. First, median sales prices are the easiest to
construct and are used by the U.S. Census Bureau. However, they do not adjust for the quality of
properties that are on the market (Ghysels et al. 2013). Case and Shiller (1987) propose a repeat-
sales price index that is a constant-quality index and only uses information about homes that trans-
act at least twice during the sample period. Very little data is needed for this index. However, those
properties may not be representative of the population (Clapp/Giacotto 1998) and the index is based
on the crucial assumption that quality does not change due to renovation or modernization. This
second method is used for the HPI Index by the US Federal Housing Finance Agency.
 Third, hedonic price indices are based on hedonic price regressions where the price is expressed
as a function of characteristics. The quality, therefore, depends on the choice of characteristics. For
all three index types it is essential that selling a property can be correlated with local economic
conditions as more expensive homes will tend to be put on the market in expansionary times. Gatzlaff
and Haurin (1998) take the selectivity of using only sold houses into account. Englund, Quigley and
Redfearn (1998) combine the hedonic index with the repeat-sales index. Finally, there are stock
market based indices that are obtained by the trading of real estate investment trust stocks.
 While a simple study on the regional mean price of apartment rents and house purchases is not
sufficient for reliable statements on housing prices, the RWI-GEO-REDX is based on hedonic price
regressions. The hedonic price regressions account for qualitative differences of residential offers,
such as different facilities. Hedonic price regressions are a commonly used method for real estate
pricing in Germany, e.g. in the hedonic EPX by the Europace AG (2018) which is a commercial online
distributor of real estate financing, and the real estate price index by Verband deutscher Pfandbrief-
banken e V. (vdp) (2018) handling transaction data from certain financial institutions. The real estate
price index by bulwiengesa AG (2018) focuses on cities and larger towns but it does not contain
coherent information on data structure and methodology, and it is available for commercial use
only. The AK OGA, a cooperation of all German federal review committees on real estate topics,
publishes housing price indices on different house types on a yearly basis and on federal and sub-
district level. These price indices are partly obtained by median sales observation and hedonic price
regressions. Furthermore, the IMX offer index is a hedonic price index that is developed from placed
offers from the online real estate ImmobilienScout24 for house or apartment sales and rents.
 The first two indices report the changes in housing prices on a national level, and they do not give
further information for smaller regions. This study fills this gap by combining a comprehensive up-
to-date dataset and a hedonic price regression; it offers regional price indices to the German mean
capturing regional differences, the region-specific time trend as well as the national development
over time. The analysis is based on a dataset of online real estate advertisements, the RWI-GEO-
RED. This comprehensive dataset is obtained from ImmobilienScout24. The data are updated regu-
larly, allowing for the analysis of recent developments. Hence, it is possible to update the price
indices on a regular basis. Furthermore, the dataset covers all of Germany, and thus price indices
on district and municipality are available.

 5
RWI

 Here, we opt for a hedonic price regression for the price indices to capture various features of the
sales and rent prices beyond the observation of the median. The repeat-sales approach is possibly
not representative for the German real estate market, as Voigtländer (2017) mentions. Here, it also
rules out due to the data limitation to connect two sales of the same object.
 While, other published price indices are developed via financial data, the following analysis deals
with seller-placed offers. This means that only apartments and houses that are for rent or for sale
and offered on the listing website are available in the dataset. Therefore, the analysis is based on
advertising prices and not on transaction prices.
 Additionally, to the first version of RWI-GEO-REDX 1, indices for apartment purchase are also in-
cluded in the dataset and complement the regional price information on house purchase and rental
apartments. All three offering categories are also given on labor market area according to the de-
lineation of RWI (2018). Moreover, recent regional information and the German time trend is also
released as a quarterly index. Besides these additions, the used dataset RWI-GEO-RED includes im-
puted data on municipality and district level, so we gained more observations in all three property
categories.

2 Data
 We use the RWI-GEO-RED data of the FDZ Ruhr at RWI to generate the price indices. They are based
on real estate offers published on the largest German listing website ImmobilienScout24. It gives
real estate owners and estate agents the opportunity to advertise their objects for a fee. All infor-
mation is provided by the owner or the agent who sells or rents out the object. While some infor-
mation must be provided to place an advertisement online, most information is supplied at the dis-
cretion of the seller. However, more information on the object helps to present it adequately, and
likely increases the chance of selling or renting.
 The dataset entails information on prices of real estate offerings as well as on various characteris-
tics that determine the value of a property. It is dealt with monthly data. Detailed information on the
dataset can be found in Boelmann/Schaffner (2019). The present dataset covers January 2007 until
March 2019. There are only little observations in 2007 we therefore restrict the data to the years 2008
to February 2019 in the following. The restriction to the first two month in 2019 is to prevent a look
ahead bias in the time trend.
The RWI-GEO-RED offers information on the 1km2 grid 2, municipality, district and federal state of the
building. Further, the data covers information on the size of the house or the apartment (e.g. living
space, plot area, number of rooms), on its facilities (e.g. balcony, garden, bath rooms, level of facil-
ities), financial aspects (e.g. price and additional costs) as well as information on energy consump-
tion. Unfortunately, some variables are characterized by many missing values, which needs to be
considered for the following analysis.
 The selection of variables for the analysis is based on two considerations. First, we aim for coher-
ence in the dataset, to ensure comparability between properties. Second, the set of features used in
the analysis needs to be comprehensive enough to capture the various characteristics of apartments

1Klick, Larissa; Schaffner, Sandra;RWI (2019): Regional Real Estate Price Index. RWI-GEO-REDX. Version:1. RWI –
Leibniz-Institut für Wirtschaftsforschung. Dataset. http://doi.org/10.7807/immo:redx:v2. The here described
data set is an updated version of the previous first version of RWI-GEO-REDX.
2 INSPIRE (Infrastructure for Spatial Information in Europe) regulation.

6
Regional Real Estate Price Indices for Germany (RWI-GEO-REDX)

and houses in Germany. Table 2 in the Appendix gives an overview of the characteristics that are
included in the analysis. To come as close to the real market price of the property as possible we
include only the advertisements in the last month published when they then exit the listing website.
Formerly updated versions of the listed apartment or house are not considered. This strategy aims
to approximate the actual selling price best with the issued self-reporting advertising price.
 We exclude luxury apartments from the analysis. To this end, apartment with rents exclusive utili-
ties above 5 000 Euro per month are omitted from the analysis. The living area is restricted to 15 to
400 sqm and not more than 7 rooms per apartment. These restrictions still cover a very large range
of rent prices and living space, but it discards the extremely small or exclusive apartments from the
portfolio: 0.4 percent of the observations from the original sample are dropped for rental apartments
It is likely that the luxury apartment market is not fully integrated with average rental market, mak-
ing any comparison over regions across the markets difficult. We further set a bottom limit of 15 sqm
living space to include only self-efficient apartments and to exclude typing errors.
House purchases are restricted in a similar fashion; the living area ranges from 50 to 600 sqm and
the house price varies up to 5 Million Euro. The number of rooms is restricted to 15. The aim, here,
is to ensure self-efficiency but rule out possibly faulted and extremely luxurious objects as above.
The focus of the analysis of house purchases lies on single-family homes, thus, apartment buildings
are excluded. Furthermore, holiday homes are excluded if declared explicitly so by the seller as well
as houses with more than five floors. The data is reduced by 5.2 percent after imposing these re-
strictions and excluding incomplete observations. The constraints imposed on the offers for apart-
ment purchase likewise. Offered apartments with a price higher than 2 Million Euro, more than eight
rooms and an adverted living area below the 1st percentile (27 sqm) and above the 99th percentile
(230 sqm) are not accounted for in the following estimation. The restrictions reduce the number of
observations in this category by 2.4 percent.
Differently to the first published version of the indices, weakly georeferenced data was imputed, and
observation dropped due to missing georeferenced data decreased on 0.7% in house purchase being
around 12 percent before and on 0.002% for rental apartments, decreased from almost 5 percent,
and 0.003% for apartment purchase. The share of weakly georeferenced observations lessens enor-
mously due to the imputation and increases the regional coherence of the data.
 When placing the advertisement online, the user decides which information to publish on the ad-
vertised real estate. Working with these self-declared information leads to many missing values in
most variables that need to be handled with care. For the binary variables a missing is accounted
for as a zero, so the offer does not meet the feature in question. This seems reasonable to the extent
that the user tends to publish benefits of the real estate to attract searchers with certain preferences.
Furthermore, in some years many characteristics are collected using checkboxes which means that
there is no difference between “no” and “no answer”. Examples are especially positive characteris-
tics of the object, such as a balcony or guest toilet. In the analysis, we deal with missing values as a
separate category for categorical variables. In the considered metric variable, number of rooms,
missing values are given as "zero rooms".
 We compute the price indices for districts and municipalities based on the regional definitions of
2015. In 2015, there were 402 districts of different area and population size in Germany. Further,
there were 4,542 municipalities (Verbandsgemeinden). As supplement in this dataset we included
labor market areas (Arbeitsmarktregionen) according to the delineation of version 1 in RWI (2018)
as a third region type defining 182 areas from the 402 administrative districts. This delineation is
beneficial to model real estate price indices as it follows the idea of accessibility of labor markets
for commuters. The labor market borders are drawn from existing commuting interrelations. The

 7
RWI
advantage, here, is that the reality of these interrelations is a stronger determinant for the residence
decision and, thus, the real estate market than the pure administrative regions.
3 Methodology
Regional price indices should account for characteristics of the facility as well as for regional and
time differences. Hence, we first develop a hedonic price regression which considers characteristics
of the real estate advertisements. The regression is comparable to common hedonic price regres-
sions (e.g. Sirmans 1996) as applied for Germany in Bauer et al. (2013), for example.
As the dependent variable the purchase price per square meter is used for purchases prices and
the exclusive rent price (Kaltmiete) per square meter for rental apartments. The endogenous variable
is thus given independently from the size of the apartment or house. Other features that determine
the rental or purchase price are included in the hedonic price regression as exogenous variables.
We include the number of rooms, the year of construction, an indicator for first occupancy, the avail-
ability of a guest toilet and a categorization of the equipment and fittings of the object for all three
offering categories. Moreover, the hedonic characteristics are complemented individually in each
offering category. For example, objects published in house purchase are valued due to their plot
area and type of house, while rental apartments are rated whether they have garden and balcony
access or a fitted kitchen. The individual features for apartment purchase are more comprehensive
and also include information on the character of the house like the category of number of floors in
the building and on which floor the apartment itself is located and whether a lift is available addi-
tionally to the features for apartment rent. (cf. Table 2)
The aim of the indices is to show the time development of housing prices for Germany, their re-
gional differences as well as the regional time development. For estimation of these three types of
indices different models are needed. First, we apply the following model to estimate price indices
for the overall time development in Germany:
ln� � = + + + , (1)
with the dependent variable representing the sale or rent price per sqm of the single real estate
advertisement in region (districts, municipality or labor market area) in year . The characteris-
tics of the property are included in vector . The characteristics in the hedonic regressions vary
between rental apartments, apartment and house purchase; a list of the used features is given in
the Appendix.
This first model comprises a time-independent price index for region (fixed effect). Further-
more, year fixed effects are included. The time development in Germany is described by the de-
velopment of for each year = {2008, … ,2019}, respectively each quarter =
{2008 1, 2008 2, … ,2019 1} Since all regions and years are studied jointly, it is assumed that
the characteristics are valued in the same way for all years and all regions. The error term is
assumed to be normally distributed with mean 0.
The second regression describes a yearly cross-sectional approach with a regional price index 0
for a specific year 0 :
ln� 0 � = 0 + 0 + 0 (2)
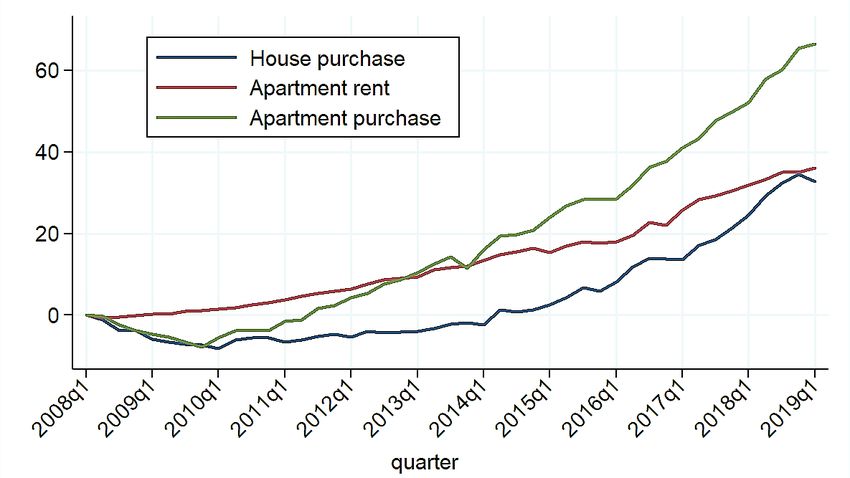
8Regional Real Estate Price Indices for Germany (RWI-GEO-REDX) In this approach, it is assumed that characteristics are valued the same way during the respective time 0 , given yearly from 2008 to 2018 and for the last quarter of 2018, and in the respective re- gion, being all three region types for yearly indices and labor market and administrative districts for the last quarter. The price index 0 , therefore, indicates the price differences between the re- gions in a given time period if all characteristics of housing are identical. The index from this re- gression, therefore, describes the regional price discrepancy for a property of the same quality to the German mean of all offered properties in this specific time period on the listing website. In other words, what is the regional premium for a square meter of living property of the same qual- ity and features to all listed objects in the respective year. The first approach gives insights into the overall time development while the second gives in- sights into year-specific time differences. However, besides differences in the absolute price also different regional developments over time are of interest for research and political discussion. We, therefore, apply a third approach to measure the respective time development of regions via the year-region fixed effects : ln� � = + + (3) The specific time development in region between year 0 and 1 can be derived by 1 − 0 . The main assumptions in this analysis are similar to the ones in equation 2 that characteristics are valued the same in every region and across years. Additionally, the time development can differ between regions. This approach is deployed for all three region types on a yearly basis. 4 Results Figure 1 presents the time development of the German price indices. The house and apartment prices decreased in the beginning of the period by almost 5 percentage points from 2008 to 2009. While apartment rents recovered quickly and exceeded the 2008 value already in 2009, the price for apartments got at the 2008 level in 2011 and house purchases not before 2014. All three offering types experienced vast price increases afterwards. The apartment prices already catch up the devel- opment of rents in 2013. The advertised prices for apartments for sale are 69.4 percent higher in February 2019 than in 2008. The house prices increase in the same period by 36.0 percentage points, which is still a large growth given the short time span and consumer price indices rising by just 13 percent between 2008 to 2018. (cf. Table 1) In contrast to house purchase prices, apartment rent prices increase monotonically between 2008 and February 2019. During this period rents increase by more than 36 percent with the sharpest rise between 2016 and 2017 by almost 8 percentage points. The sharpest rise in house purchase was between 2017 and 2018 by more than 12.5 percentage points and 13.5 percentage point between 2017 and 2018 for apartment purchase. However, as the analysis is based on advertisements for new rental contracts, it is likely that price increases are much smaller for current tenants staying in the same apartment. 9
RWI

Figure 1
Time development of the German Price Indices for House Purchases, Apartment Rentals and
Apartment Purchases
Change in percentage points to base quarter 2008q1, based on regression 1 on district level

Table 1
Changes in the Time Effect on District Level
Reference Year 2008
 Consumer
 House Rental Apartment
 Price Index
 Purchase Apartment Purchase
 (2008=100)
 2008 0,00 * 0,00 * 0,00 * 100,00
 2009 -4,53 * 0,96 * -4,57 * 100,33
 2010 -4,13 * 2,49 * -2,61 101,41
 2011 -3,33 * 5,16 * 2,07 * 103,59
 2012 -2,20 * 8,22 * 8,32 * 105,66
 2013 -0,54 11,31 * 14,15 * 107,18
 2014 2,59 * 15,21 * 20,97 * 108,27
 2015 7,43 * 17,23 * 29,02 * 108,81
 2016 14,34 * 20,82 * 35,50 * 109,36
 2017 20,51 * 28,69 * 47,98 * 110,99
 2018 33,18 * 34,23 * 61,48 * 112,95
 2019 36,01 * 36,41 * 69,37 * -
Source: Destatis [2019] for Consumer Price Index. Time effects based on fixed effects in regression 1 gives
change in in percentage points.
* indicates that the estimated coefficient is significantly different from 0 (reference year 2008) on the 90%-
confidence level.

10
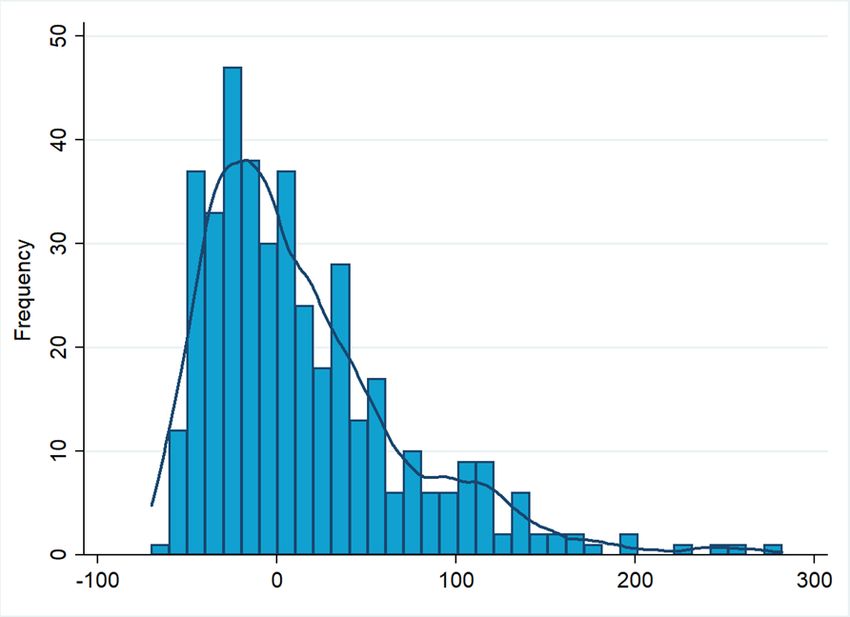
Regional Real Estate Price Indices for Germany (RWI-GEO-REDX)

 Seventeen of the 30 most expensive districts are in the federal state of Bavaria 3. The high prices of
Munich and Frankfurt spread out to the surrounding districts while other cities like Düsseldorf, Co-
logne and Hamburg also appear in the top 30 but there is less dispersion into the surrounding
districts. However, there is spreading into the suburbs on the municipality level (Figure 3). The re-
gions around Hamburg, the Rhine-Ruhr area, Frankfurt and Berlin are good examples for the house
price expansion around economic centers also depending on the infrastructural connection.

Figure 2
Distribution of the Regional Price Index for House Purchases
Change in percentage points to base quarter 2008q1, based on regression 1 on district level

A representation of the kernel density estimator based on Epanechnikov kernel is displayed additionally to the
histogram of the regional price index.

 Figure 2 displays the distribution of the house purchase price indices on district level. The distri-
bution is right skewed. The majority of districts has a value between -50 and 50 but there are several
districts that reach values of more than 200 and 300. However, the distribution changes if the dis-
tricts are weighted by the number of advertisements. Most of the districts at the right end of the
distribution are highly populated. Further, this graph illustrates that the development of the big
cities at the higher end of the distribution discussed in media is not representative for the majority
of regions.
 The change rates of house prices between 2008 and 2018 are also highest in the regions displaying
a high price level in 2018. Especially urban regions but also some smaller local centers and medium-

3The size and number of districts differ between federal states. Bavaria has smaller districts than most other federal
states.

 11
RWI

large towns like Münster, Rostock and the city of Ulm display high change rates. There are 17 (mainly
rural) districts with a negative price development, respectively a lower nominal price index in 2018
given objects of the same features and qualities as in 2008. The largest decrease of 13 percent be-
tween 2008 to 2018 is in Freudenstadt (Baden-Württemberg), followed by Northeim and Holzminden
(both Lower Saxony) as well as Kusel and Birkenfeld (both Rhineland-Palatinate). When looking at
rental prices, the city of Munich is the unchallenged number one with an average price level that is
twice as high as the nation-wide mean. The city of Munich is followed by Stuttgart, the district of
Munich, Frankfurt/Main, and the district of Starnberg. Districts and smaller district-free cities outside
agglomerations across Germany are found at the lower end of the scale. Among the larger cities,
Chemnitz is the city with the lowest rents with prices being 37% lower than in the rest of Germany.
The change rate of the regional price indices for rental apartments is highest in Stuttgart, with rents
being 108 percentage points higher in 2018 than in 2008. After that Munich, Berlin and the rural
district of Munich follow Stuttgart. While Berlin experienced a strong increase in the rent prices
during the 2010s years of 67 percentage points for 2008 to 2018 in the new rents, the capital is still
only on 24th place for apartment rent indices in 2018. Berlin is excelled by smaller cities like Düssel-
dorf, Erlangen, Darmstadt and Heidelberg as well as all other cities with over one million inhabitants
(Munich, Hamburg and Cologne). Whereas decreasing prices indices could be observed in some
regions for house purchase, rental apartment increase in all districts during 2008 and 2008. Also,
the time trend displays a steady increase of rents on the German rent market.
 The index describing the apartment purchase similarly to the rental market shows peaks in the city
of Munich and the surrounding districts in 2018. An exception to this peak category is the district of
North Frisia, which is rural and economically intermediately developed but has a thriving touristic
sector on the island Sylt, with a high demand for holiday apartments. Although controlling for va-
cation properties, this high demand influences the apartment purchase market in this region
strongly. This district also experiences the fourth highest increase in apartment prices since 2008
only being surpassed by the city and district of Munich and the region Miesbach. Rural areas in the
German East but also other remoter areas in Western federal states lie at the lower end of the apart-
ment prices in 2018. Apartment purchase displays mainly an urban property market as many of the
scarcely populated district reflect only a small number of observations in this field. The increase of
property prices in the metropolitan areas is, thus, enforced in this real estate category, as the market
of apartment sales lies predominantly in regions with a high price level.

12
Regional Real Estate Price Indices for Germany (RWI-GEO-REDX)

Figure 3
Regional price indices in 2018 on district level and municipality level for house purchase
Deviation in % from the German mean

 (a) District level (b) Municipality level
Only regions with at least 50 observations are displayed. Indices based on cross-sectional regressions in equation 2.

 13
RWI

Figure 4
Regional price indices in 2018 on district level and municipality level for rental apartment
Deviation in % from the German mean

 (a) District level (b) Municipality level
Only regions with at least 50 observations are displayed. Indices based on cross-sectional regressions in equation 2.

14
Regional Real Estate Price Indices for Germany (RWI-GEO-REDX)

Figure 5
Regional price indices in 2018 and change in regional price index between 2008 and 2018 for apartment purchase on district level
Deviation in % from the German mean (left) and change in percentage points (right)

 (a) Regional price indices (b) Change in regional price
Only districts with at least 50 observations in 2018, respectively 2008 and 2018, are displayed. Indices based on equation 2 on the left and equation 3 on the right.

 15
RWI

Figure 6
Change in regional price index between 2008 and 2018 on district level
Change in percentage points

 (a) House purchases (b) Rental apartments
Only districts with at least 50 observations in 2008 and 2018 are displayed. Indices from cross-sectional and time variation following equation 3.

16
Regional Real Estate Price Indices for Germany (RWI-GEO-REDX)

The results indicate that prices rise most strongly in urbanized areas for both sale prices as well as
rental prices. Sale prices in the metropolitan area around Munich show an exception in house price
increases since the whole region – including more rural areas – experiences large increases. In
other regions, the urbanized independent cities show the highest changes. One can detect partially
higher rises in areas with generally low house prices, especially in the Eastern Federal States, which
possibly suggest a slow catch-up to West German sales prices. On the contrary, some rural regions
seem to lag far behind in the observed house price increase and two East German and 15 West
German districts even show decreases in nominal prices since 2008.
 When it comes to changes in rental prices, the South of Germany experienced strong positive
changes which cluster immensely around Munich and further South, as well as adjacent to Frankfurt
and Stuttgart. In East Germany, rental prices increase less compared to house prices, except for the
districts around Berlin and other large cities like Leipzig and Dresden.
 The range of change is much higher for sale prices than for rental prices. While regional differences
for apartment rents are already smaller than for house sales prices, this pattern seems to become
more pronounced. Some urban centers face house sales price that are disproportionally larger than
their rental price increase, and some rural areas experience a fall in house prices which is larger
than their development in rental prices.

5 Data Access
 The data can be obtained as a Public Use File by the FDZ Ruhr at RWI. The FDZ Ruhr is the research
data center at the RWI – Leibniz-Institute for Economic Research. The data is open for public use.
The dataset only covers indices that rely on the regions with at least 50 observations per year. We
also provide the indices that base on less than 50 observations as Scientific Use File upon request.
However, we assume that the observations are too small for estimating reliable values. Since the
RWI-GEO-REDX subsumes aggregated information it does not contain information with restricted
use due to data security. The presented indices can be obtained as Excel (.xlsx) file.
 Data access does not require a data use agreement, but users need to register for data access.
Interested users should register via email to fdz@rwi.essen.de. The email needs to include infor-
mation on the applying department or person as well as the desired data format. The users are
requested to cite the source correctly and to inform the FDZ Ruhr about publications with the data.
 When using the dataset RWI-GEO-REDX, please cite the data as Klick, Larissa; Schaffner, Sandra;
RWI; ImmobilienScout24 (2019): RWI-GEO-REDX: Regional Real Estate Price Index for Germany,
2008-02/2019. Version: 2. RWI – Leibniz Institute for Economic Research. Dataset.
http://doi.org/10.7807/immo:redx:v3. Further, we recommend citing this data description.

 17
RWI

6 References
Bauer, T.K., S. Feuerschütte, M. Kiefer, P. an de Meulen, M. Micheli, T. Schmidt, and L.-H. Wilke
(2013), Ein hedonistischer Immobilienpreisindex auf Basis von Internetdaten: 2007-2011. AStA Wirt-
schafts- und Sozialstatistisches Archiv 7(1): 5-30.
Boelmann, B. und S. Schaffner (2019), FDZ Data description: Real-Estate Data for Germany (RWI-
GEO-RED v1) - Advertisements on the Internet Platform ImmobilienScout24 2007-03/2019. RWI Pro-
jektberichte, Essen.
bulwiengesa AG (2018), Bulwiengesa-Immobilienindex 1975-2017.
https://www.bulwiengesa.de/sites/default/files/immobilienindex_2018.pdf, 2018. (Online; accessed
23/11/2018).
Case, B., H. Pollakowski and S. Wachter (1991). On Choosing Among House Price Index Methodolo-
gies. AREUEA Journal 19(3): 286-307.
Case, K.E. and R.J. Shiller (1989), The Efficiency of the Market for Single-Family Homes. The American
Economic Review 79(1): 125-37.
Clapp, J. and C. Giaccotto (1992), Estimating Price Trends for Residential Property: A Comparison of
Repeat Sales and Assessed Value Methods, Journal of Real Estate Finance and Economics 5(4) 357-
374.
Der Obere Gutachterausschuss für Grundstückswerte im Land Nordrhein-Westfalen (2017), Grund-
stücksmarktbericht 2017, Nordrhein-Westfalen.
https://www.boris.nrw.de/borisfachdaten/gmb/2017/GMB_000_2017_pflichtig.pdf. (Online; accessed
11/10/2018).
Destatis (2018), Verbraucherpreisindex (inkl. Veränderungsraten): Deutschland (accessed 3/12/2018).
Englund, P., J. Quigley and C. Redfearn (1998), Improved Price Indexes for Real Estate: Measuring
the Course of Swedish Housing Prices, Journal of Urban Economics, 44(2), 171-196.
Europace AG (2018), Index EPX hedonic. https://www.europace.de/index-epx-hedonic/ (Online; ac-
cessed 23/11/2018).
Gatzlaff, D.and D. Haurin (1998), Sample Selection and Biases in Local House Value Indices Journal
of Urban Economics, 43(2), 199-222.
Ghysels, E., A. Plazzi, R. Valkanov, and W. Torous (2013), Forecasting Real Estate Prices. In: G. Elliott
and A. Timmermann (Ed.), Handbook of Economic Forecasting, Vol. 2A, Amsterdam: Elsevier, 509-
579.
Gutachterausschuss für Grundstückswerte in Sachsen-Anhalt (2017), Grundstücksmarktbericht Sach-
sen-Anhalt 2017.
Jud, D., T. Seaks (1994), Sample Selection Bias in Estimating Housing Sales Prices, The Journal of
Real Estate Research 9(3), 289-298.
Klick, Larissa; Schaffner, Sandra; RWI (2019): Regional Real Estate Price Index. RWI-GEO-REDX. Ver-
sion:1. RWI – Leibniz-Institut für Wirtschaftsforschung. Dataset. http://doi.org/10.7807/immo:redx:v2.
Klick, Larissa; Schaffner, Sandra; RWI; ImmobilienScout24 (2019): RWI-GEO-REDX: Regional Real Es-
tate Price Index for Germany, 2008-2/2019. Version: 2. RWI – Leibniz Institute for Economic Research.
Dataset. http://doi.org/10.7807/immo:redx:v3.

18
Regional Real Estate Price Indices for Germany (RWI-GEO-REDX)

RWI (2018), Überprüfung des Zuschnitts von Arbeitsmarktregionen für die Neuabgrenzung des GRW-
Fördergebiets ab 2021. RWI Projektberichte. http://www.rwi-
essen.de/media/content/pages/publikationen/rwi-projektberichte/rwi-
pb_zuschnitt_arbeitsmarktregionen.pdf. (Online, accessed 10/07/2019).
Verband deutscher Pfandbriefbanken e V. (vdp) (2018), INDEX: Der Immobilienpreisindex des vdp.
https://www.pfandbrief.de/site/dam/jcr:81e36766-320c-4e28-b7b4-
5d41cbb7ef26/vdp_Index_Q32018_bro_DE.pdf. (Online; accessed 23/11/2018).
Voigtländer, M. (2017), Real Estate Data Sources in Germany, in: T. Just and W. Maennig (Ed.), Un-
derstanding German Real Estate Markets, Cham: Springer, 3-16.

 19
RWI

7 Appendix

Table 2
Explanatory Variables in Analysis of House, Apartment and Rent Prices

 apart- apart-
 house-
 Variable Description ment- ment Restrictions
 purchase
 rent purchase
 Metric variable
 restricted to 15 (houses),
 number of rooms in 7 rooms (apartment rent)
number of rooms x x x
 apartment and 8 rooms (apartment
 purchase), repectively
 Categorical variables
 1:=missing x
 2:=1-3 floors
 number of total
 3:=4-5 floors
 floors
 4:=6-10 floors
 5:=more than 10 floors
 0:=missing x
 1:=ground floor (UG)
 2:=first floor (EG)
 floor number of ob-
 3:=2nd to 3rd floor
 ject
 4:=4th to 5th floor
 5:=6th to 10th floor
 6:=above 10th floor
 0:=missing x x x
 1:=Simple
 equipment 2:=Normal,
 3:=Sophisticated,
 4:=Exclusive
 Binary variables
 1:=missing x x x
 2:=before 1900
 3:=1900-1945
 4:=1946-1959
 5:=1960-1969
 year of construction
 6:=1970-1979
 7:=1980-1989
 8:=1990-1999
 9:=2000-2009
 10:=after 2009
 [in sqm] x
 plot area
 0:=missing

20
Regional Real Estate Price Indices for Germany (RWI-GEO-REDX)

 1:=(0-200]
 2:=(200-400],
 3:=(400-600] restricted to 2 500 sqm
 due to possible agricul-
 4:=(600-800] tural use[1]
 5:=(800-1 200]
 6:=(1 200-2 500]
 1 if new owner or renter
first occupancy move in as first occu- x x x
 pancy
detached house 1 if house is detached x
semi-detached 1 if house is semi-de-
 x
house tached
 1 if house is a terrace
terraced house x
 house
 1 if property is declared as
exclusive house x
 a mansion or castle
 1 if house is categorized
other house type x
 differently
balcony 1 if property has a balcony x x
 1 if apartment has access
garden x x
 to a private garden
 1 if object includes a
guest toilet x x x
 guest toilet
 1 if object comes with a
fitted kitchen x x
 fitted kitchen
 1 if property contains a
granny flat separate “granny flat” or x
 secondary suite
 1 if cellar room is
cellar x x
 available
 1 if object is declared as
assisted living x
 assisted living
 1 if common charge is de-
common charge x
 clared in offer
 1 if property contains a
lift x
 passenger lift
 [1] In the report on the property market of the federal state of North Rhine-Westphalia (Der Obere Gutachteraus-
schuss für Grundstückswerte im Land Nordrhein-Westfalen 2017) the referees do not count sales of undeveloped
rural plot area under 2 500 sqm in their statistics of farmland sales. This is also the case in the report on the
property market for the scarcely populated state of Saxony-Anhalt (Gutachterausschuss für Grundstückswerte in
Sachsen-Anhalt 2017). This gives a notion that plot areas above the margin of 2 500 sqm can be of interest for
agricultural and not only residential purpose. To focus on house sales for living purposes without further com-
mercial use, only plot areas smaller than 2 500 sqm are included in the following.

 21
Datenbeschreibung

 Leibniz-Institut für
 Wirtschaftsforschung

 Das RWI wird vom Bund und vom Land
 Nordrhein-Westfalen gefördert.
You can also read